 ________
///// \\\\
\________/_______________________________________________________________
|_____                            : ___                                  \
| |   |                           :|   \ |           |     |             /
| |   |__   __  |___  |_____   __ :|___/ |    ___  __|__ __|__  __  |__  \
| |   |  | /  \ |   \ |  |  | /  \:|     |   /   \   |     |   /  \ |  \ /
| |   |  | |__/ |     |  |  | |  |:|     |   |   |   |     |   |__/ |    \_____
| |   |  | \__  |     |  |  | \__/:|     \__ \___/   \__   \__ \__  |    :2.3.0\
|_________________________________:______________________________________:_____/

ThermoPlotter is a toolkit used to simplify the analysis of data produced by specialist materials science codes, centred around thermoelectrics, but also useful for anything pertaining to electronic and/ or phononic transport. ThermoPlotter is a Python library which contains functions for data retrieval, manipulation and plotting, which can be easily used with a little Python knowlege to generate a wide array of high-quality plots in only a few lines of code. ThermoPlotter also contains a suite of command-line tools which can retrieve specific data, save derived properties and plot graphs in a single command.
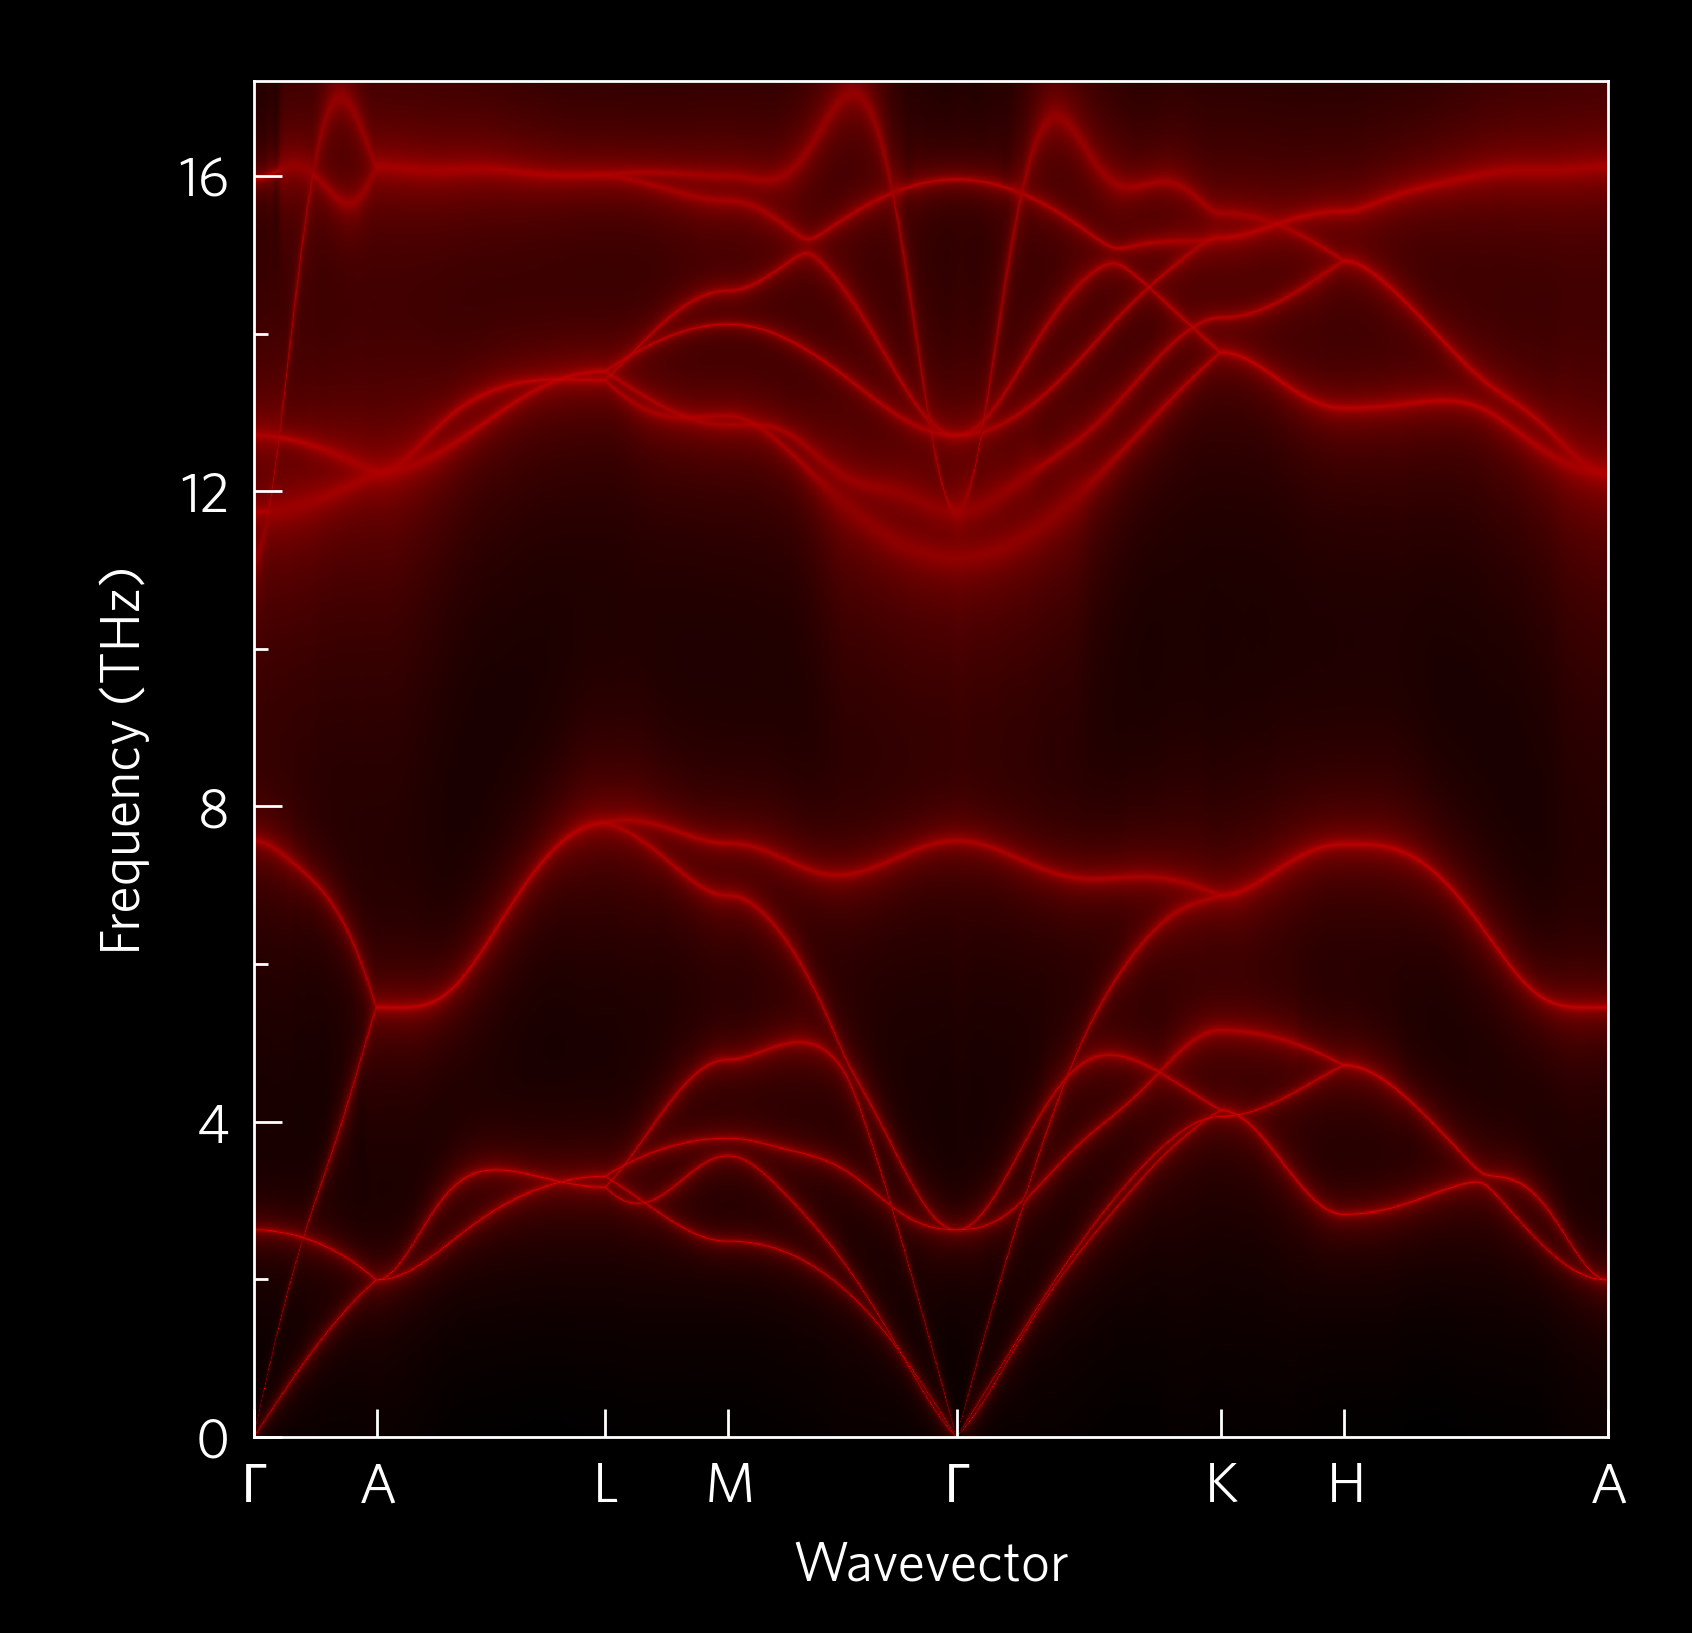
Click on the image to go to the gallery!
Installation
ThermoPlotter can easily be installed with git and pip:
git clone https://github.com/SMTG-UCL/ThermoPlotter.git
cd ThermoPlotter
pip install .
After installing, you may want to copy ThermoPlotter/tprc.yaml to
~/.config/tprc.yaml, if you want to set your own default axis
labels, unit conversions, default style sheets (two are provided),
other aesthetic alterations and more!
Mac
If installing on an m1 mac, you can't currently pip install h5py, so a longer process is required:
- Install brew
- Install hdf5 with brew
python3 -m pip install cython numpybrew info hdf5to retrieve the path to your hdf5 installHDF5_DIR=YOUR_HDF5_PATH --no-build-isolation h5pygit clone https://github.com/SMTG-UCL/ThermoPlotter.gitcd ThermoPlotterpip install --user -e .
Using conda may circumvent this process.
Command Line Usage
ThermoPlotter uses click, which has an easily navigable structure from the command-line, detailed in the tutorials.
Python Usage
ThermoPlotter is designed to have four main stages:
- Axes:
- Pick an axis layout from
tp.axes.
- Load:
- Use the functions is
tp.data.loadto load the relevant data.
- Add:
- Use functions in
tp.plotmodules to add graphs to the axes.
- Save:
- Use
plt.savefigor equivalent to produce the figure.
As ThermoPlotter is dependent on matplotlib, each stage can be
substituted with bespoke code, e.g. using matplotlib.pyplot.subplots
or matplotlib.axes.Axes.scatter. These can still be supplemented
with ThermoPlotter helper functions, such as default labels which the
user can set in tp.settings, colourmap generators in
tp.plot.colour or legend helpers such as tp.axes.legend.alphabetise.
The best way to get a feel for ThermoPlotter is to see it in action: Take a look at our examples and tutorials. Currently supported codes are:
Current plotting modes are split into four areas.
tp.plot.phononscontains plots along a high-symmetry path, including phonon dispersions and plots which project other quantities onto these paths in various ways.tp.plot.frequencyplots frequency on the x-axis, including density of states (DoS), cumulative kappa, "waterfall" and density plots. Each function has amainargument, which can be useful when plotting multiple quantities on the same set of axes; and aninvertargument, which swaps the x and y axes to let you plot DoS-style next to atp.plot.phononsplot.tp.plot.mfpcontains a cumulative kappa against mean free path plot.tp.plot.heatmapcontains a heatmap plotter, and wrappers which format appropriately for ZT against temperature and doping concentration; and one which plots the lattice thermal conductivity required to reach a target ZT, again against temperature and doping.
A set of example scripts is provided in the tp/examples folder and
in our online examples, and there is documentation.
Contributing
We welcome any contributions, whether they be a feature request or a new piece of code (or anything else). Adding options is inteded to be straightforward; the modularity of the code means that each step is mostly independent of the others.
Bugs and feature requests can be submitted to the issue tracker,
while contributions can be made using the fork and pull approach.
Contributions should include comprehensive docstrings, and where
appropriate examples, further documentation and tests are greatly
appreciated. Documentation uses the sphinx package, and can be built from
the docs directory with sphinx-build -b html src/ ..
Testing
Tests use the unittest package, and can be run from the test directory
with python3 -m unittest.
Contributors
Many thanks to all those who contributed code or ideas to ThermoPlotter! Roughly chronologically, they are so far:
- Kieran B. Spooner
- Maud Einhorn
- David O. Scanlon
- Daniel W. Davies
- Bonan Zhu
- Sean R. Kavanagh
- Warda Rahim
- Katarina Brlec
- Joe Willis
License
ThermoPlotter is licensed under the GNU Affero General Public License v3 (AGPLv3).
Requirements
ThermoPlotter uses the following open-source packages: