Some useful chart modules using d3js (v4).
- Renders svg, so no loss of resolution when zoomed
- Supports window resize and adapts to the width of the parent
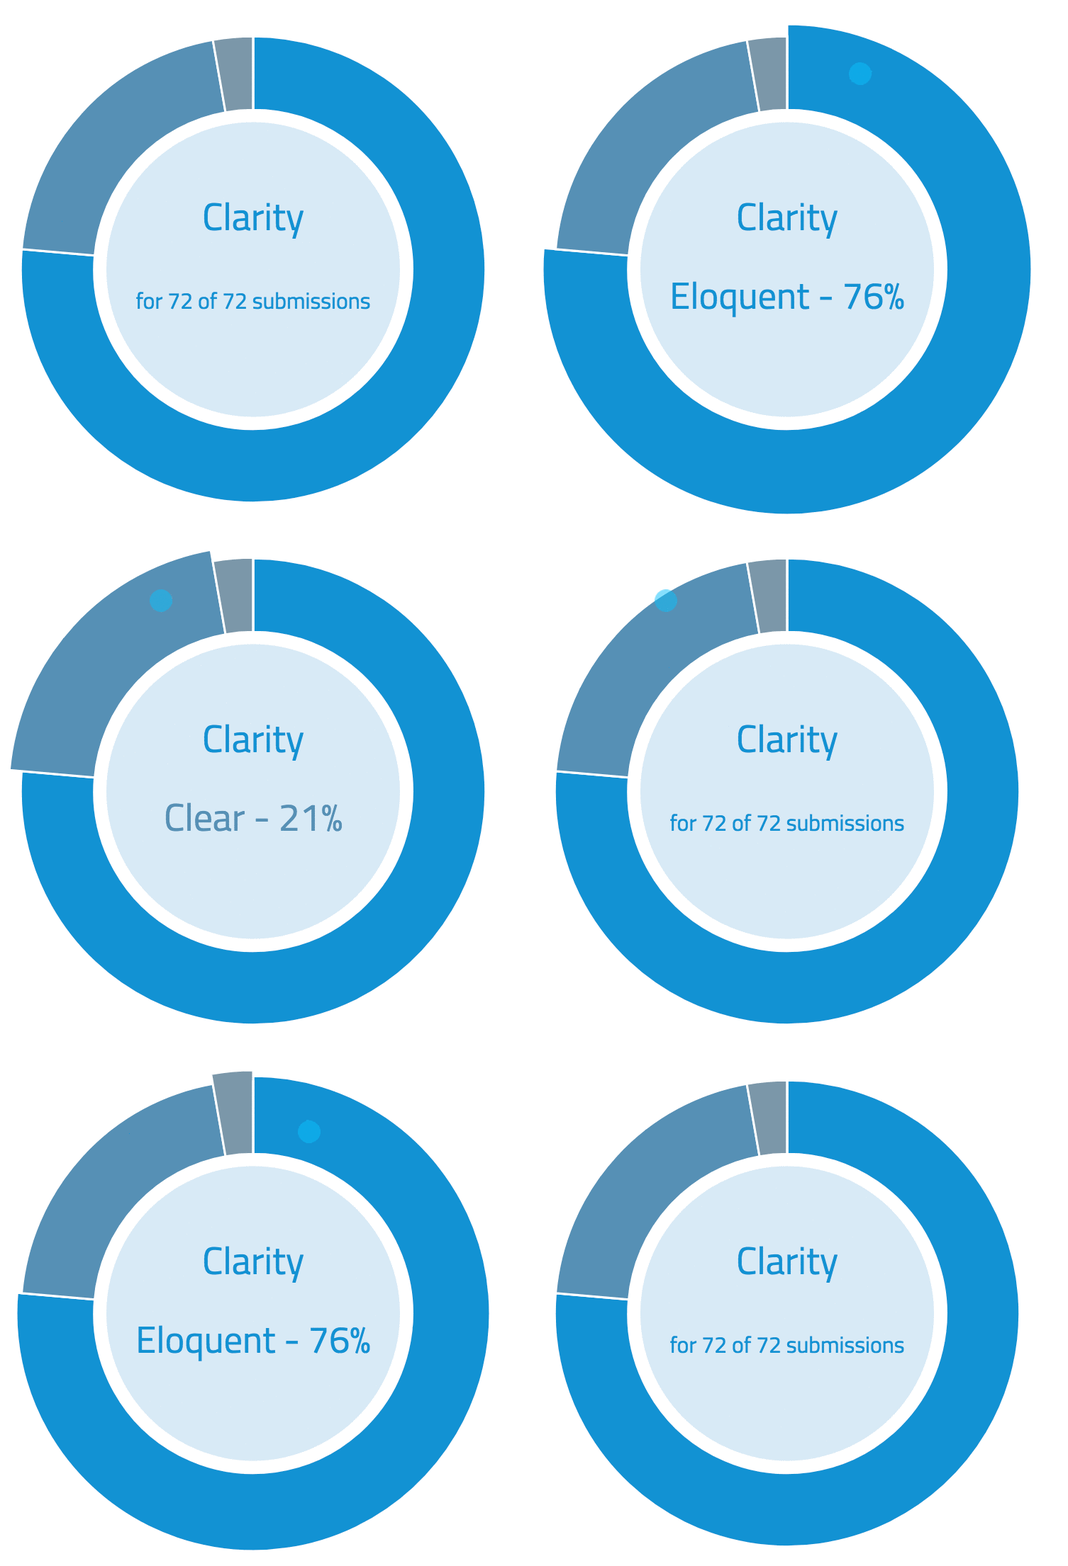
- Create pretty interactive donut charts
- Supports onclick attributes
- Bounce on mouse out
- Automatic sizing of fonts based on the width of chart container
<head>
  <script type="text/javascript" src="//path/to/d3.v4.min.js"></script>
  <script type="text/javascript" src="//path/to/donut_chart.js"></script>
  <link rel="stylesheet" type="text/css" href="//path/to/donut_chart.css">
</head>
<div class="chart_container"></div>
<script type="text/javascript">
  var dataJson = {
    values: [
      {
        category: "California",
        value: 256,
        color: '#428ab5',
        onclick: "console.log('clicked California');",
        center_subtext: "Category: California"
      },
      {
        category: "Oregon",
        value: 123,
        color: '#A7A7A7',
        onclick: "console.log('clicked Oregon');",
        center_subtext: "Category: Oregon"
      },
      {
        category: "Unknown",
        value: 55,
        color: "#CECECE",
        center_subtext: "Category: Unknown"
      }
    ],
    center_text: {
      enabled: true,
      text: "CenterText",
      color: '#428ab5'
    },
    center_subtext: {
      enabled: true,
      color: '#428ab5',
      text: "center sub text"
    },
    center_circle: {
      enabled: true,
      color: '#428ab5'
    }
  }
  var options = {
    // Automatically create a color gradient from red to blue when colors are not assigned to values
    minCategoryFillColor: "red",
    minCategoryFillColor: "blue",
    // Automatically adjust the font size of the center text and subtext based on the size of the chart
    maxCenterSubtextFontSize: 18,//px
    maxCenterTextFontSize: 18,//px
  }
  ModestCanvas.donutChart(".chart_container", dataJson, options);
</script>
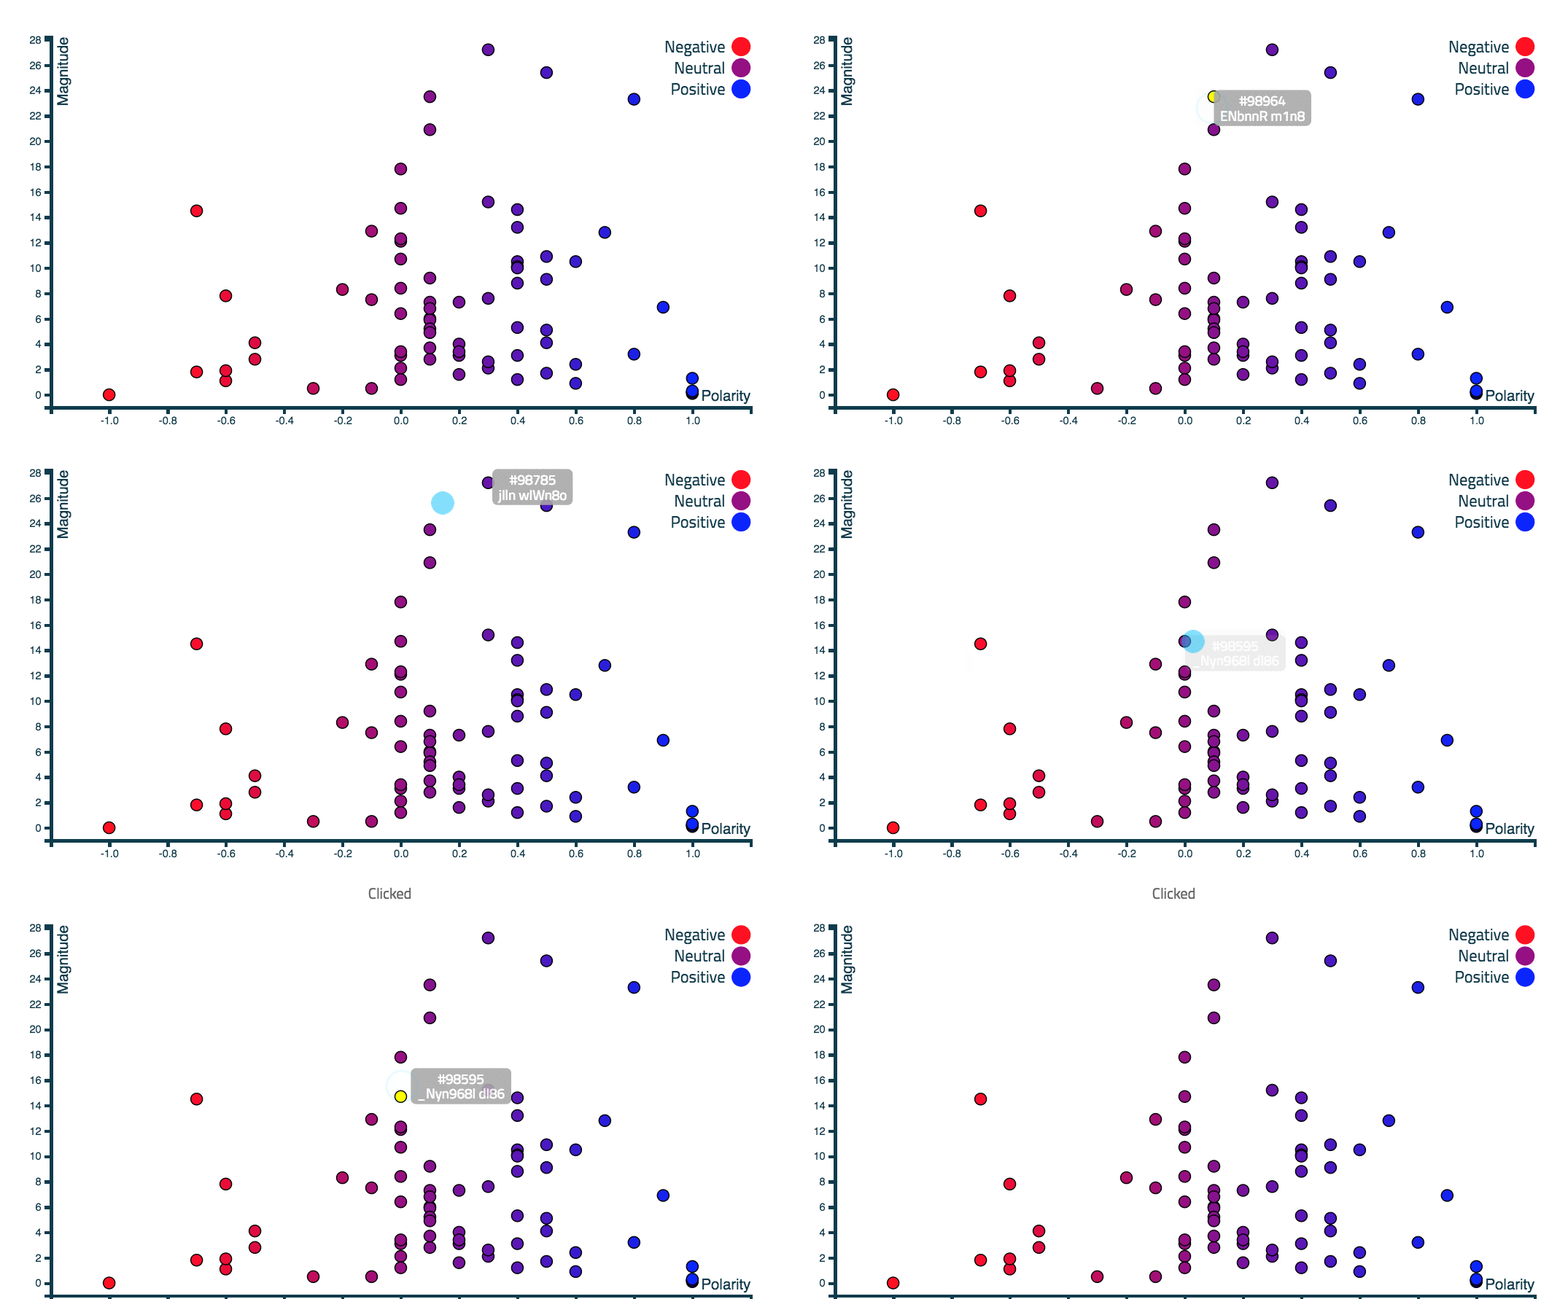
- Interactive
- Supports onclick attributes
<head>
  <script type="text/javascript" src="//path/to/d3.v4.min.js"></script>
  <script type="text/javascript" src="//path/to/scatter_plot.js"></script>
  <link rel="stylesheet" type="text/css" href="//path/to/scatter_plot.css">
</head>
<div class="chart_container"></div>
<script type="text/javascript">
  var dataJson =  {
    values: [
      {
        coordinates: {
          x: -0.5,
          y: 33,
        },
        point: {
          attributes: {
            onclick: "console.log('clicked -0.5');"
          }
        },
        tooltip: {
          text: "Sentiment ID #1234",
        }
      },
      {
        coordinates: {
          x: 0.9,
          y: 13
        },
        point: {
          attributes: {
            onclick: "console.log('clicked 0.9');"
          }
        },
        tooltip: {
          text: "Sentiment ID #1233",
        }
      }
    ],
    tooltip: {
      enabled: true,
    },
    axes: {
      enabled: true,
      x: {
        label: "Polarity",
        custom_ticks: {"-1": "Negative", "0": "Neutral", "1": "Positive"}
      },
      y: {
        label: "Magnitude"
      }
    },
    legend: {
      enabled: true,
      domain: [
        {for: -1, label: "Negative"},
        {for: 0, label: "Neutral"},
        {for: 1, label: "Positive"},
      ]
    },
    colors: {
      x_based: true,
      y_based: false,
      domain: [-1, 1]
    }
  }
  var options = {
    // Automatically create a color gradient for the circles
    minCircleFillColor: "#000000",
    maxCircleFillColor: "#BBBBBB",
  }
  ModestCanvas.scatterPlot(".chart_container", dataJson, options);
</script>
- Heavily inspired by the works of Jason Davies and Jonathan Feinberg
- Words can be colored and grouped by category
<head>
  <script type="text/javascript" src="//path/to/d3.v4.min.js"></script>
  <script type="text/javascript" src="//path/to/word_cloud.js"></script>
  <link rel="stylesheet" type="text/css" href="//path/to/word_cloud.css">
</head>
<div class="chart_container"></div>
<script type="text/javascript">
  var dataJson =  [
    {
      category: 'Animals',
      word: 'Lion',
      frequency: 123,
    },
    {
      category: 'Birds',
      word: 'Pigeon',
      frequency: 222
    },
    {
      category: 'Animals',
      word: 'Snow Leopard',
      frequency: 22
    },
    {
      category: 'Animals',
      word: 'Fox',
      frequency: 3,
    },
    {
      category: 'Birds',
      word: 'Parrot',
      frequency: 99
    },
    {
      category: 'Animals',
      word: 'Rabbit',
      frequency: 939
    }
  ]
  var options = {
    // Automatically create a color gradient for the words based on categories
    minCategoryFillColor: "#000000",
    maxCategoryFillColor: "#BBBBBB",
    hideCategoryAxis: true
  }
  ModestCanvas.wordCloud(".chart_container", dataJson, options);
</script>
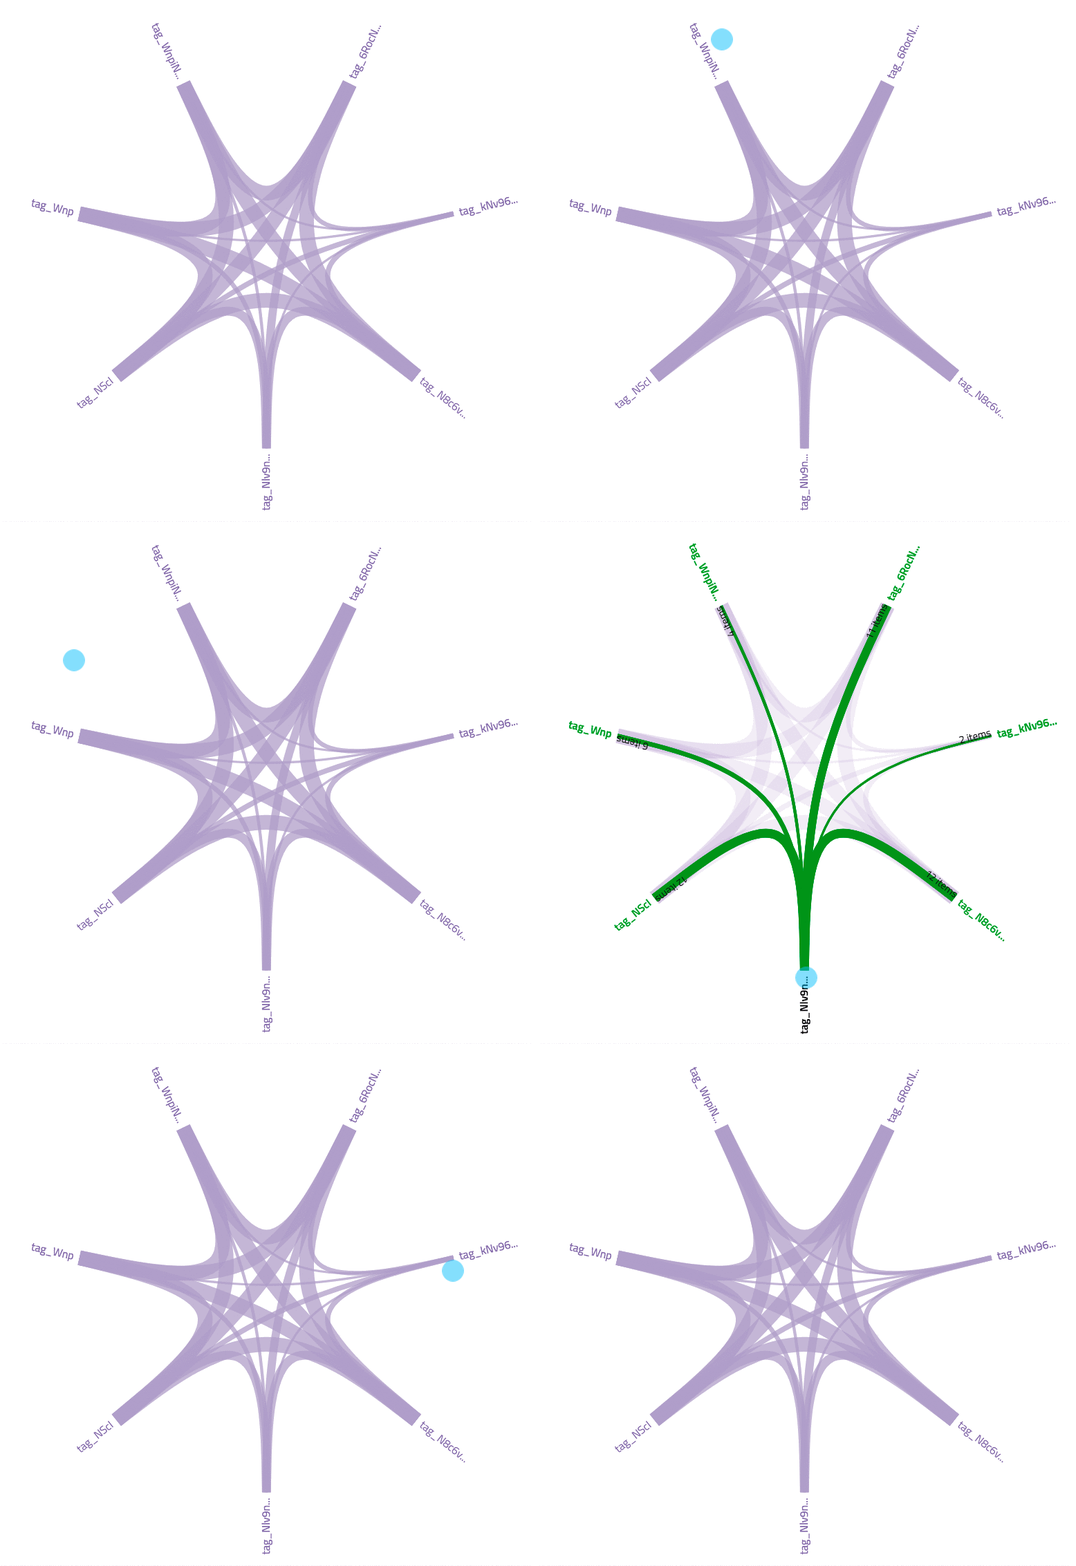
- Inspired by the work of Mike Bostock with minor improvements
- Hovering over a node will color the out edges and display the weight
<head>
  <script type="text/javascript" src="//path/to/d3.v4.min.js"></script>
  <script type="text/javascript" src="//path/to/edge_bundling.js"></script>
  <link rel="stylesheet" type="text/css" href="//path/to/edge_bundling.css">
</head>
<div class="chart_container"></div>
<script type="text/javascript">
  var dataJson =  [
    {
      name: "Tag 1",
      edges: [
        {
          name: "Tag 2",
          weight: 123
        },
        {
          name: "Tag 3",
          weight: 12
        },
      ]
    },
    {
      name: "Tag 2",
      edges: [
        {
          name: "Tag 1",
          weight: 66
        },
        {
          name: "Tag 3",
          weight: 35
        },
      ]
    },
    {
      name: "Tag 3",
      edges: [
        {
          name: "Tag 1",
          weight: 55
        },
        {
          name: "Tag 2",
          weight: 1
        },
      ]
    }
  ]
  ModestCanvas.edgeBundling(".chart_container", dataJson);
</script>
MIT


