Artistic visualization of humanity's fraught relationship with freshwater by Caitlin & Misha for the Immersive Scholar residency at NCSU
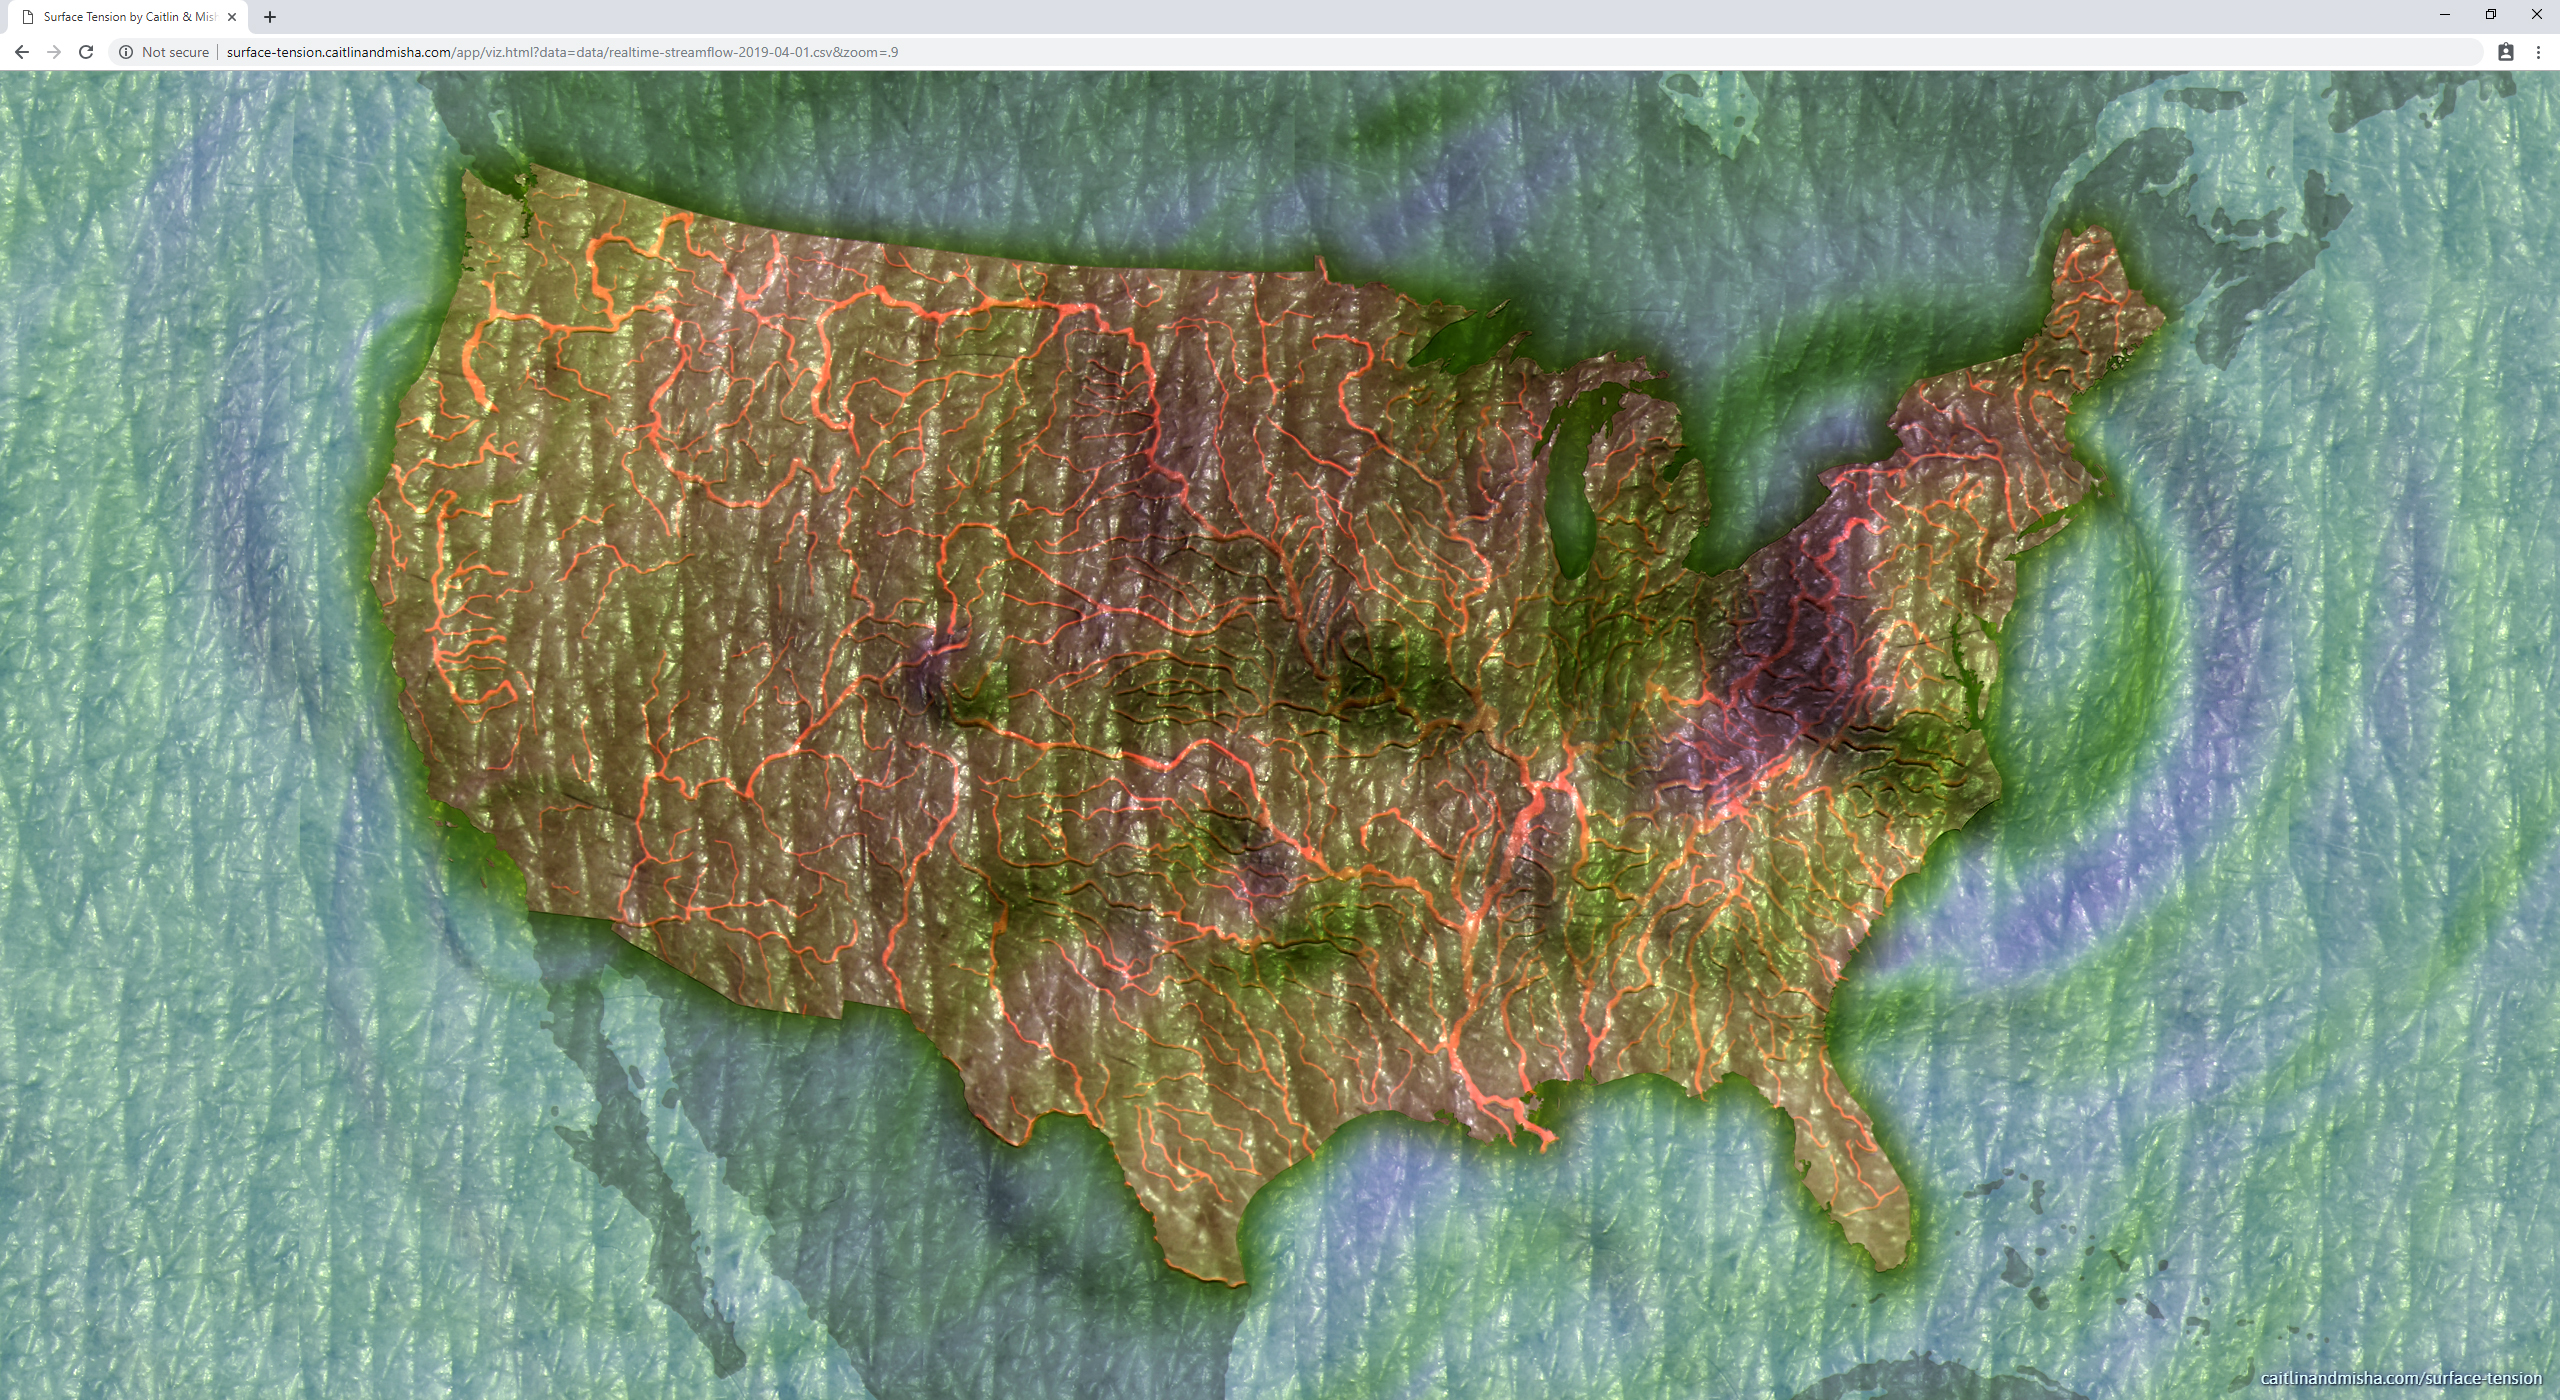
This visualization maps streamflow data from the United States Geological Survey in real time across the US. Water supports life but can also drown and destroy. People are mostly water, but the melting ice caps threaten our very existence. Harnessing this elemental force requires a balancing act and this artwork is a reflection on humanity's fraught relationship with freshwater.
Special thanks to NC State Libraries, the Immersive Scholar Residency, the Andrew W. Mellon Foundation, and the Raleigh USGS.
See it live here surface-tension.caitlinandmisha.com or visit the about page caitlinandmisha.com/surface-tension
We created Surface Tension during an Immersive Scholar Residency at NC State which is focused on “the creation and sharing of digital scholarship in large-scale and immersive visualization environments” and Findable, Accessible, Interoperable, and Re-Usable (FAIR) data. Since sealevel rise still seems abstract to most people (due to greed or because humans aren't wired for longterm risk assessment) we are using USGS realtime streamflow data which directly references the water we drink and interact with daily.
The size of the blobs on the map represent increases in 'percentile' of streamflow at each of the ~11K sites, each site comparing only to itself, for the entire period of record. To find out more about the chosen colors and other aspects of the visuals, check out the about page caitlinandmisha.com/surface-tension.
Install VirtualBox and Vagrant
Clone the repository
git clone git@github.com:immersive-scholar/surface-tension
Enter the surface-tension directory
cd surface-tension
Build the environment
vagrant up
Visit http://localhost:8080
Surface Tension consists of a PHP script index.php and a JavaScript-powered html page viz.html. The PHP script's role is to cache USGS streamflow data and provide it to viz.html for display. We first began working on this during the last Government Shutdown and saw warnings about a 'lapse in appropriations' on the USGS websites. This scared us into realizing that as much as data is made available, we shouldn't take it for granted (also in solidarity with initiatives such as DataRefuge).
The PHP script sees if data for today has been cached in app/data already. If not, it downloads the data from USGS using curl. If there is some problem, it looks in app/data for previously downloaded data instead. Once it figures out the path to the data, it redirects to the viz.html and passes the path to the data file via query string parameter. Viz.html can take other query string parameters besides 'data'. In order to create one consistent interface to the visualization, the PHP can also forward these other parameters to viz.html
sidebar in percent, (default 0), e.g.
http://surface-tension.caitlinandmisha.com?sidebar=22
sorting using allowed USGS data columns (site_no, dec_lat_va, dec_long_va, huc_cd, flow, stage, class, percentile, percent_median, percent_mean), e.g.
http://surface-tension.caitlinandmisha.com?sidebar=22&sorting=dec_long_va
zoom (default 0.8 based on our chosen D3 projection scaling), e.g.
http://surface-tension.caitlinandmisha.com?sidebar=22&sorting=dec_long_va&zoom=1
map can be set to false to show Surface Tension (variant), e.g.
http://surface-tension.caitlinandmisha.com?sidebar=22&sorting=dec_long_va&zoom=1&map=false
To monitor performance, a graph of frames per second (FPS) can be shown by hitting 's' on the keyboard, or passing in stats=on for the JavaScript viz.html only (not PHP). For example:
http://surface-tension.caitlinandmisha.com/app/viz.html?data=data/realtime-streamflow-2019-04-11.csv&map=false&stats=on
The data caching script relies on getting the correct date in php, which further relies on the php.ini file having the correct timezone set on the server. If this is not set, the program defaults to America/New_York. Surface Tension is hosted on a server that has it's date set to the Los Angeles timezone. The mismatch of 3 hours between the Los Angeles timezone cached data file naming and the first client's timezone that requested the caching (Raleigh, NC, EST) needs to be reconciled. One idea is to have the timezone calculated client-side and passed to the PHP. This is not urgent because USGS labels data collection times in the data itself.
Thanks to the Three.js community!