(Assuming that participants have gone through PnP, DPS and Hub steps prior)
Now that your device is sending data to the cloud you'll need a data historian to not only store and retain data, but also for ad hoc querying and analysis, as well as visualizations. Introducing Azure Time Series Insights Preview (TSI). TSI is an end-to-end PaaS offering to ingest, process, store, and query highly contextualized, time-series-optimized, IoT-scale data. TSI is tailored towards the unique needs of industrial IoT deployments with capabilities including multi-layered storage, time series modeling, and cost-effective queries over decades of data. The Time Series Insights Preview pay-as-you-go (PAYG) SKU just launched additional features, many of which we will explore today.
Step 1: Create an Azure Time Series Insights Preview environment
- Sign-in to the Azure portal by using your subscription account.
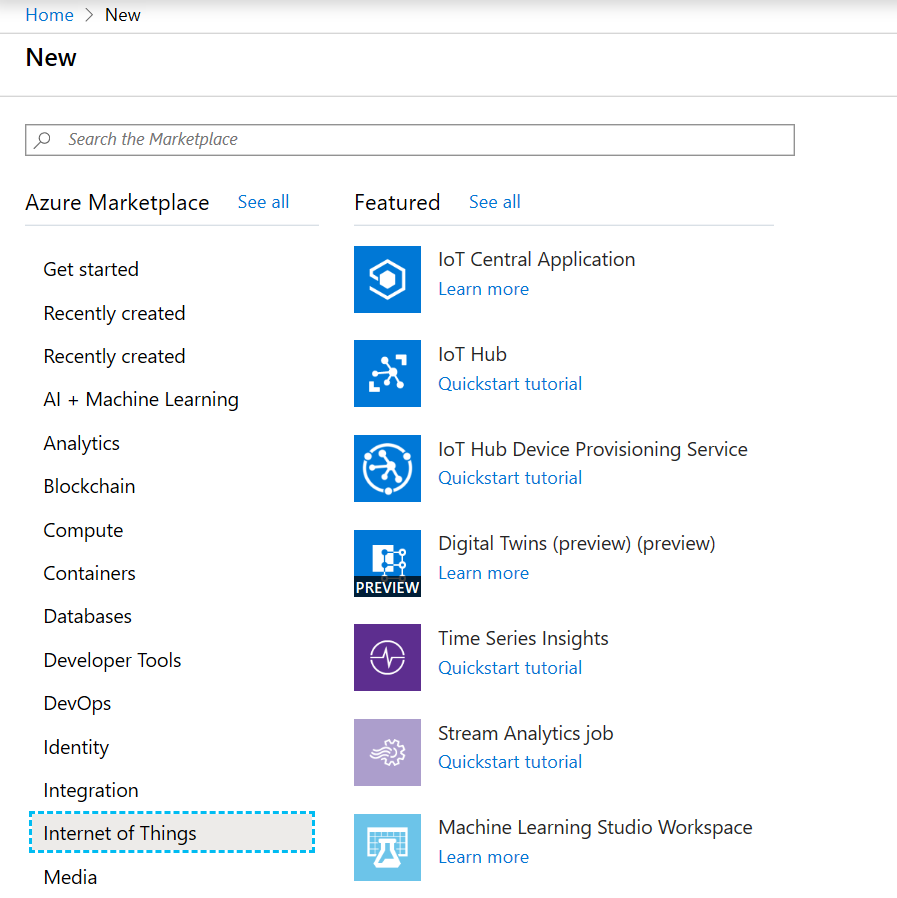
- Select Create a resource > Internet of Things > Time Series Insights.
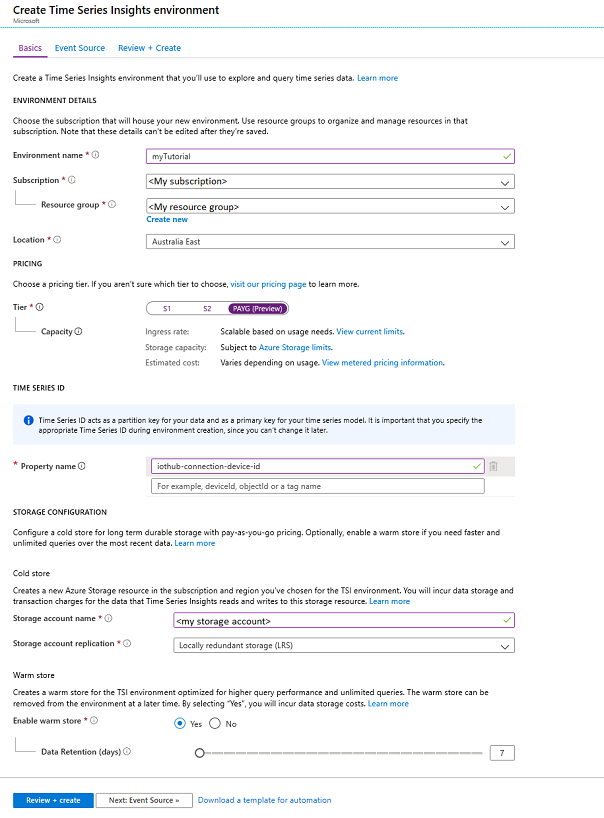
- In the Create Time Series Insights environment pane, on the Basics tab, set the following parameters:
| Parameter | Action |
|---|---|
| Environment name | Enter a unique name for the Azure Time Series Insights Preview environment. |
| Subscription | Enter the subscription where you want to create the Azure Time Series Insights Preview environment. A best practice is to use the same subscription as the rest of the IoT resources that are created by the device simulator. |
| Resource group | Select an existing resource group or create a new resource group for the Azure Time Series Insights Preview environment resource. A resource group is a container for Azure resources. A best practice is to use the same resource group as the other IoT resources that are created by the device simulator. |
| Location | Select a datacenter region for your Azure Time Series Insights Preview environment. To avoid additional latency, it's best to create your Azure Time Series Insights Preview environment in the same region as your IoT Hub created by the device simulator. |
| Tier | Select PAYG (pay-as-you-go). This is the SKU for the Azure Time Series Insights Preview product. |
| Property ID | Enter a value that uniquely identifies your time series instance. The value you enter in the Property ID box is immutable. You can't change it later. For this tutorial, enter iothub-connection-device-id. To learn more about Time Series ID, see Best practices for choosing a Time Series ID. |
| Storage account name | Enter a globally unique name for a new storage account. |
| Enable Warm Store? | Select Yes to enable warm store. |
| Data Retention (days) | Choose the default option of 7 days |
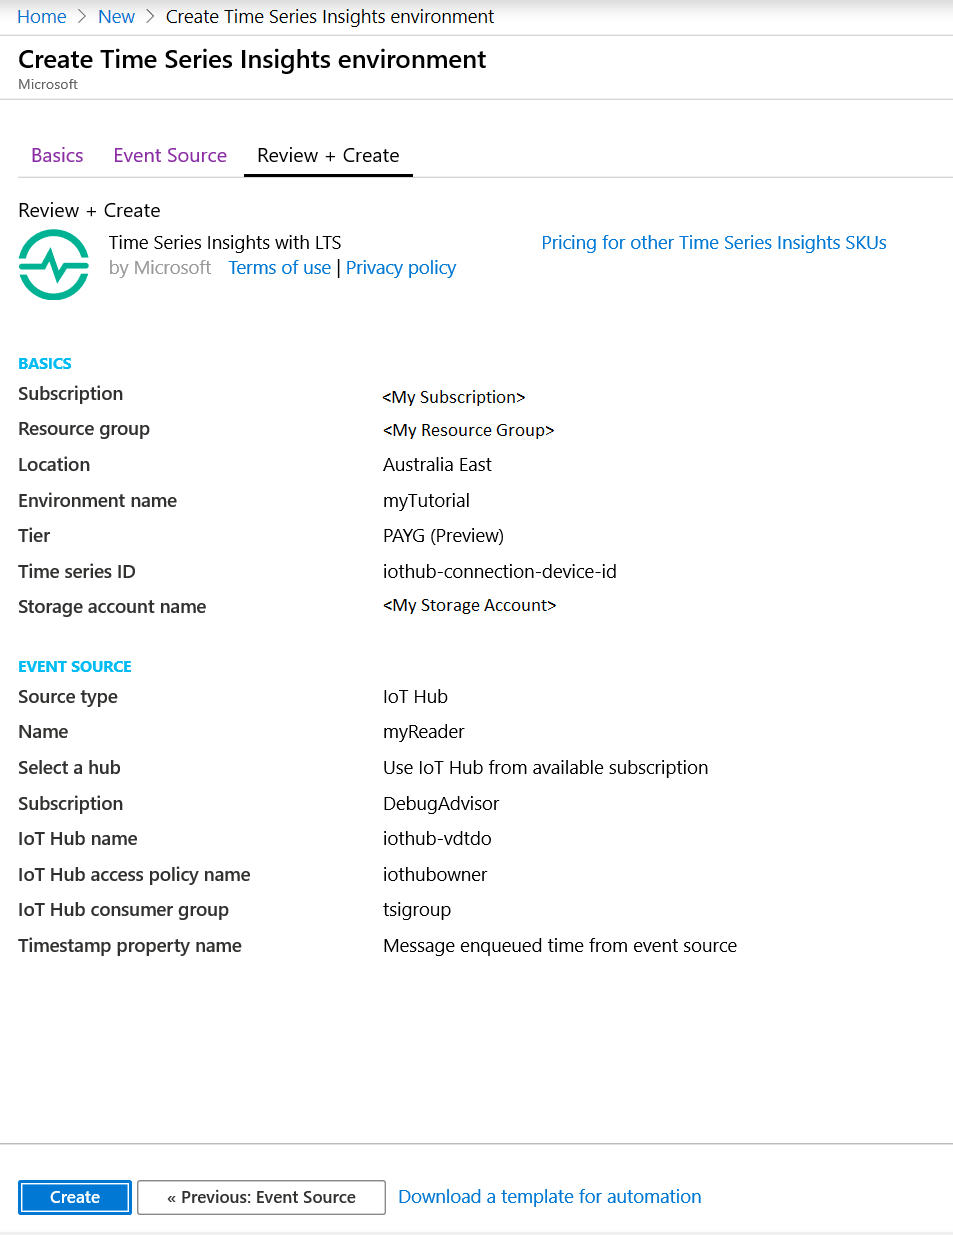
- Click on “Next: Event Source” to establish a connection between your IoT Hub and TSI:
| Parameter | Action |
|---|---|
| Create an event source? | Select Yes. |
| Name | Enter a unique value for the event source name. |
| Source type | Select IoT Hub. |
| Select a hub | Choose Select existing. |
| Subscription | Select the subscription that you're using for the lab. |
| IoT Hub name | Select the IoT Hub that was created in a previous step. |
| IoT Hub access policy | Select iothubowner. |
| IoT Hub consumer group | Select New, enter a unique name, and then select Add. The consumer group must be a unique value in Azure Time Series Insights Preview. |
| Timestamp property | This value is used to identify the Timestamp property in your incoming telemetry data. Leave this box empty. When left empty, Time Series Insights will default to the message enqueued timestamp set by IoT Hub or Event Hub. This is sufficient for the lab. |
- Click on “Review + create”
-
Click “Create”
-
Once your deployment is complete, navigate to your new Time Series Insights resource in the Azure portal. You should have access to your environment by default. To verify, select "Data Access Policies" under "Settings." If you do not see your credentials listed, grant yourself access by clicking "Add" and searching for your identity.
Step 2: Explore data in your TSI Environment
In this section, you will explore data in your new environment via the Azure Time Series Insights Preview explorer.
- On the "Overview" pane you'll see the link to your TSI explorer:
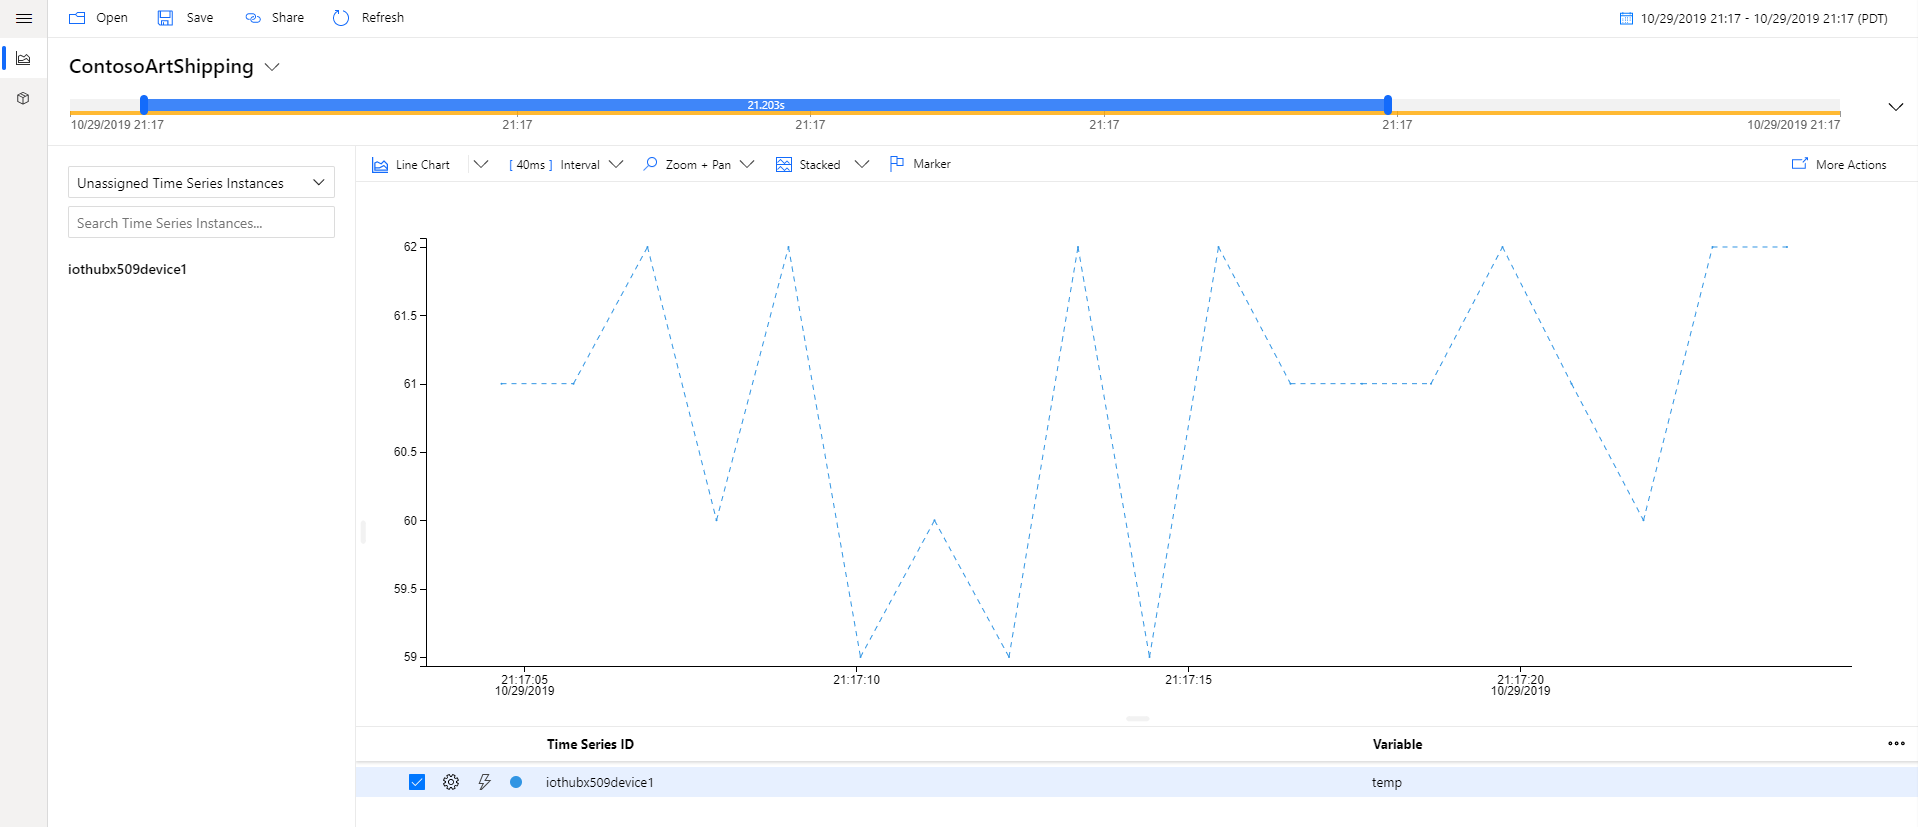
- Wait for the environment to load in the browser. Once it loads, you'll be on the default landing page. Some of the key features include:
- Selecting a time range: You can select a different time range by dragging the handles of the availability picker, or using the date-time selector in the top right corner. You can expand the bar to see the volume of data over time, or keep it collapsed for a slimmer look. Any time selection that is within the orange bar boundary will query your Time Series Insights environment's warm store. Warm storage is configurable for upto 31 days retention, and is designed for frequent querying of recent data. There is no charge for these queries.
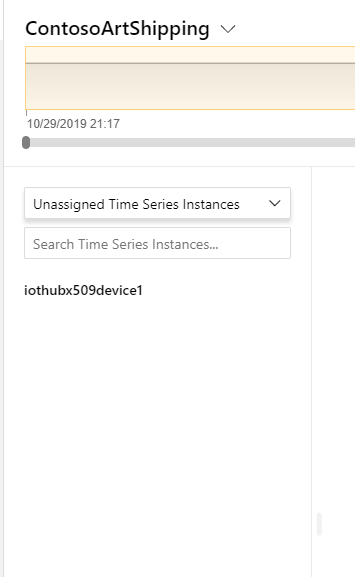
- Hierachy: On the left, you'll see the Time Series Model (TSM) hierachy. Time series that are not yet configured to a hierachy will fall under the default of "Unassigned Time Series Instances."
- Plotting: In the middle of the page is the charting pane where you can visualize events and perform analysis. Below the charting pane is the well which offers additional settings such as time shift and step interpolations.
- Click on your asset tracker, you'll see the properties available for plotting, scroll down and click on “Show humidity". If your selected time range is narrow, expand to view more data. Add more data such as
Step 3: Contextualize and Analyze data
In the previous section, you charted a raw data stream without contextualization. In this section, you will add time series model entities to contextualize your IoT data.
Time Series Model (preview) has 3 components: Types, Hierarchies and Instances.
Types allow users to define calculations, aggregates, and categories over raw telemetry data, as well as define a tag for the sensor (example: Temperature sensor, Pressure sensor). This is achieved by authoring type variables. The DefaultType is pre-configured with three variables: temp, humidity, and EventCount, which can easily be removed or updated if need be.
Hierarchies allow users to specify the structure of their assets. For example, an organization has buildings and buildings have rooms which contain IoT devices. The hierarchy structure in this case will be (Delivery Routes -> ParcelID).
Instances enrich incoming IoT data with device metadata. An instance links to 1 type definition and multiple hierarchy definitions.
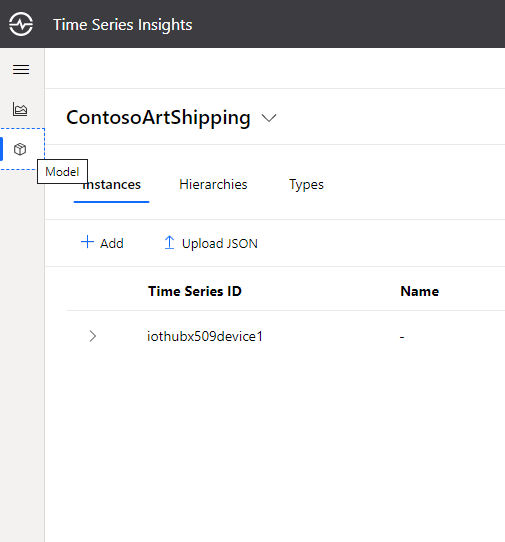
- In the upper left part of the explorer select the Model tab:
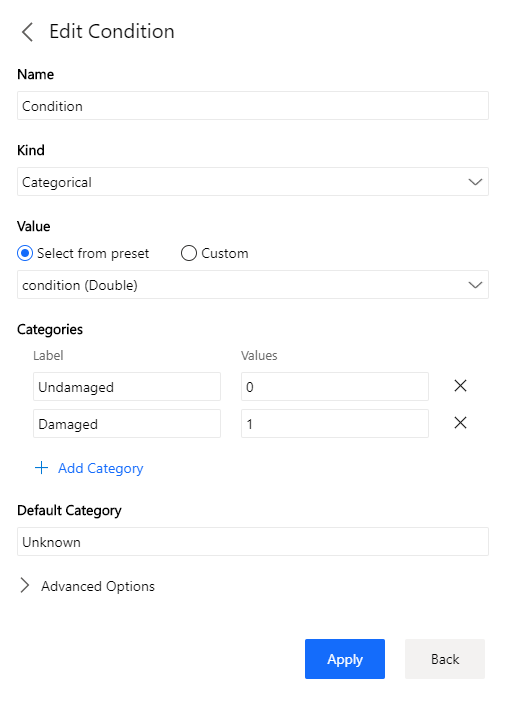
- Next we will update the DefaulType and create a categorical variable. Categorical variables allow you to map a discrete value recieved in an event payload to a specific category label. This enables you to give greater meaning or context to your streaming data, and to ask questions such as "over the past interval, what was the count for a specific category?" ContosoArtShipping's asset trackers are complete with a damage detection module that combines accelerometer data with GPS data to emit a signal indicating the condition of the parcel. Because the signal is numeric--0 for a healthy state and 1 for damaged--we can associate those values to a label. Click on "Types," and on the far right, under "Actions," select the pencil icon.
Update the Name from DefaultType to Asset Tracker Update Description from Default type to "Tracker with temperature, location, and damage sensors" Click on "Variables" and select "Add Variable"
Enter the following:
Name: condition Kind: Categorical Value: Select condition (Double) from the drop-down Categories: Label Value Undamaged 0 Damaged 1
Default Category: Unknown
Add a second variable for latitude:
Name: lat Kind: Numeric Value: Select lat (Double) from the drop-down
Repeat the same steps above for long and click "Save"
-
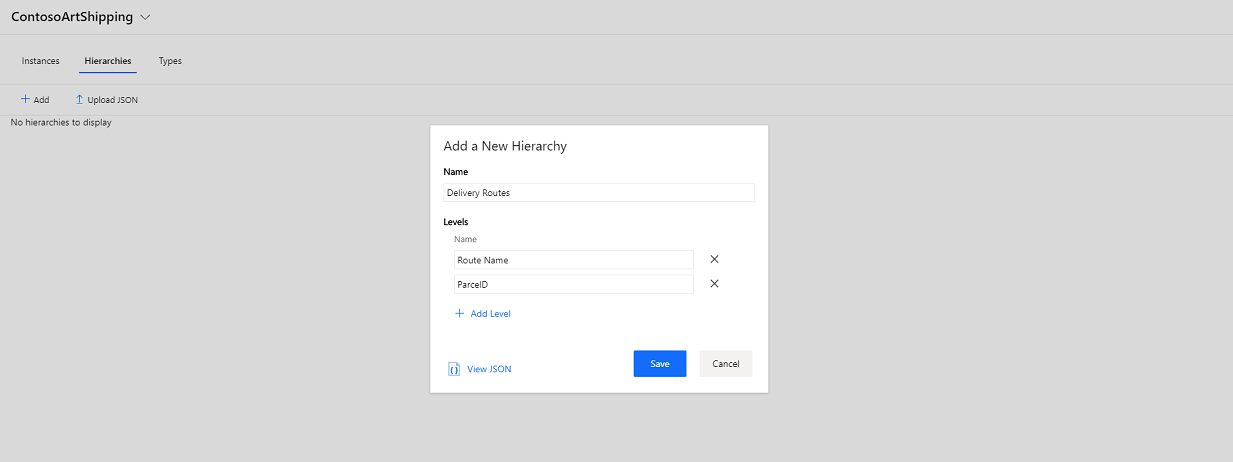
The next step is to add a hierarchy. In the Hierarchies section, select + Add
-
A modal will open. Add the following values: Name: Delivery Routes Levels: Name: Route Name (click + Add Level to expand) ParcelID
Click "Save"
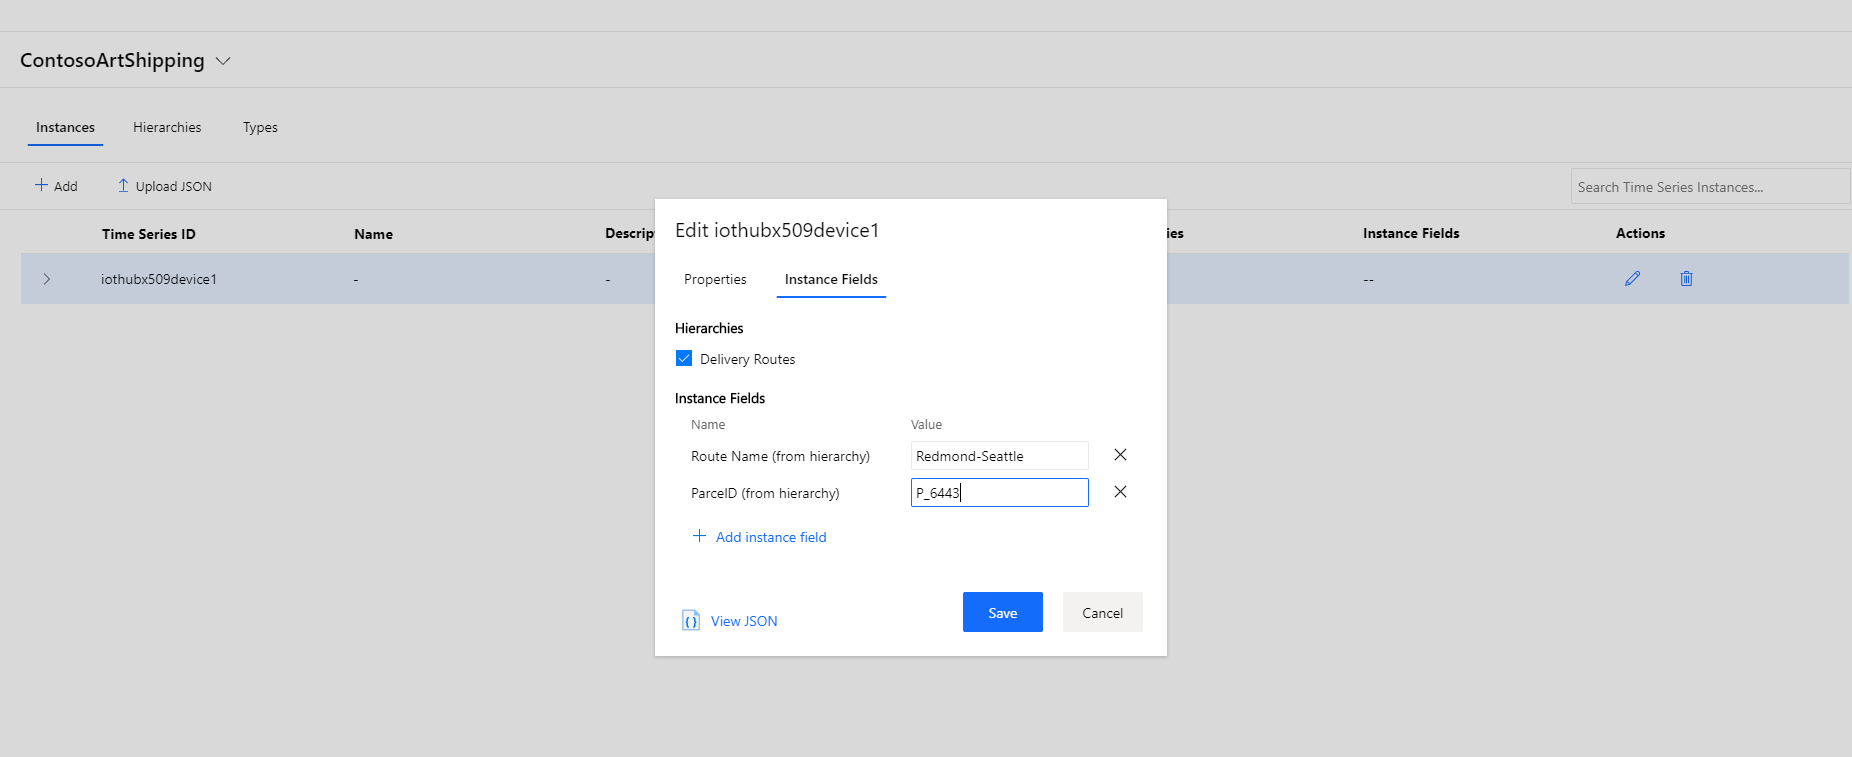
- Next, click on “Instances” and open the edit modal. Verify that the Type in the drop-down is Asset Tracker. Select "Instance Fields" and check Delivery Routes to associate this instance with your hierachy. Enter the following: Route Name (from hierarchy) : Redmond-Seattle ParcelD (from hierarchy) : Enter a unique identifier for your parcel
Save to close the dialogue
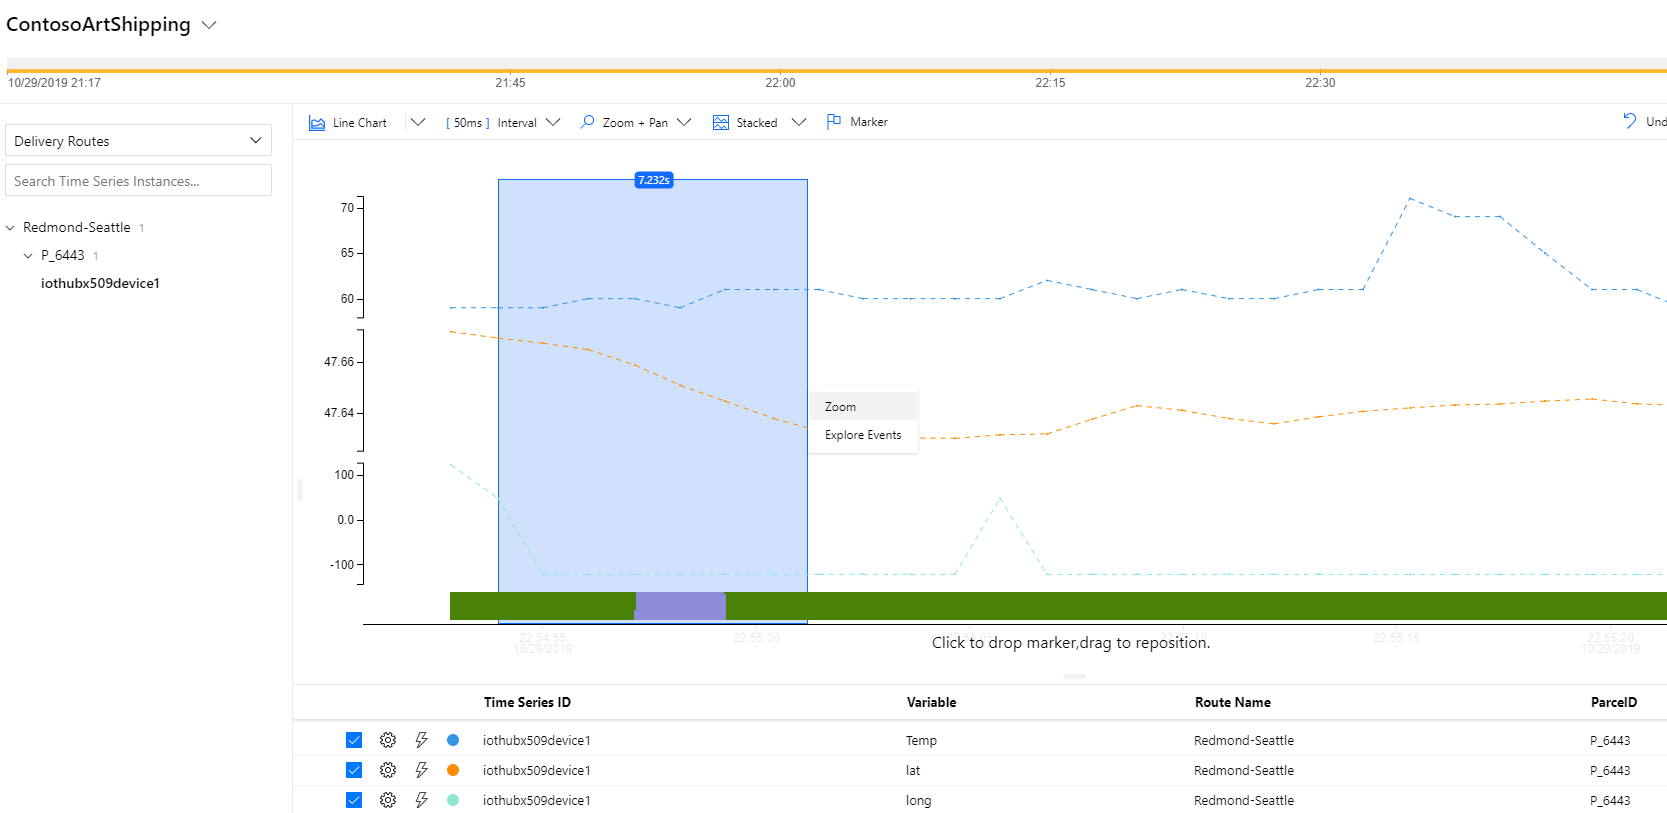
- Navigate back to the Analyze tab to find your tracking device in the Delivery Routes hierachy under the Redmond-Seattle route, associtated to the correct parcel. Now, after expanding the hierarchy and selecting the tracking device, you will see the variables authored above ready to be charted. Click on "Show lat," "Show long," and "Show condition" to add these values to the chart. You'll notice that the category for condition presents two different colors, indicating that there was a "damaged" value received. Perhaps there was a traffic incident that caused the drive to break hard. Someone monitoring the parcels or doing a post-mortem of an incident would most likely want to have data on when and where the damage occured. Click on the chart and drag your cursor over this area to highlight. You will see a tooltip appear with the option to "Zoom"
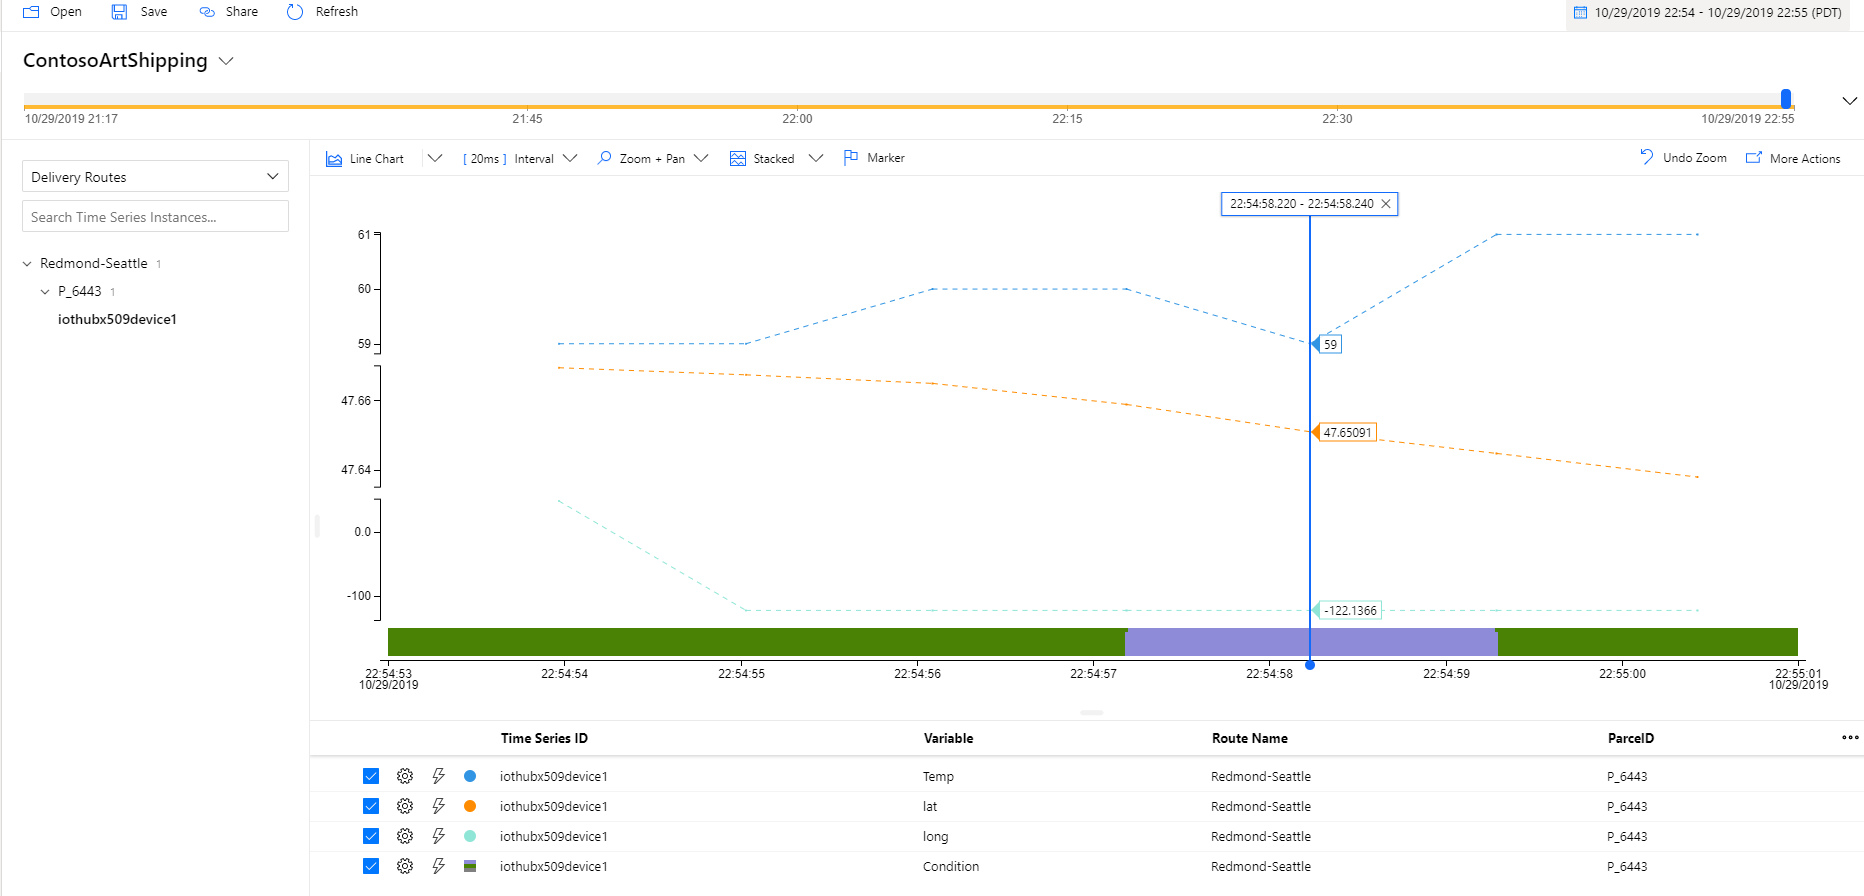
After zooming into these events, select the Marker tool and place it in the chart such that it intersects the lat and long while the sensor was reporting damage, click again to "drop" the marker:
This illistrates the ability of the Time Series Insights preview explorer to help in ad-hoc investigations. Many industrial IoT solutions will rely on some level of automation to further streamline processes. In the next section, we will enable anomoly detection using the Azure Stream Analytics and Event Hub services, before coming back to TSI to add this additional hub as an event source. We finish with a final rendering using Azure Maps and the TSI JavaScript SDK.
