This work describes a submission to the acoustic scene classification task of the DCASE 2017 challenge. The study is based on the following premises:
-
The prevailing tendency of convolutional neural network models employed in audio classification tasks is to utilize spectrogram representations limited to 40-60 mel frequency bands. Higher values are rarely chosen despite the additional granularity they introduce:

Therefore, the main goal of this paper is to check how using spectrograms with different frequency resolution could impact the accuracy in this task.
-
Most acoustic scenes can be described as a combination of a recurring background (ambient noise) mixed with distinct foreground elements (sound events). Still, Mafra et al. (2016) have shown that even a single averaged frame can have a good predictive capacity in acoustic scene classification tasks, it is thus likely that a good model should not be overly complicated. Could both these assumptions be introduced a priori into the architecture of the employed network?

To this end, the proposed system has a simple design coming in two flavors - ambient only or extended with sound event detectors that signal if a template match has occurred anywhere in the whole recording.

The ambience processing model is evaluated with different frequency resolutions (amb* and STFT) and compared with models extended with 15 detector modules trained from scratch (detectors) or with a single detector pre-trained on hand-annotated fragments of cafe/restaurant recordings with sounds invovling cups, plates, etc. (dishes).
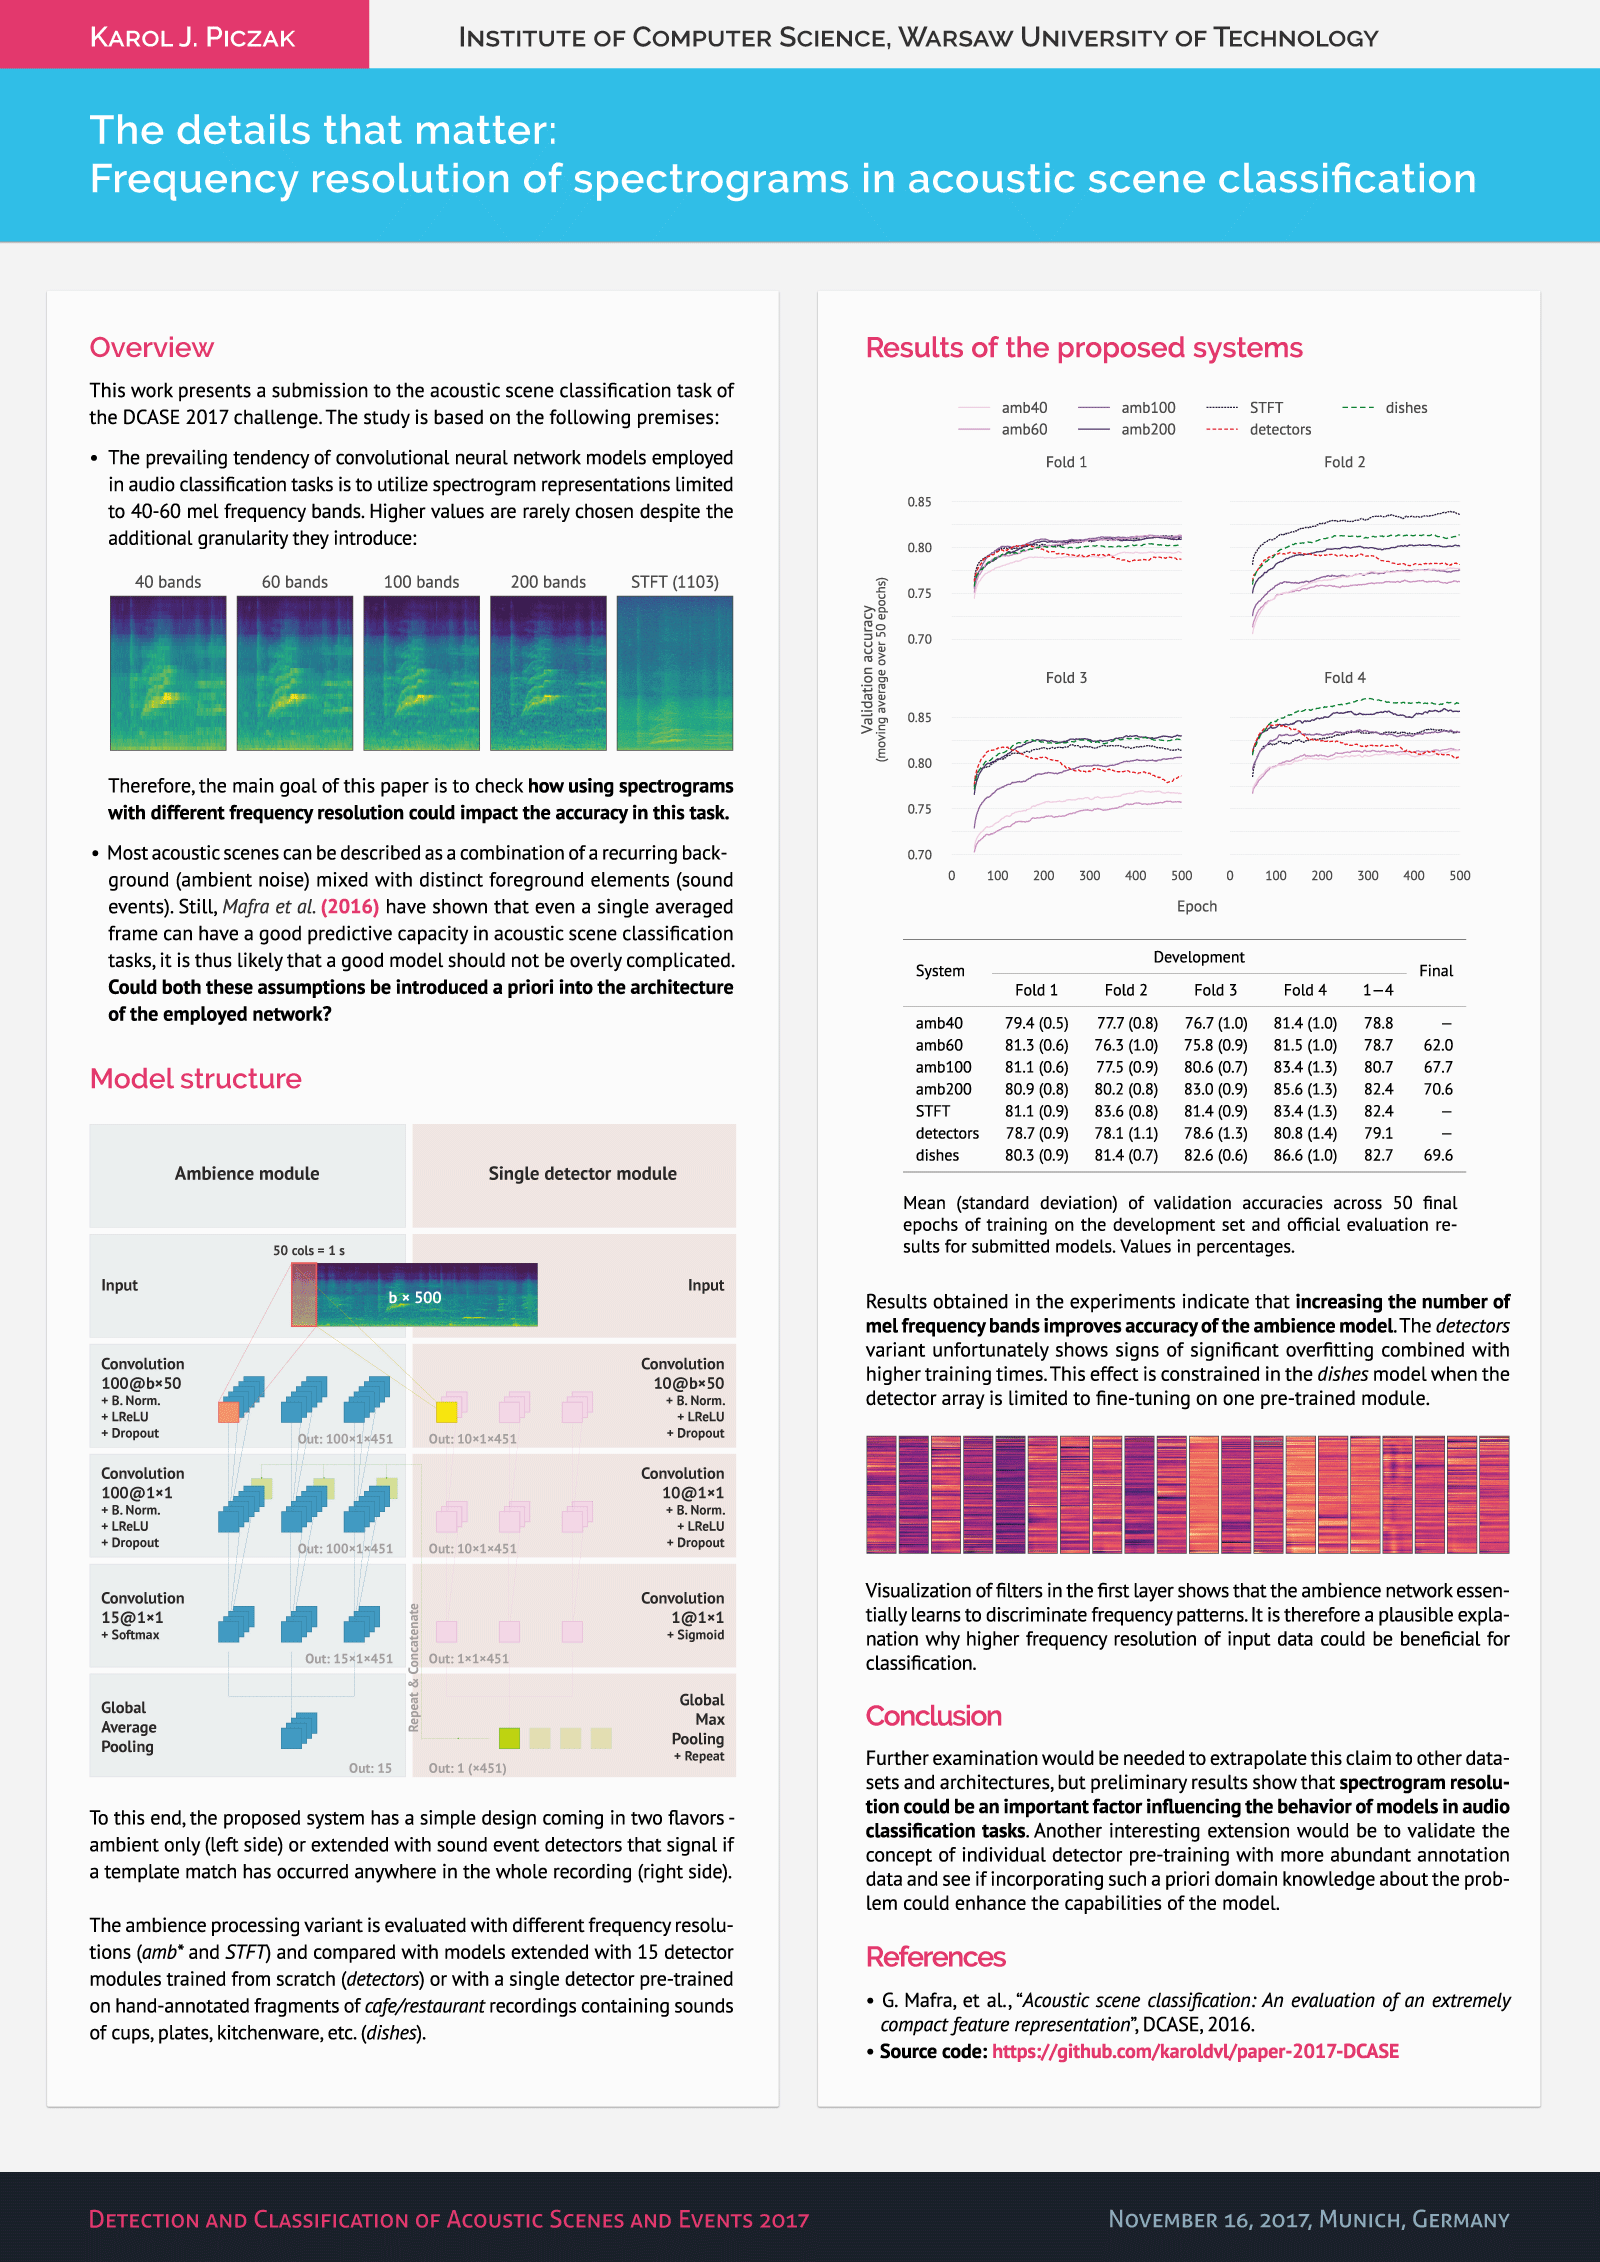
| System | Fold 1 | Fold 2 | Fold 3 | Fold 4 | 1—4 | Final (test) |
|---|---|---|---|---|---|---|
amb40 |
79.4 (0.5) | 77.7 (0.8) | 76.7 (1.0) | 81.4 (1.0) | 78.8 | — |
amb60 |
81.3 (0.6) | 76.3 (1.0) | 75.8 (0.9) | 81.5 (1.0) | 78.7 | 62.0 |
amb100 |
81.1 (0.6) | 77.5 (0.9) | 80.6 (0.7) | 83.4 (1.3) | 80.7 | 67.7 |
amb200 |
80.9 (0.8) | 80.2 (0.8) | 83.0 (0.9) | 85.6 (1.3) | 82.4 | 70.6 |
STFT |
81.1 (0.9) | 83.6 (0.8) | 81.4 (0.9) | 83.4 (1.3) | 82.4 | — |
detectors |
78.7 (0.9) | 78.1 (1.1) | 78.6 (1.3) | 80.8 (1.4) | 79.1 | — |
dishes |
80.3 (0.9) | 81.4 (0.7) | 82.6 (0.6) | 86.6 (1.0) | 82.7 | 69.6 |

Results obtained in the experiments indicate that increasing the number of mel frequency bands improves accuracy of the ambience model. The detectors variant unfortunately shows signs of significant overfitting combined with higher training times. This effect is constrained in the dishes model when the detector array is limited to fine-tuning on one pre-trained module.

Visualization of filters in the first layer shows that the ambience network essentially learns to discriminate frequency patterns. It is therefore a plausible explanation why higher frequency resolution of input data could be beneficial for classification.

Further examination would be needed to extrapolate this claim to other datasets and architectures, but preliminary results show that spectrogram resolution could be an important factor influencing the behavior of models in audio classification tasks. Another interesting extension would be to validate the concept of individual detector pre-training with more abundant annotation data and see if incorporating a priori domain knowledge about the problem could enhance the capabilities of the model.
-
LaTeX source code for the paper.
-
Actual submission package as delivered for DCASE 2017.
-
-
Source code for experiments.
Run
run_amb.pyto train the ambience model:$ python run_amb.py -h usage: run_amb.py [-h] [-D DEVICE] [-b BANDS] [--all] optional arguments: -h, --help show this help message and exit -D DEVICE, --device DEVICE Theano device used for computations -b BANDS, --bands BANDS Number of mel bands or `stft` --all Train on all folds (for final model testing)This will generate
run_{BANDS}_{FOLD}.*files in theresults/directory:run_{BANDS}_{FOLD}.h5- saved weights (highest holdout score)run_{BANDS}_{FOLD}.last.h5- saved weights (last epoch)run_{BANDS}_{FOLD}.npz- training historyrun_{BANDS}_{FOLD}.txt- generated predictions
Settings used for training models in the paper:
BANDS in [40, 60, 100, 200, 'stft']
The
--allswitch is used for training the final model (all training folds included).Issuing:
$ python run_detectors.py
will train a hybrid model (ambience module + 15 binary event detectors).
run_dishes.pyis a streamlined version with only 1 binary detector pre-trained on typicalcafe/restaurantsounds (kitchenware, cutlery, crockery etc.). Detector pre-training is done withtrain_clues.pybased onclues.txtannotations. -
Helper/backend code for generating submissions.
Adjust the
/Code/arf/core.pyfile to reflect proper paths to the datasets:DATA_PATH = '/volatile/dcase17_1/' TEST_PATH = '/volatile/dcase17_1_eval/'
-
Raw figures with code used for visualization available as a Jupyter notebook (
Figures.ipynb). -
Training outputs. The
eval.pyscript creates cross-validation accuracy metrics, list of misclassifications and a confusion matrix for a given system:$ python eval.py run_200The
_th_0.5suffixes denote models with prediction thresholding, so:$ python eval.py run_200_th_0.5will generate a corresponding confusion matrix
Code/results/run_200_th_0.5.pdf. -
A very unpolished modification of CrowdCurio's audio-annotator JavaScript interface used for creating the
dishes(clues.txt) annotation list.
-
If you find this paper useful in some way, you can cite it with the following BibTeX entry:
@inproceedings{piczak2017dcase,
    title={The details that matter: Frequency resolution of spectrograms in acoustic scene classification},
    author={Piczak, Karol J.},
    booktitle={Proceedings of the Detection and Classification of Acoustic Scenes and Events 2017 Workshop},
    year={2017},
    location={Munich, Germany}
}
K. J. Piczak. The details that matter: Frequency resolution of spectrograms in acoustic scene classification. In Proceedings of the Detection and Classification of Acoustic Scenes and Events 2017 Workshop, Munich, Germany, 2017.
Author version of this paper: The details that matter: Frequency resolution of spectrograms in acoustic scene classification.