spark_sql_tuning
notes/tools for spark sql tuning/troubleshooting
Understanding the spark explain plan and spark UI
- The doc shows four test cases (https://github.com/karlarao/spark_sql_tuning/blob/main/HOWTO-spark_explain_plan-and_spark_ui.docx)
- simple count on RDD
- Spark SQL dataframe join and sum
- Re-execution (cached result)
- Complex dataframe join and sum
- Also shows the correlation of Jobs, DAGs/Stages, Executors, Tasks and how they relate to Oracle terms
- Other SQL troubleshooting docs
- For Hive SQL troubleshooting go to https://github.com/karlarao/hive_sql_tuning
- For Oracle SQL troubleshooting go to https://karlarao.github.io/karlaraowiki/index.html#%5B%5BPlan%20Line%20ID%20%2C%20plan_line_id%5D%5D
Troubleshooting workflow
Below is the workflow to know where the time is being spent
- Jobs tab - Job ID will show the high-level Duration
- Jobs tab details - For each Job ID created -> get the breakdown of Stage IDs and check the Duration and Input, Output, Shuffle read and write
- Stages tab - Click on the worst performing Stage ID or the slow Stage IDs and check the Visual Event Timeline, Summary Metrics, and Tasks Duration (check for straggling tasks)
- On two separate tabs, correlate the Physical Plan ID and visual explain plan (SQL tab -> click on description URL -> click Details below) with the DAG details visual execution by Stage ID (Jobs tab)
- Physical Plan ID and visual explain plan – this is the query plan that shows the join order, join type used, and overall flow of row sources
- DAG details visual execution by Stage ID – this is how Spark job tasks are performed on the cluster
- On SQL tab -> Physical Plan ID and visual explain plan -> search for keywords “exchange” and “stage ”
- “exchange” – this will highlight the shuffle operations on both physical plan and visual explain plan
- “stage ” – this will allow you to map and highlight the slow DAG stage operation w/ row sources on query plan (what part of the SQL code is slow)
- It is possible that a join of two row sources will converge on a single stage ID which could be the bottleneck or slowest part of the query
Key Points
- Focus on TIME and optimize the TIME it takes for the Spark job to run
- DAG is a visual representation of a Spark job (steps performed), this needs to be correlated w/ the physical plan and visual explain plan
- Spark’s optimizer is called “Catalyst”
- Explain plan or Query plan
- Explain plan can be generated without executing the spark job
- Explain plan or query plan is only available for DataFrames/Spark SQL. DAGs show up for ANY job
- Spark UI DAG
- Need to execute the spark job, meaning you have to trigger an action .show()
- DAGs show up for ANY job
- You can watch the DAGs while running or after job completion
- Shuffle = Stage
- “Exchange” is a shuffle
- Number of shuffles = number of stages
- Click on each Stage to see the detailed tasks and plan details
- Number of tasks = number of partitions of each intermediate dataframe
General things to check on Spark code tuning:
- code logic
- join mechanics
- broadcast joins
- column pruning
- prepartitioning
- bucketing
- skewed joins
- rdd joins
- cogroup
- rdd broadcast
- rdd skews
- rdd transformations
- by key ops
- reusing objects
- transformations
General things to check on Spark configuration tuning:
- cluster hardware config and parameters
- catalyst
- tungsten
- caching
- checkpointing
- repartition coalesce
- partitioning problems
- partitioners
- data skews
- serialization problems
- kryo
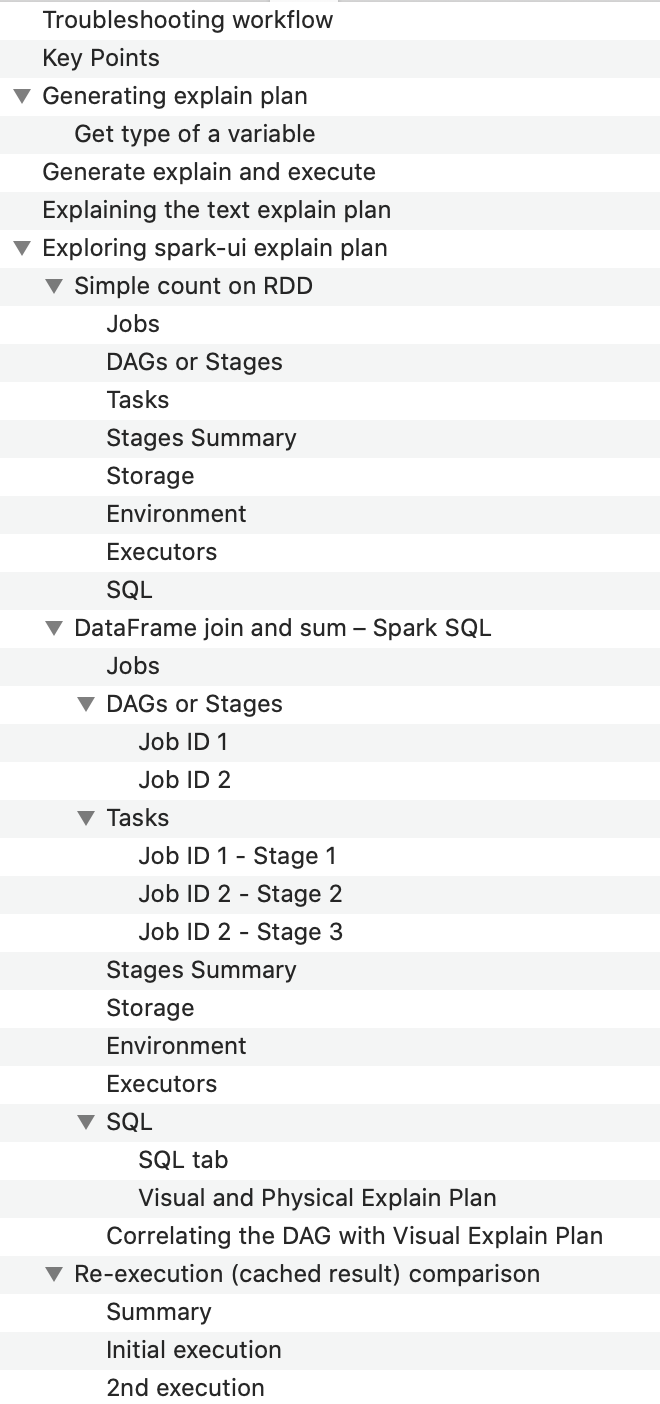
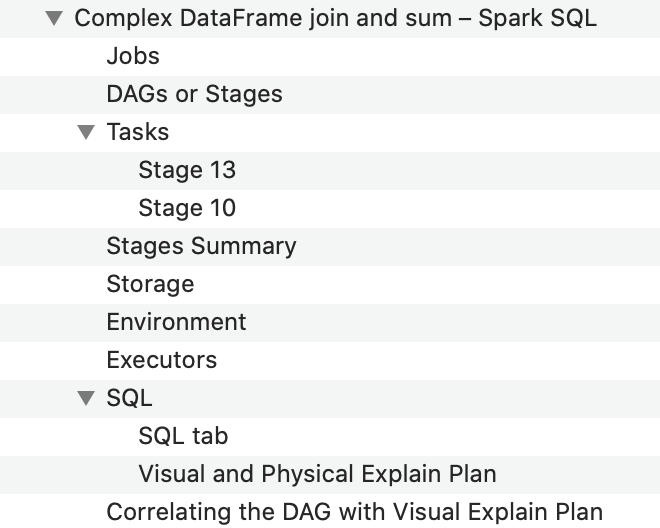
DAG correlation screenshots
example2_dataframe-join-and-sum

example4_dataframe-complex

Doc Index
Other resources
- Spark Summit talk Understanding query plans and Spark UI (Xiao Li - Databricks)
- Shows tips and tricks on where to look and click and general summary of things to do if such issues happen
- Screenshots of key slides here https://github.com/karlarao/spark_sql_tuning/blob/main/Spark3_navigating_webui_tips.md
- Apache Spark Core Deep Dive - Proper Optimization (Daniel Tomes - Databricks) https://www.youtube.com/watch?v=daXEp4HmS-E
- The speaker demonstrated a general troubleshooting workflow using the new Spark UI