Gemfire is JVM based server can be monitored in different ways. Since gemfire supports jmx can monitor gemfire server by connecting jmx port.
-
JConsole/JVisualVm
We can connect each server node separatly to monitor using jmx url -
Gemfire pulse tool
gemfire itself provide this tool to query gemfire in-memory data and also provides limited info about server -
https://github.com/tzolov/geode-dashboard (Apache Geode - Grafana Dashboard)
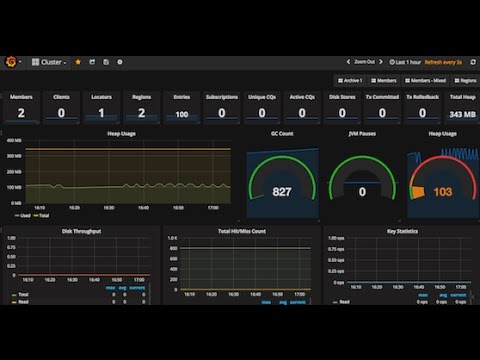
This project help us to view health status of server in a single dashboard with help of time serious influxDB and Grafna UI for cool dashboard.It is very usefull tool for monitoring all server in a aggregated view.
-
jmx-to-grafna : This project connect gemfire locator and get all gemfire server details, these details is stored into influxDB and then Grafna is connecting to this db to get data. Please refer the below document for installation.
-
statitics-to-grafna : You have to run this project to veiw realtime statitics in grafna. we have install gemfire VSD binary project inside extsing gemfire installtion path. please refer this link for more details (http://gemfire.docs.pivotal.io/gemfire/tools_modules/vsd/running_vsd.html You have to run VSD tool to write statistic data into file and we have to mention this file while this java project. this java project would read this .gsd file and store data in inflexDB and then grafana connect this db to display data in grafana.
We will see how to use Gafana dashboard for gemfire monitoring, below are the steps
As illustrated on the diagram below, the Geode Grafana toolset provides unified technical stack for visualizing
and analysing both Real-Time (e.g JMX metrics) and Historical (archive files) cluster statistics.

Utility tools for analysing and visualising Apache Geode historical and real-time
metrics with Grafana. Two sub-projects aim to provide real-time (jmx-to-grafana)
and historical (statistics-to-grafana) metrics monitoring.

Geode implements federated JMX architecture to manage and monitor all members of the distributed system.
The jmx-to-grafana spring-boot application consumes selected Geode MBean metrics and streams them
into a InfluxDB time-series database. Grafana uses the time-series to build comprehensive dashboards to monitor and
analyze the distributed system.
Geode collects detailed statistics about the distributed system. This statistics is persisted in local archive files by each cluster member. Use the statistics-to-grafana tool to convert the archive files into InfluxDB time-series database. Use Grafana to build comprehensive dashboards from the statistics time-series.

Follow below link to install InfluxDB
https://docs.influxdata.com/influxdb/v0.9/introduction/installation/
>brew update
>brew install influxdb
>brew services start influxdb
>influxd -config /usr/local/etc/influxdb.conf
 > influx

 > create database GeodeJmx

 > show databases

  name: databases

  _internal
  GeodeJmx
http://docs.grafana.org/installation/
>brew update
>brew install grafana
To have launchd start grafana now and restart at login: brew services start grafana Or, if you don't want/need a background service you can just run: grafana-server --config=/usr/local/etc/grafana/grafana.ini --homepath /usr/local/share/grafana cfg:default.paths.logs=/usr/local/var/log/grafana cfg:default.paths.data=/usr/local/var/lib/grafana cfg:default.paths.plugins=/usr/local/var/lib/grafana/plugins
>brew services start grafana
go to browser and type bleow URL after starting grafna service
credential = admin/admin
Follow this steps to configure and start jmx-to-grafna https://github.com/kaleeswaran393/gemfire-monitoring/tree/master/jmx-to-grafana
Follow this steps to configure and start statitic-to-grafna
https://github.com/kaleeswaran393/gemfire-monitoring/tree/master/statistics-to-grafana
Open MBean to manage and monitor all members of the distributed system. Single MBeanServer
aggregates
MBeans from local and remote members and provides a consolidated, single-agent view of the
distributed system. jmx-to-grafana is a generic, JMX compliant client that feeds the JMX metrics
to InfluxDB database. Grafana consumes the feeds and provides graphical dashboards for monitoring vital, real-time
health and performance of Geode clusters, members, and regions.
Internally jmx-to-grafana communicates with a Geode JMX manager to provide a complete view of
your Geode deployment.
The Geode JMX Grafana Video illustrates the approach. It shows how to
deploy and start the jmx-to-grafana
and how to build Grafana dashboards using the geode jmx feed.
Leverage Grafana (metric & analytic dashboards tool) for querying, visualizing and analysing
Apache Geode & Gemfire Statistics Archives.
Geode can collect statistics about the distributed system and persist it in archive files. The statistics-to-grafana
tool loads later into a Grafana supported time-series database such as InfluxDB. Then one can
build comprehensive Grafana dashboards to visualize and analyse the statistics data.
Repository of pre-build Grafana dashboards that can be used as templates to create customized dashboards.
There are Cluster, Members and Regions views on the Geode distributed system.