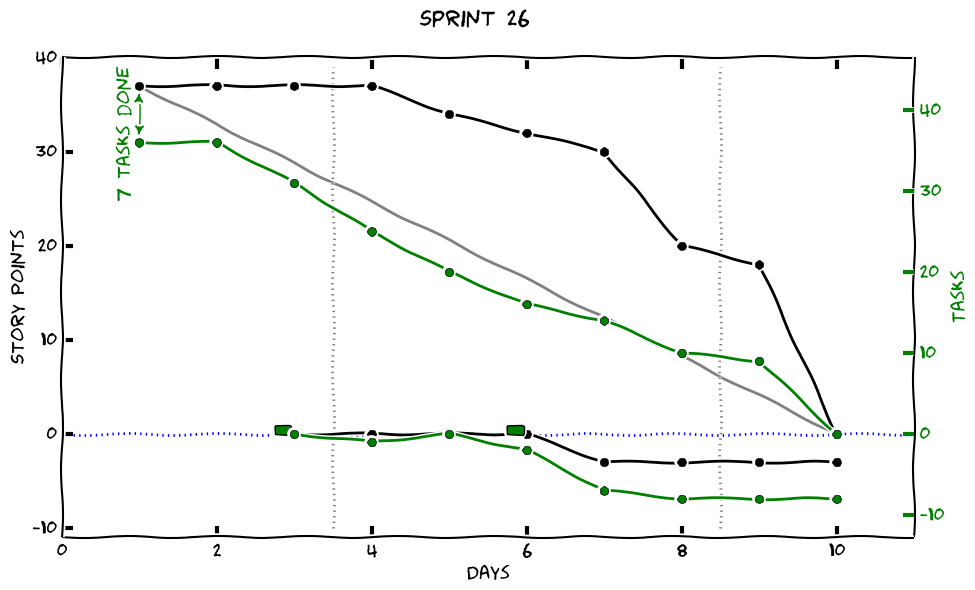
Command line tool to extract data from Trello, in particular for creating burndown charts.
A detailed description of the functionality of the tool can be found in the man page.
For expectations how the board has to be structured to make the burndown chart functions work see the Trollolo man page. There is an example Trello board which demonstrates the expected structure.
You can install Trollolo as gem with gem install trollolo.
For the chart generation you will need a working matplotlib installation and the python module to read YAML. On openSUSE you can get that with
zypper install python-matplotlib python-matplotlib-tk python-PyYAML
Trollolo reads a configuration file .trollolorc in the home directory of the
user running the command line tool. It reads the data required to authenticate
with the Trello server from it. It's two values (the example shows random data):
developer_public_key: 87349873487ef8732487234
member_token: 87345897238957a29835789b2374580927f3589072398579820345
These values have to be set with the personal access data for the Trello API and the id of the board, which is processed.
For creating a developer key go to the Developer API Keys page on Trello. It's the key in the first box.
For creating a member token go follow the instructions in the Trello API documentation.
The board id is the cryptic string in the URL of your board.
Trollolo implements a simple work flow for creating burndown charts from the data on a Trello board. It fetches the data from Trello, stores and processes it locally, and generates charts which can then be uploaded as graphics to Trello again.
At the moment it only needs read-only access to the Trello board from which it reads the data. In the future it would be great, if it could also write back the generated data and results to make it even more automatic.
The work flow goes as follows:
Create an initial working directory for the burndown chart generation:
trollolo burndown-init --board-id=MYBOARDID --output=WORKING_DIR
This will create a directory WORKING_DIR and put an initial data file there,
which contains the meta data. The file is called burndown-data-1.yaml. You
might want to keep this file in a git repository for safe storage and history.
After each daily go to the working directory and call:
trollolo burndown
This will get the current data from the Trello board and update the data file with the data from the current day. If there already was some data in the file for the same day it will be overridden.
When the sprint is over and you want to start with the next sprint, go to the working directory and call:
trollolo burndown --new-sprint
This will create a new data file for the next sprint number and populate it
with initial data taken from the Trello board. You are ready to go for the
sprint now and can continue with calling trollolo burndown after each daily.
To generate the actual burndown chart, go to the working directory and call:
trollolo plot SPRINT_NUMBER
or fetch and plot data in one step with:
trollolo burndown --plot
This will take the data from the file burndown-data-SPRINT_NUMBER.yaml and
create a nice chart from it. It will show the chart and also create a file
burndown-SPRINT_NUMBER.png you can upload as cover graphics to a card on your
Trello board.
Some more info can be found in the command line help with trollolo help and
trollolo help burndown.
