While Splunk can listen for syslog data directly, for large implementation is it recommended to stand up dedicated collection infrastructure with a Universal forwarder for data forwarding to the indexer tier.
This app provides monitoring dashboards and sample configuration for two popular collection mechanisms based on:
This project is hosted on GitHub, see https://github.com/hire-vladimir/SA-syslog_collection
App needs to be present on search heads and indexers (defines indexes.conf and index time operations). In future releases, will be split to SA and TA.
Did you know: Splunk allows you to install .zip based apps via the UI, meaning, you are able to install master.zip generated by GitHub.
When deploying dedicated syslog infrastructure, general workflow occurs as follows:
- syslog daemon listens for TCP or UDP syslog traffic, writes categorized information to a file
- Splunk Universal Forwarder monitors said file, sends data to the indexer tier
Optionally, for high availability (HA) and robustness purposes, it is recommended to place a load balancer in front of syslog listeners with n+1 configuration, such that if one listener goes down, little to no data is lost. Secondary benefit of this is scalability and growth purposes, no need to manually load balance the configured devices to specific nodes.
The app was tested on Splunk 6.x+ and 7.x+ on CentOS Linux 7.1. rsyslog and syslog-ng are supported on linux based operating systems.
- Read the documentation provided with the app, install app
- Make a decision on syslog daemon that will be used in your environment, read product specific deployment and configuration instructions:
- Configure Universal forwarders on the dedicated syslog machines to read output files. See Universal forwarder configuration for additional insights
- Use the app to view environment metrics
There are few nice to have settings that can be made on the UF's to get additional metrics and data points
inputs.confshould be structures per example below, the classification work done at the syslog level really makes things simple!
# Cisco SourceFire data
[monitor:///var/log/remote/sourcefire/*/*.log]
host_segment = 5
sourcetype = cisco:sourcefire:defencecenter:syslog
index = sourcefire
#ignoreOlderThan = 7d
disabled = true
#
# specialPort data
[monitor:///var/log/remote/specialPort/*/*.log]
host_segment = 5
sourcetype = specialPort:syslog
index = my_special_index
#ignoreOlderThan = 7d
disabled = true
#
# place "unclassified" / "catch-all" syslog into a special temp index
[monitor:///var/log/remote/unclassified/*/*.log]
host_segment = 5
sourcetype = syslog
index = syslog_unclassified
disabled = true
- Ensure UF
outputs.confhas forceTimebasedAutoLB set to true, this will ensure data will evenly distribute across all available indexers and does not stick to any particular one. For high syslog throughput scenarios, it is often necessary to also adjust autoLBFrequency to a lower value to ensure more frequent indexer switch; additionally, it might be necessary to adjust parallelIngestionPipelines inserver.confto improve data distribution on indexers.
For deployments utilizing Splunk 6.6 and above, consider use of autoLBVolume setting.
[tcpout]
forceTimebasedAutoLB = true
autoLBFrequency = 10
- Ensure UF
limits.confis not being throttled to ensure minimal latency
[thruput]
maxKBps = 0
- Update _introspection of cpu/memory metrics more frequently then the default of 10 minutes, in
/opt/splunkforwarder/etc/apps/introspection_generator_addon/localset
[introspection:generator:resource_usage]
collectionPeriodInSecs = 60
- Have UF create metadata field
splunk_syslog_server, this is extremely helpful in order to determine if syslog is evenly distributed across nodes. In/opt/splunkforwarder/etc/system/local/inputs.confadd following section, substituting<HOSTNAME>with the instance name. Note: when setting values at default stanza, this setting will be applied to ANY input, meaning, if UF is not dedicated to syslog, consider substituting to specific inputs.
[default]
_meta = splunk_syslog_server::<HOSTNAME>
To make this field indexed for further reporting, on the indexers add /opt/splunk/etc/system/local/fields.conf
[splunk_syslog_server]
INDEXED = true
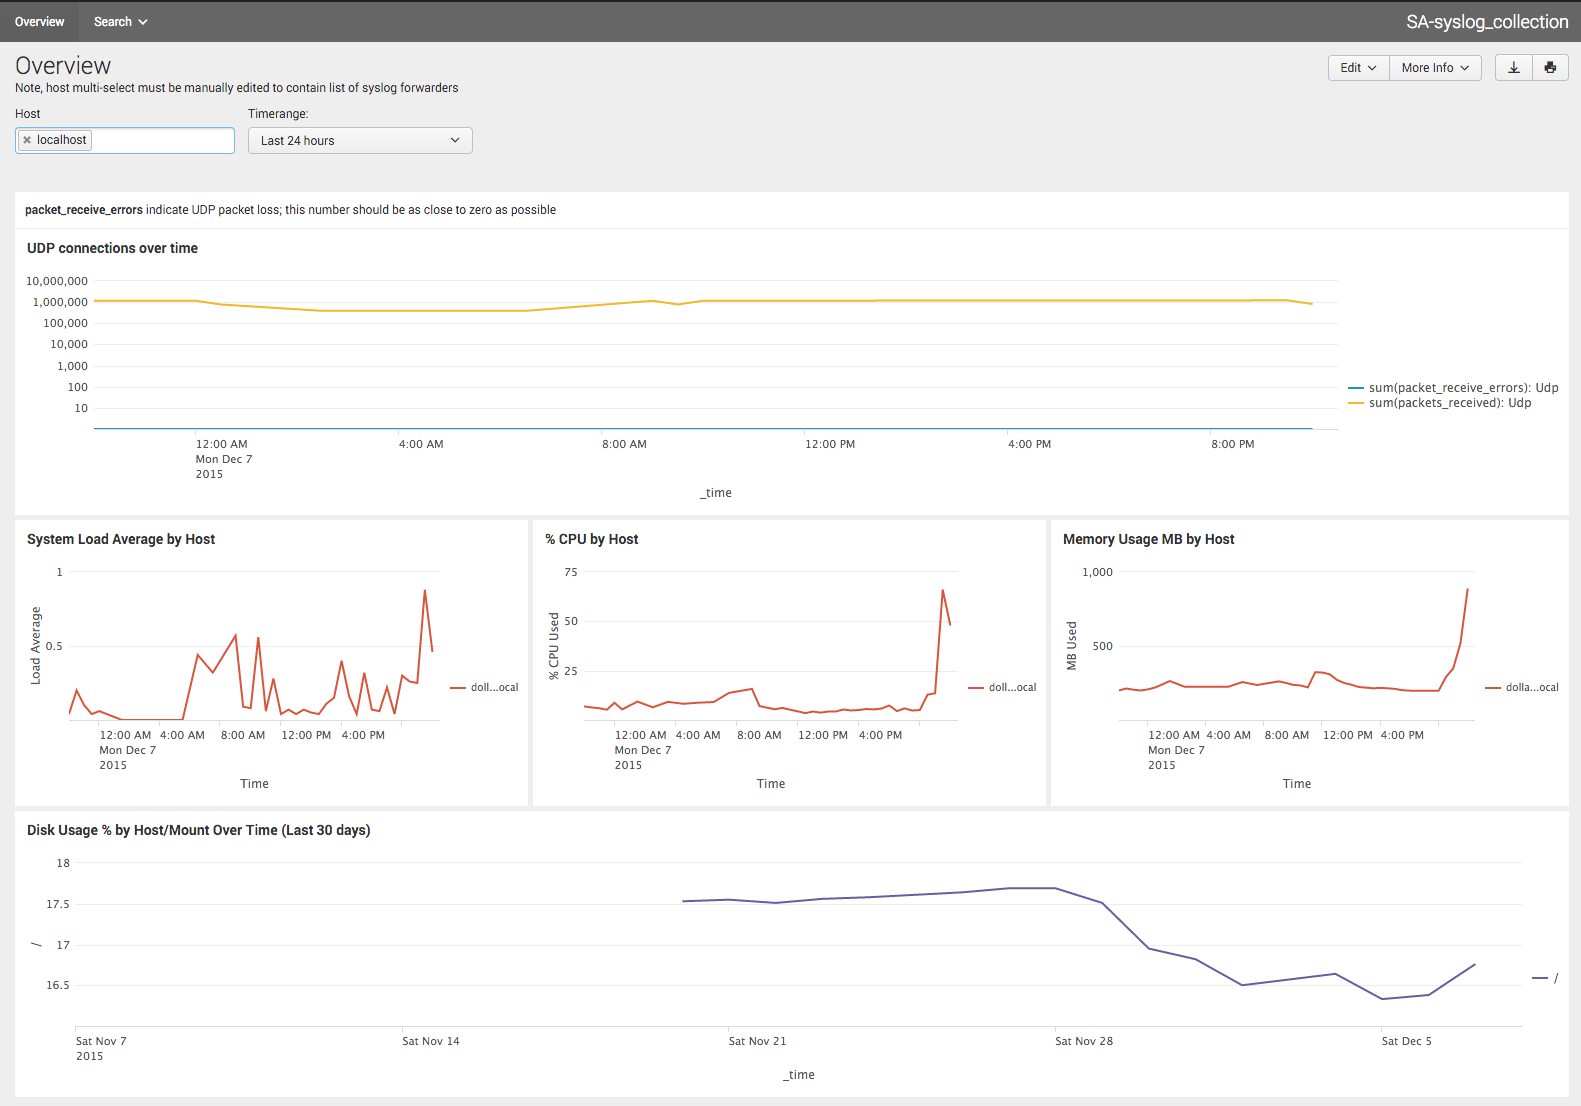
App collects output of netstat -stu every 60 seconds to monitor packet loss and errors. Future plan includes gathering of syslog specific metrics, such as impstats
Syslog will keep writing files until disk space is exhausted. To deal with this, purge job needs to be configured. One way to perform this task is to setup a cron job, such as the one listed below. It will run daily at 1AM, look for files ending in .log within /var/log/remote directory that are older then 7 days and purge them. Alternatively, logrotate or a custom script can be used for additional flexibility, particularly if extra logging around the purge process is needed.
0 1 * * * /usr/bin/find /var/log/remote -name '*.log' -mtime +7 -exec rm -f {} \;
When running into issues, consider the following:
- When syslog daemon is not functioning as expected, or no data is collected, check
/var/log/messagesfor clues- Temporarily start syslog-ng in debug mode
syslog-ng -Fevd - Temporarily start rsyslog in debug mode
rsyslogd -n
- Temporarily start syslog-ng in debug mode
- Ensure local firewall has appropriate rules in place or stopped
- Ensure appropriate ports are open and listening, try
netstat -an | grep 514, or substituting ports as needed - Ensure selinux is tuned or disabled, do you see denies in
cat /var/log/audit/audit.log | grep syslog | grep denied- Particularly prevalent when listening to ports outside of 514 or writing log data outside of /var/log/
- To see current state, run
sestatus | grep Currentenforcing indicates selinux is enabled
- To validate data is streaming in, or specific format is used, try
tcpdump -Ani any "port 514 and host 10.200.1.1"
- rsyslog is a registered trademark of RSYSLOG
- syslog-ng is a registered trademark of BalaBit IT Security
- Splunk is a registered trademark of Splunk, Inc.