Working well Anaconda 5.1 Python 3.6 version.
example.py:
from pso import pso
from input_output import read_people_from_file
import time
from targetfunc import Target
import graphics
if __name__ == "__main__":
people = read_people_from_file("kolka_i_kwadraty", 50, 50)
my_func = Target(people)
start_time2137 = time.time()
out = pso(my_func, 0, 476, 200, 1, 1, 1, 1000)
print("Calosc wykonywala sie: ", time.time() - start_time2137)
iterated, best_bitmap, target_f = zip(*out)
heatmap = my_func.get_result_area(best_bitmap[-1])
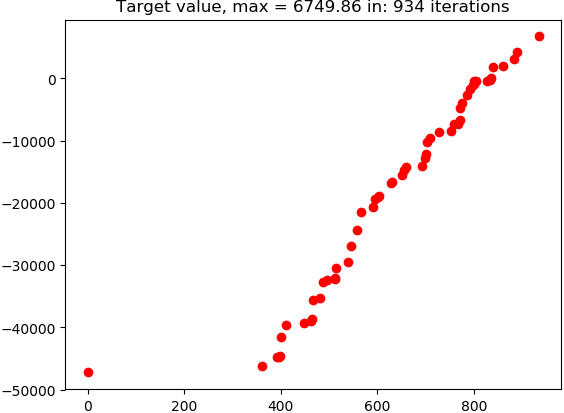
graphics.show_and_save_target_function(iterated, target_f)
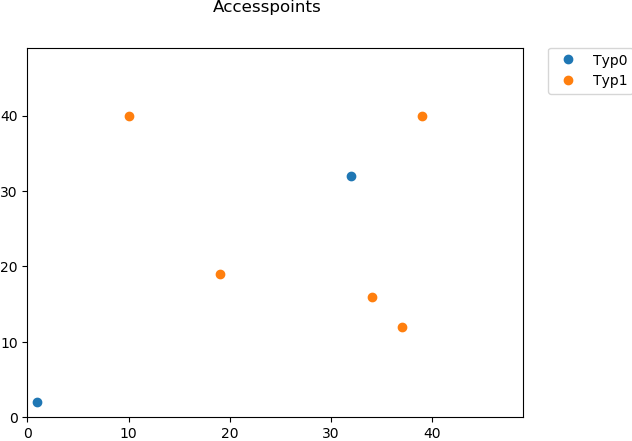
graphics.show_and_save_accesspoints(best_bitmap[-1])
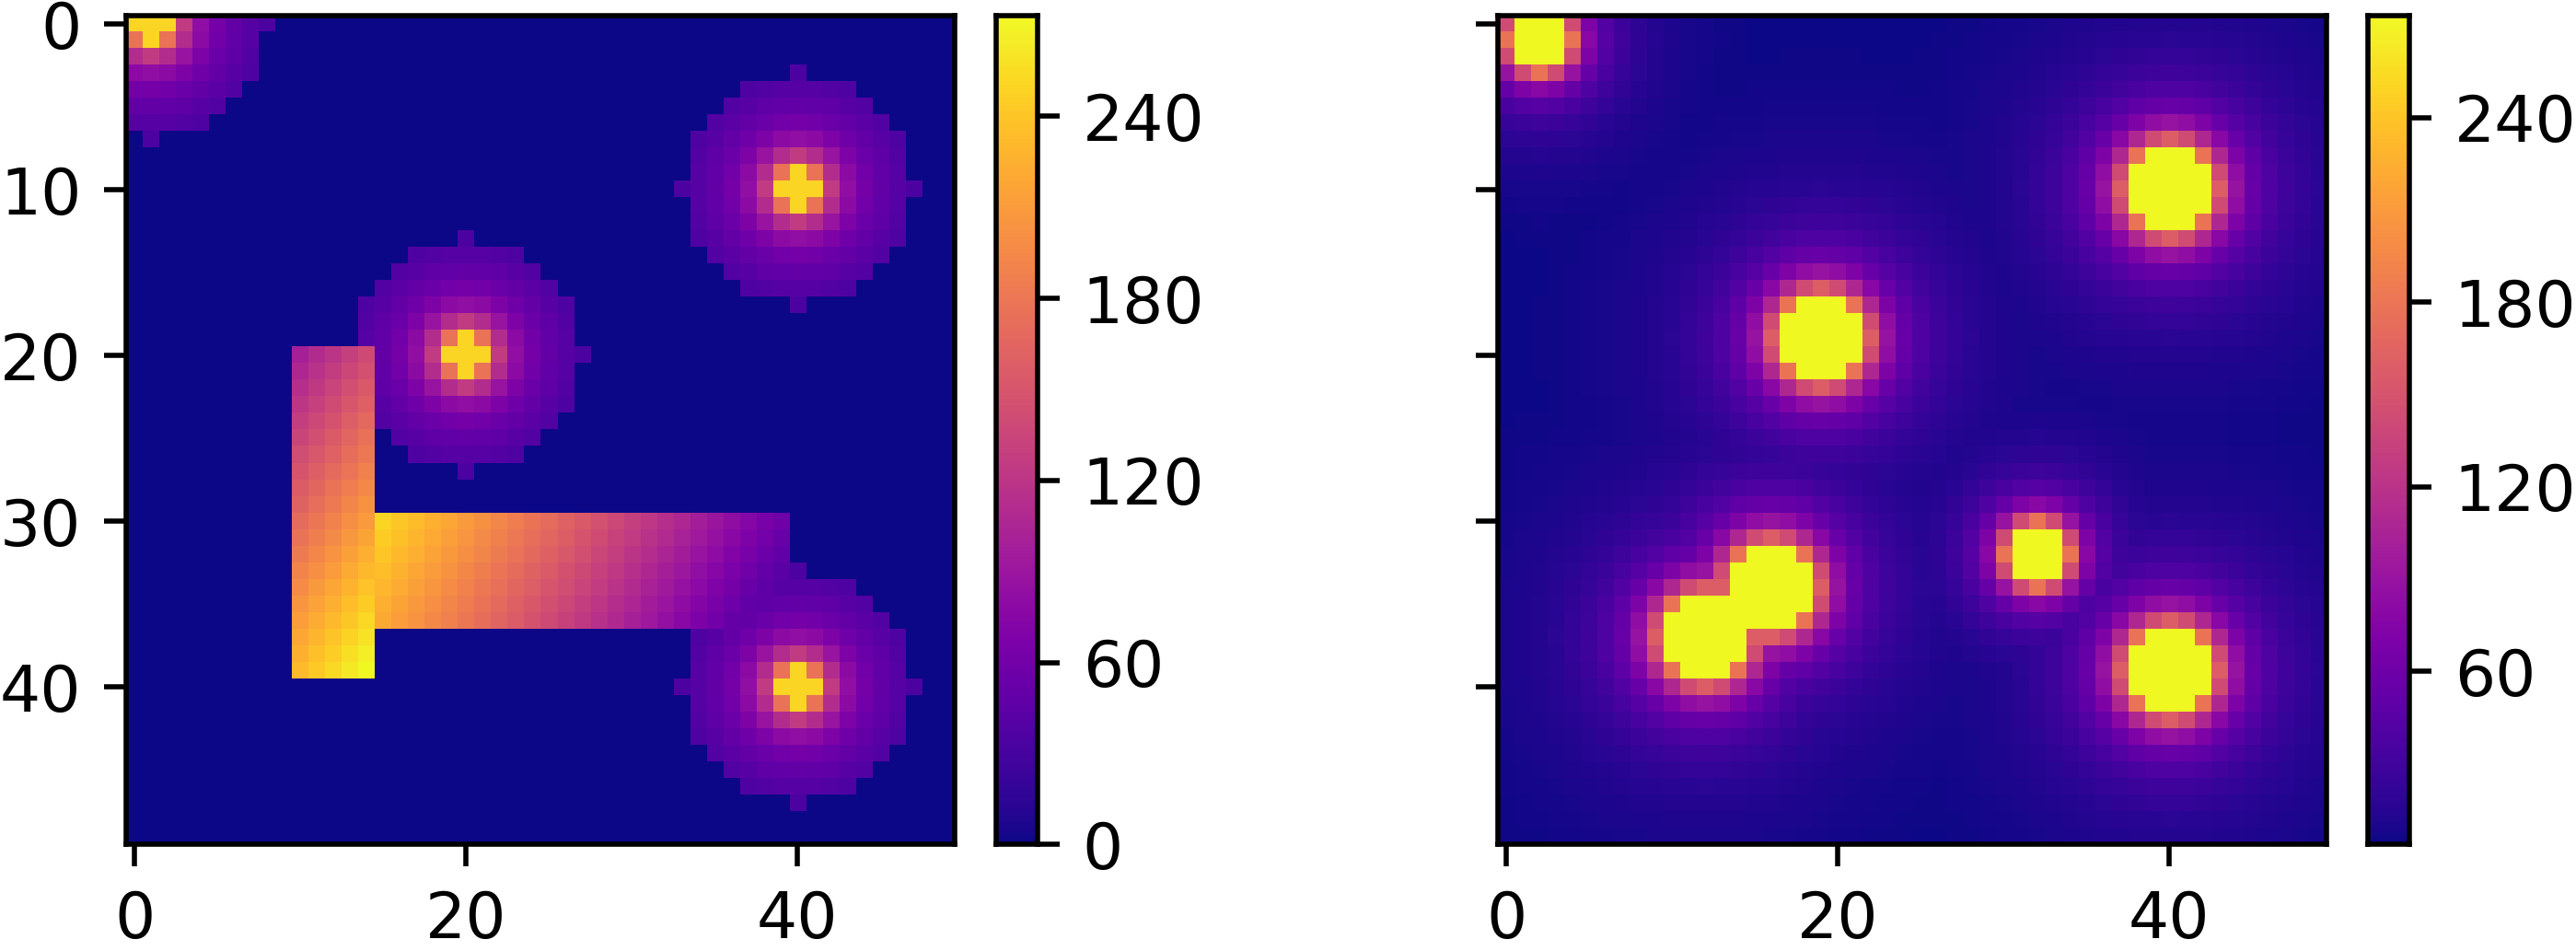
graphics.show_and_save_power(people, heatmap)This short script:
- Read people positions and requirements from file (size of matrix 50x50).
- Create target function for loaded people matrix and default parameters (my_func).
- Run pso function for my_func as target function, minimum number of accesspoints 0, maximum number of accesspoints 476, 200 particles, default coefficients and 1000 iterations.
- Draw value of target function in every iteratrion.
- Show location of each type of accesspoint
- Show comprasion of power demand and real power