Note: Readme files indicataing the data source and codes used are in the same folder as each image (click on each image to go to the folder)


Plot descriptions
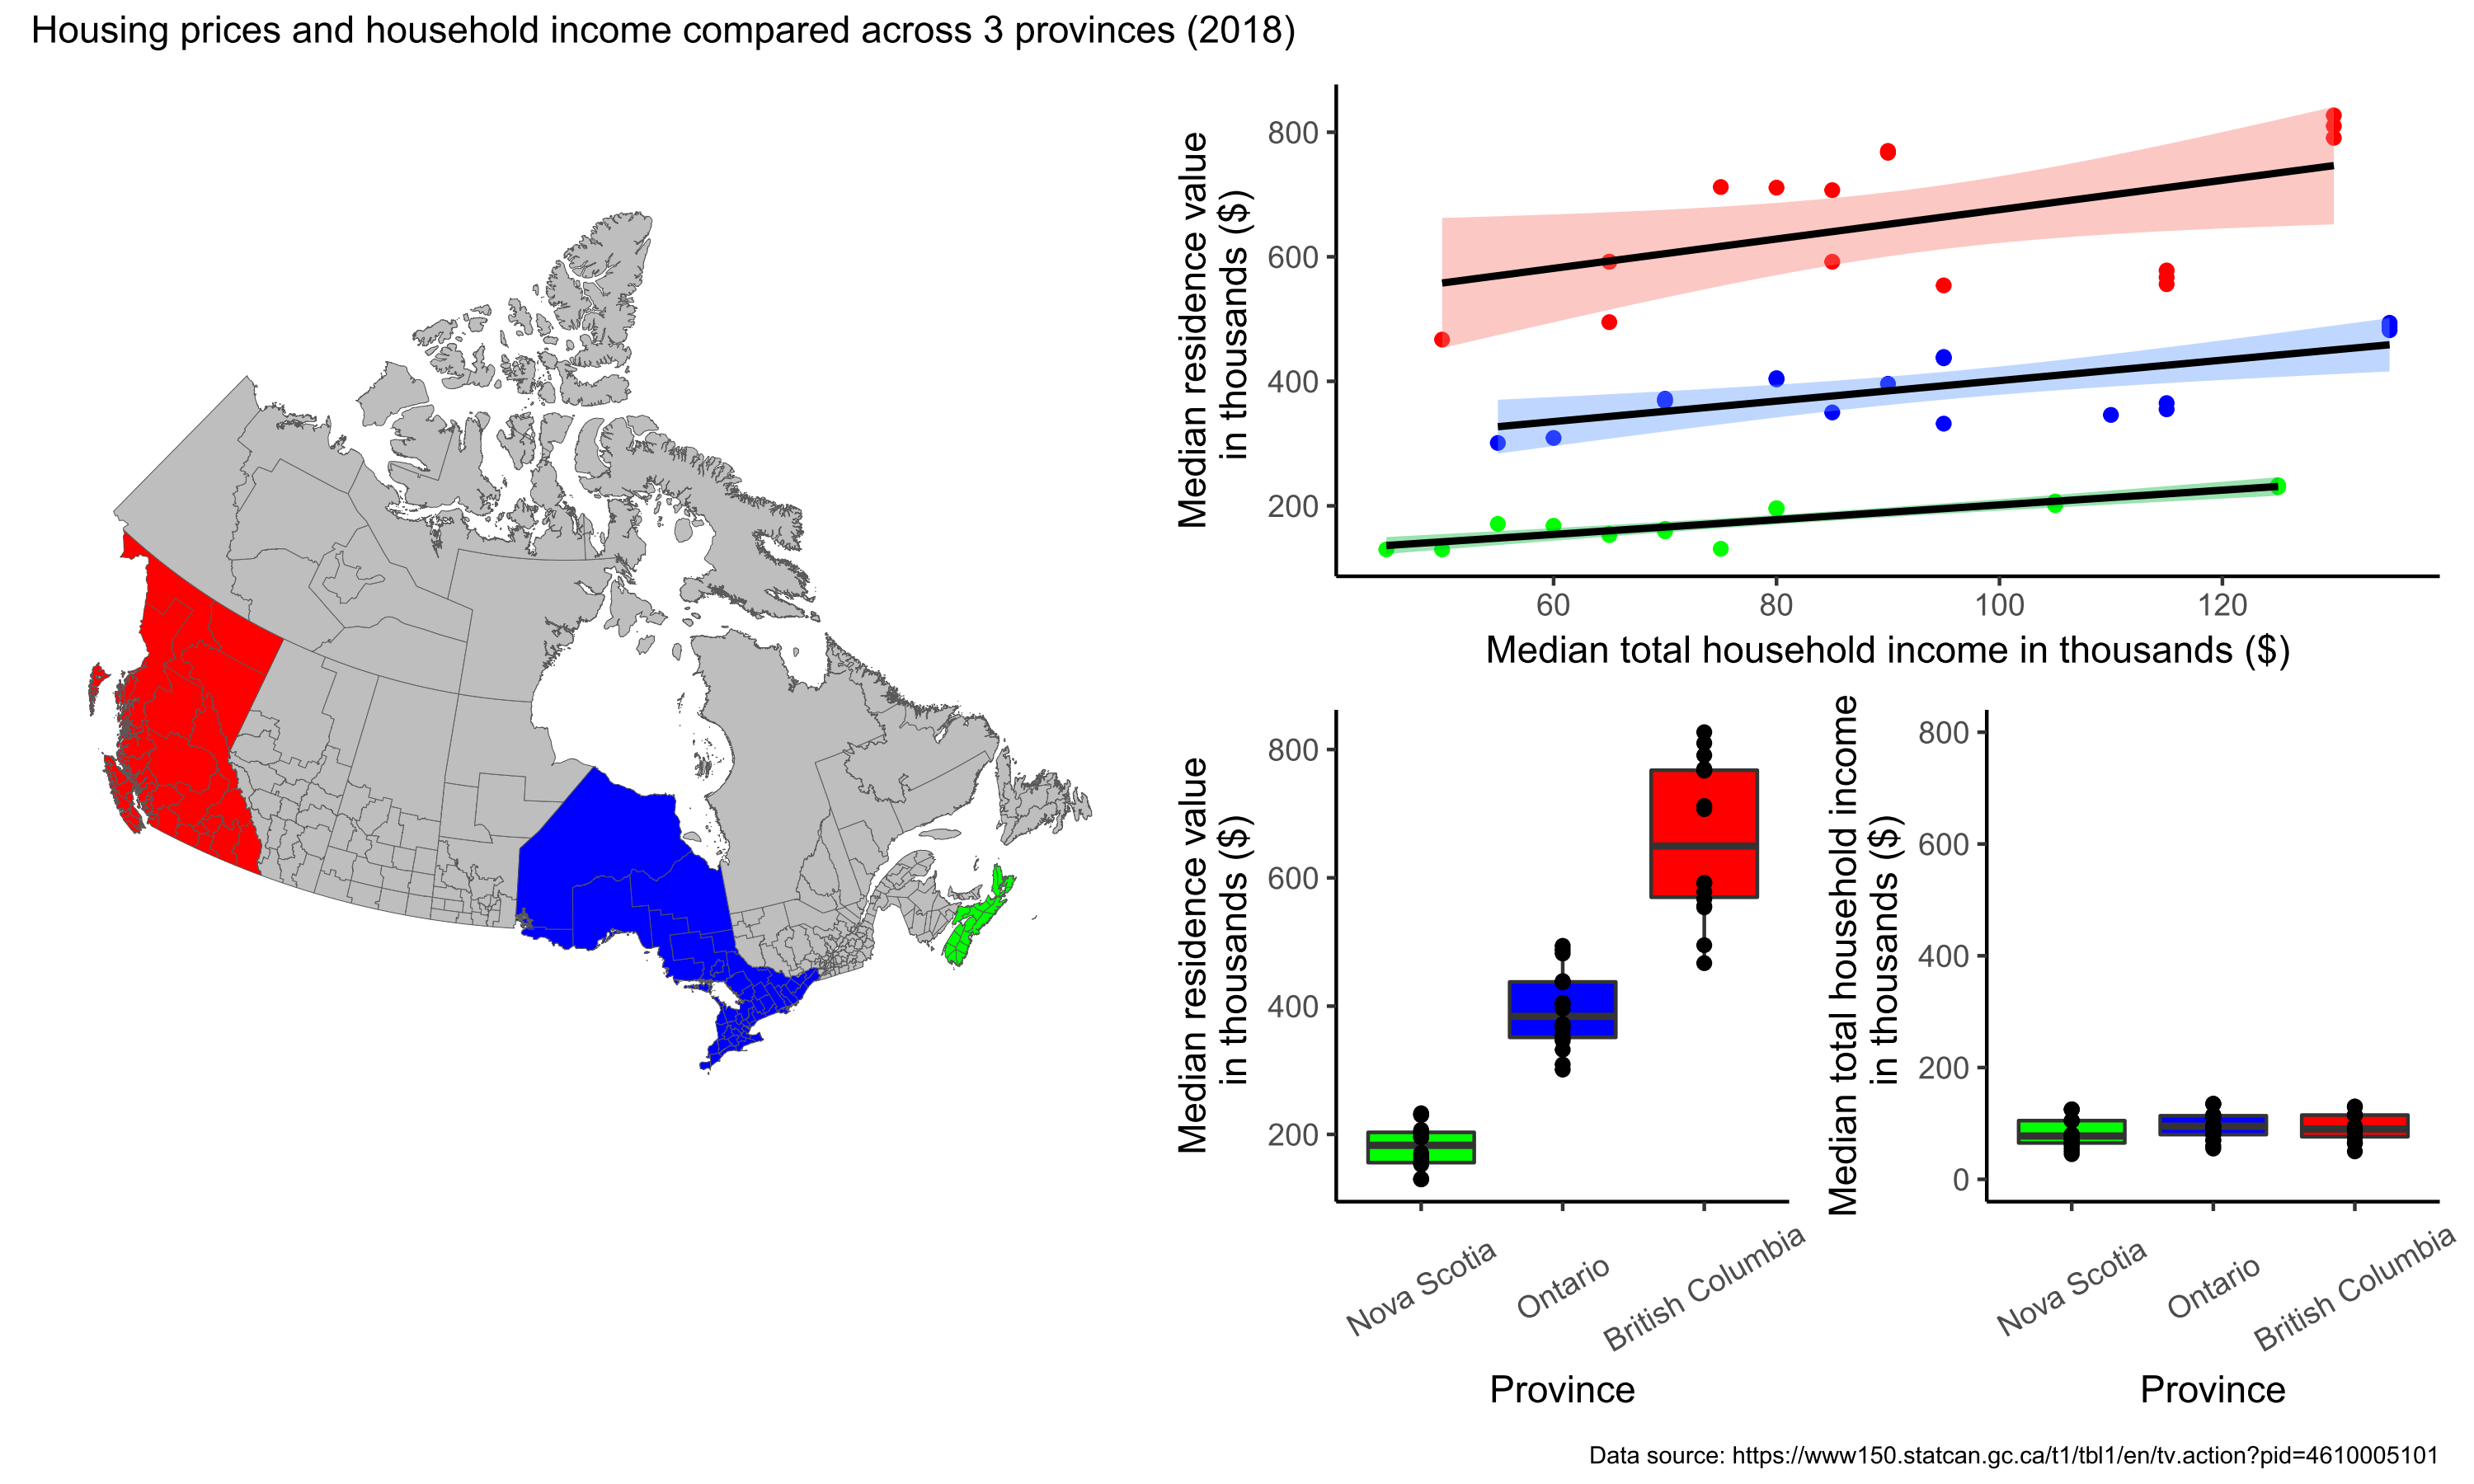
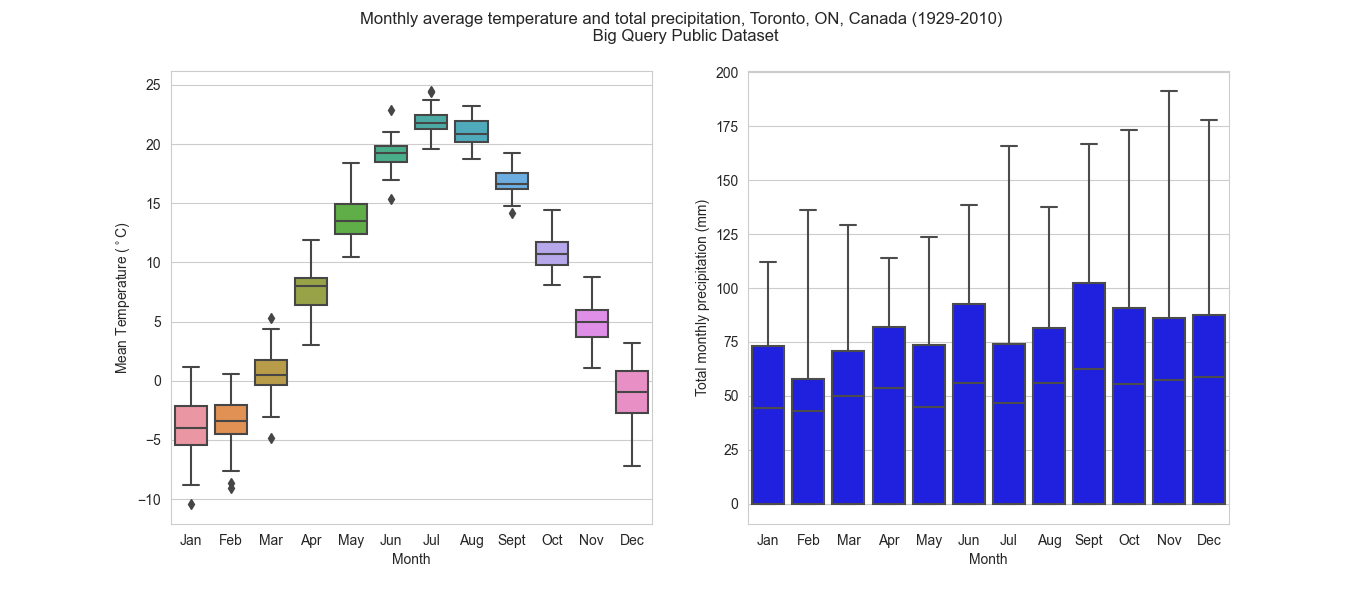
1. Housing prices and household income compared across three Canadian provinces (2018) (R)2. SQL query of weather data from BigQuery using Python, Seaborn library
3. 3D data visualization using 'rgl' package in R
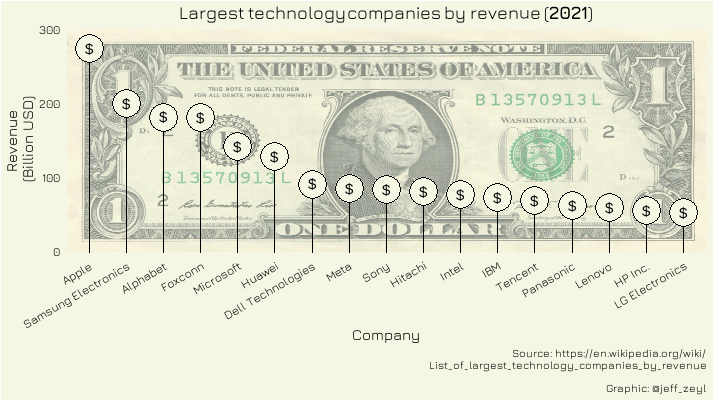
4. Revenue of largest tech companies, 2021 (R)
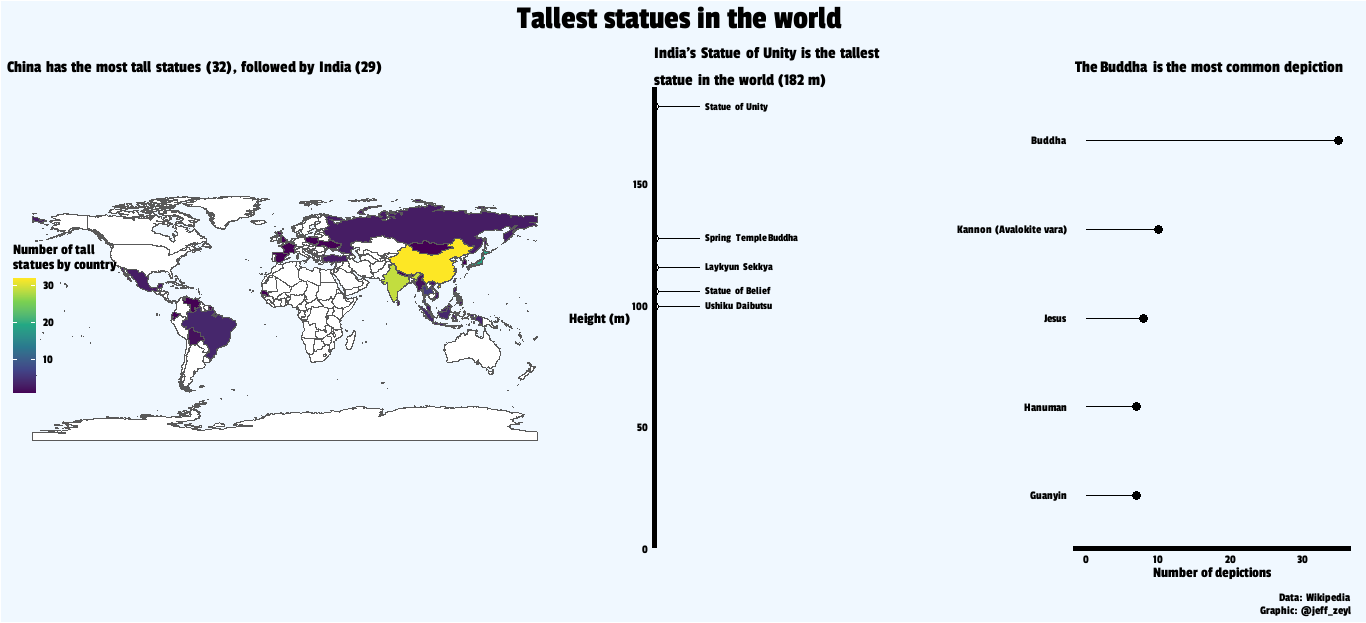
5. Tallest buildings in the world (R). Data scraped from Wikipedia
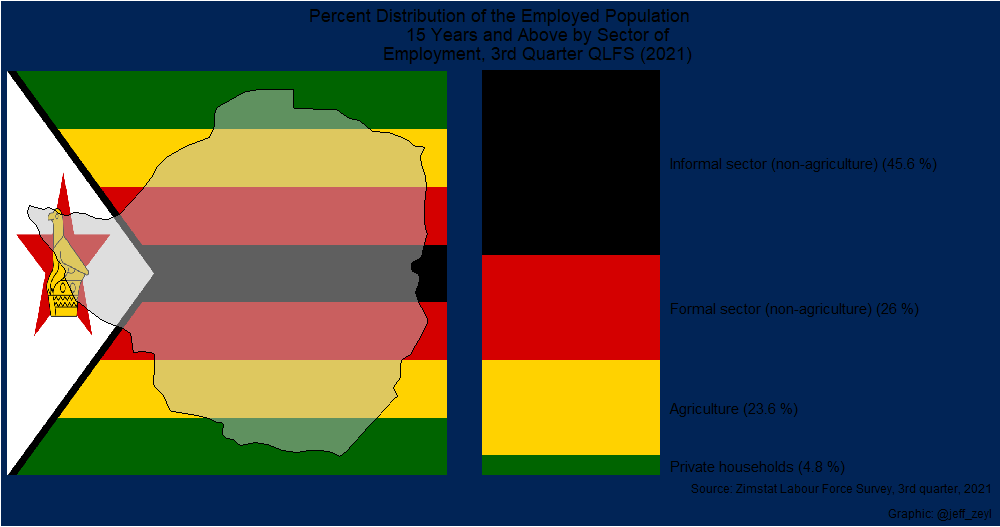
6. Zimbabwe labour report Q3, 2021 (R)
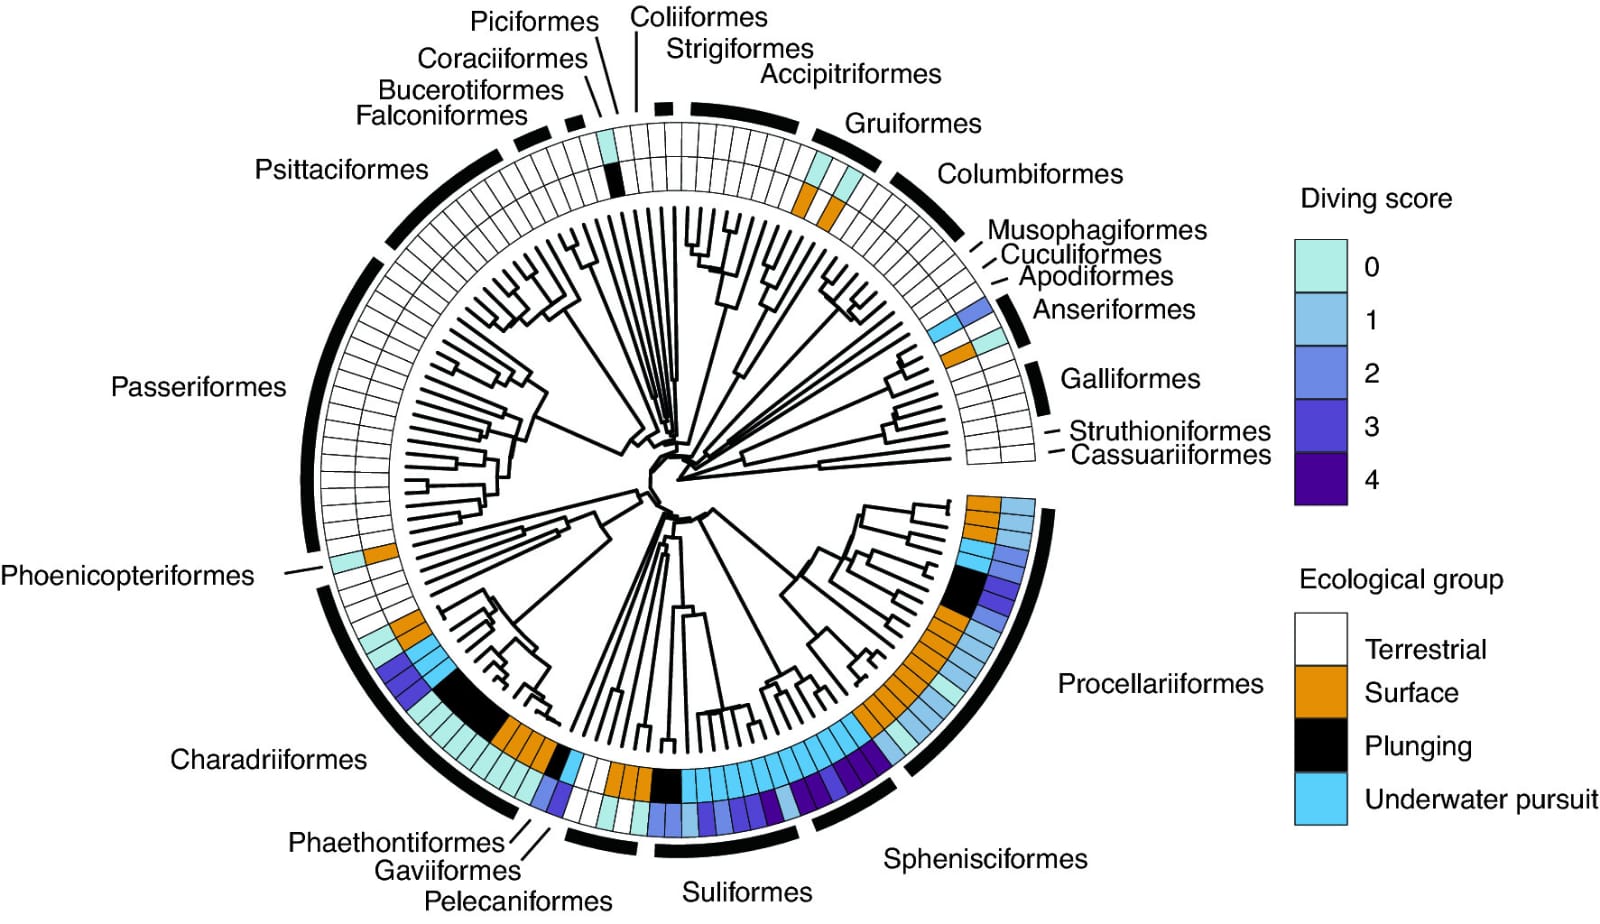
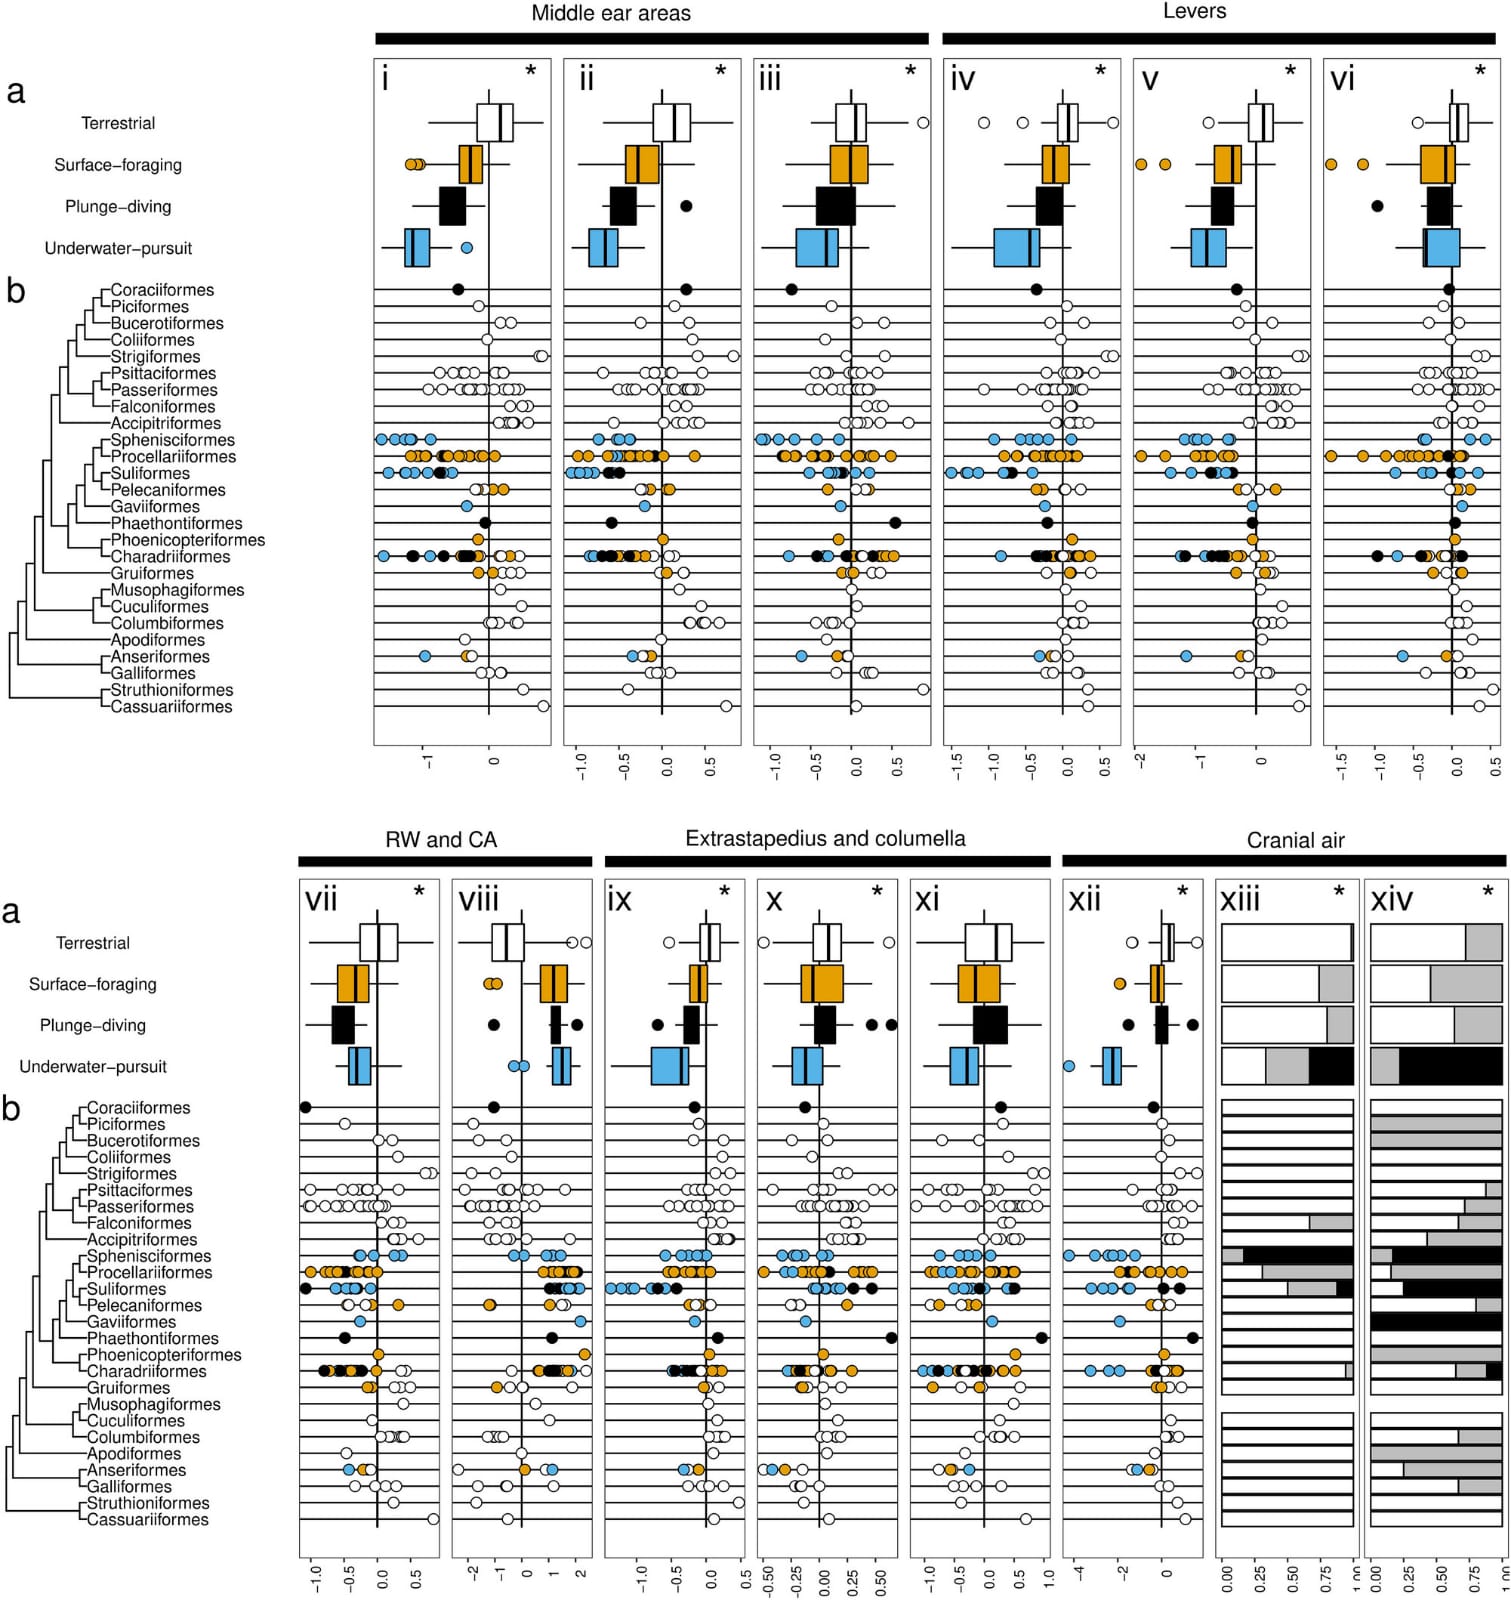
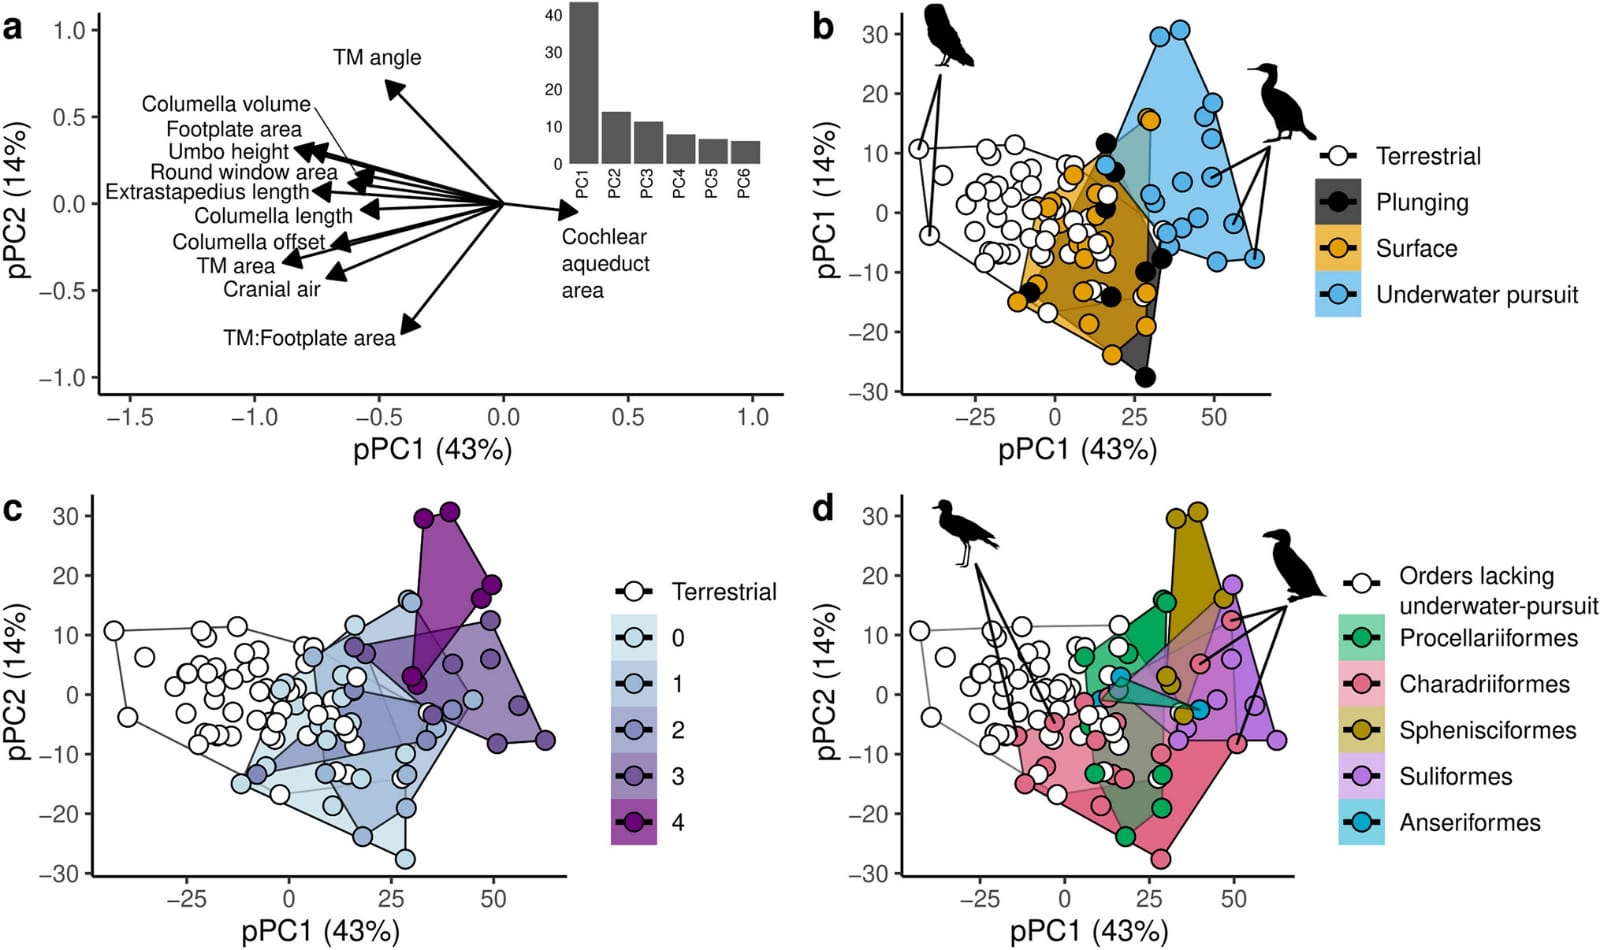
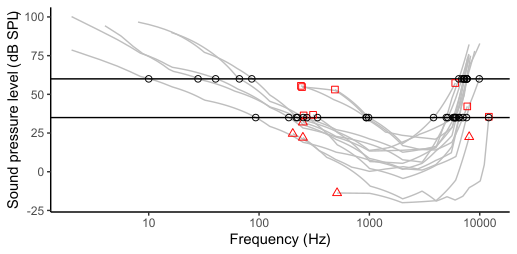
7. Figure from scientific paper on bird ear anatomy
8. Figure from scientific paper on bird ear anatomy
9. Figure from scientific paper on bird ear anatomy
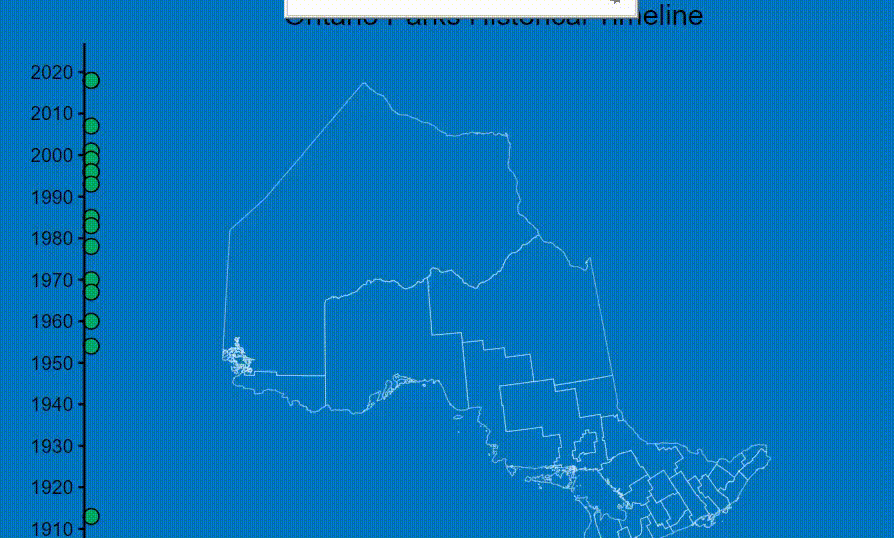
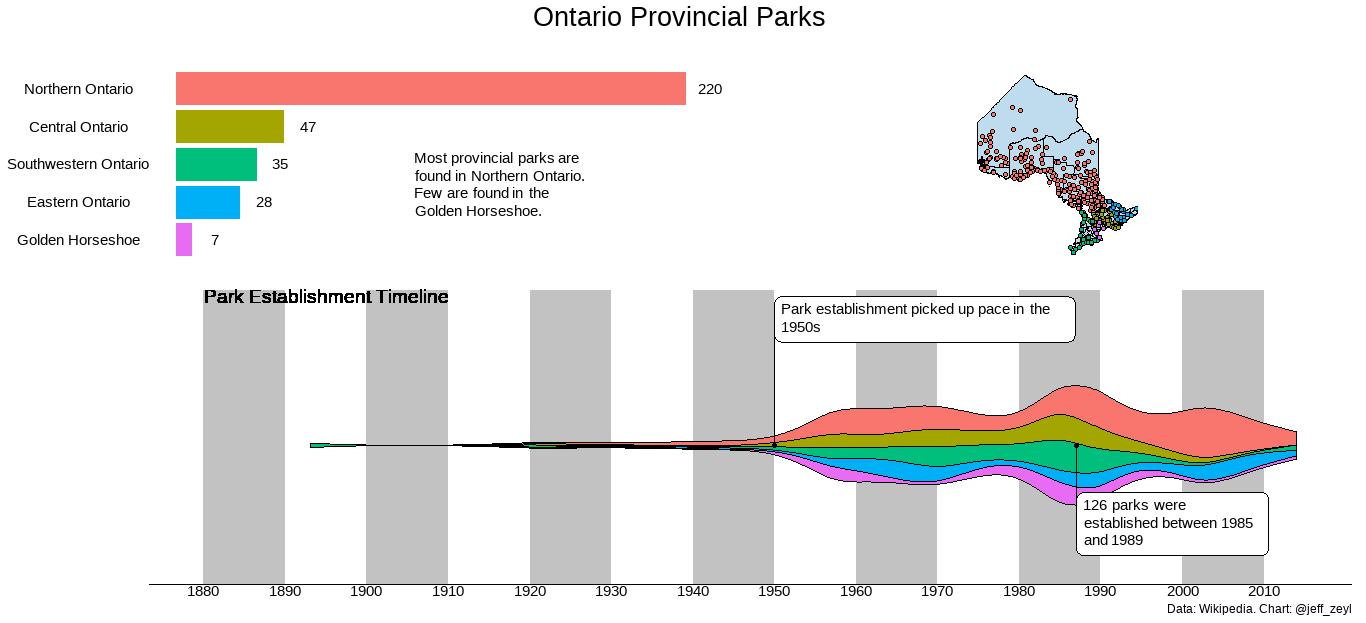
10. Ontario Parks visualization scraped from wikipedia (R)
-
R Shiny Apps.
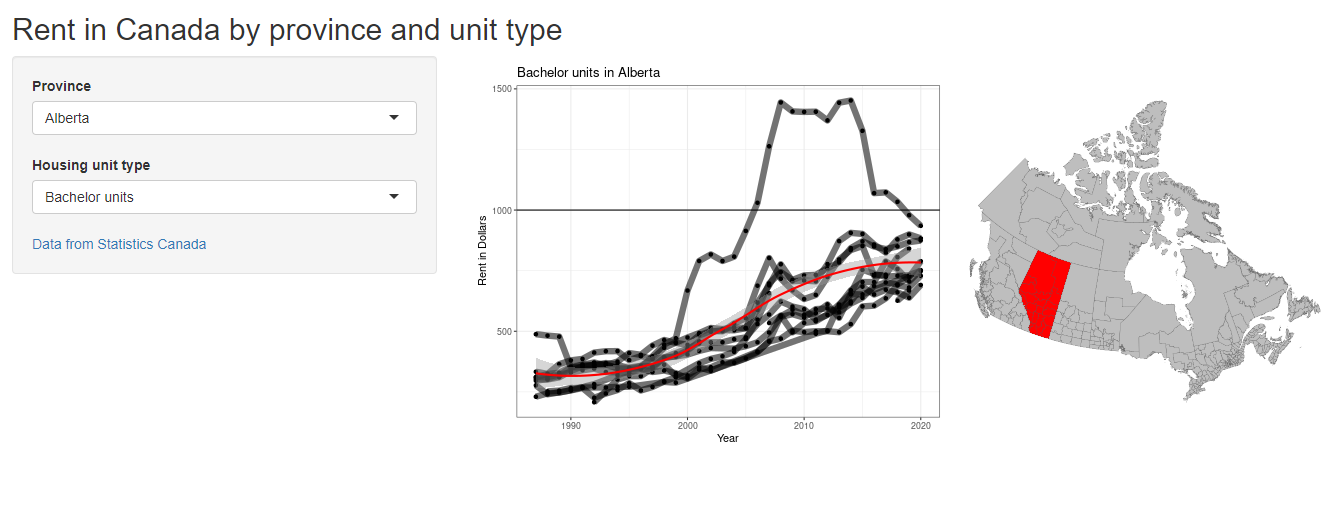
- This app lets the user select the Canadian province and the housing type, producing a chart of price versus year for each included city, highlighted on the map of Canada. Data from Stats Canada.
-
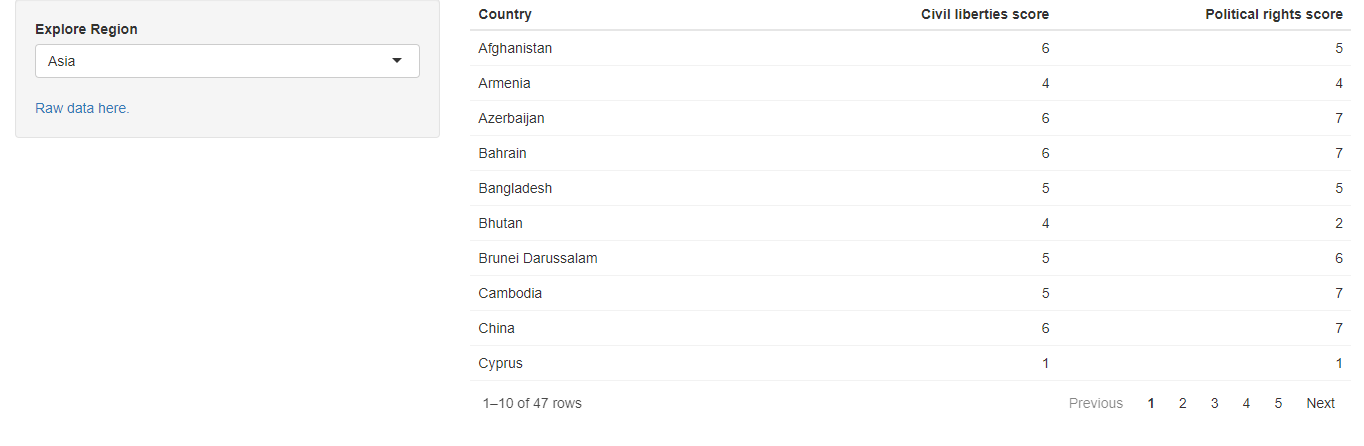
- This app presents civil liberty and political rights across the world, grouped by country and geographic regsion. It has reactive (sortable) tables of for 2020, by country. Data from #tidytuesday data
-
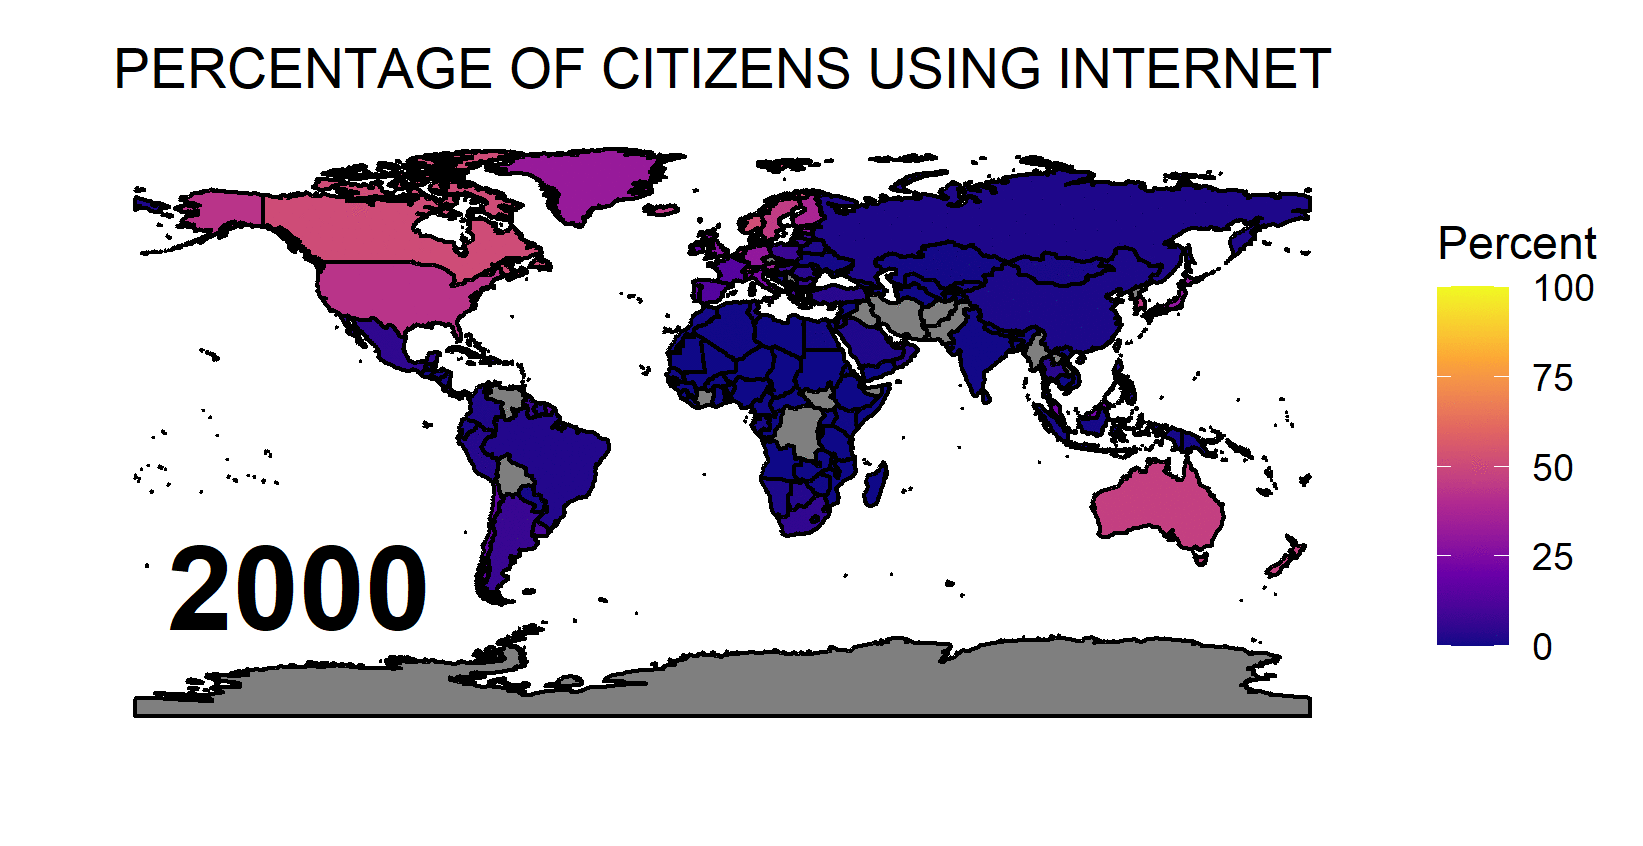
- Internet use across the globe 2000-2017
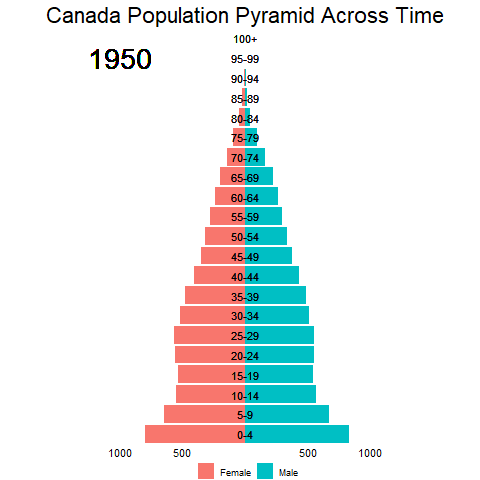
- Data Source: UN data on Canada population