English | 简体中文


pivot chart is a an extension data visualization type of pivot table. It allows user to observe the data in different chart type without limited to table and pure numbers.
pivot chart also provide with basic pivot table components for you to build your web apps, you can regard pivot table as a member in the subset of pivot charts. pivot chart is build based on cube-core: an MOLAP cube solution in js.
| feature | demo(gif) |
|---|---|
| basic expandable nest/cross table |  |
| custom aggregator of measures |  |
| different visualization type |  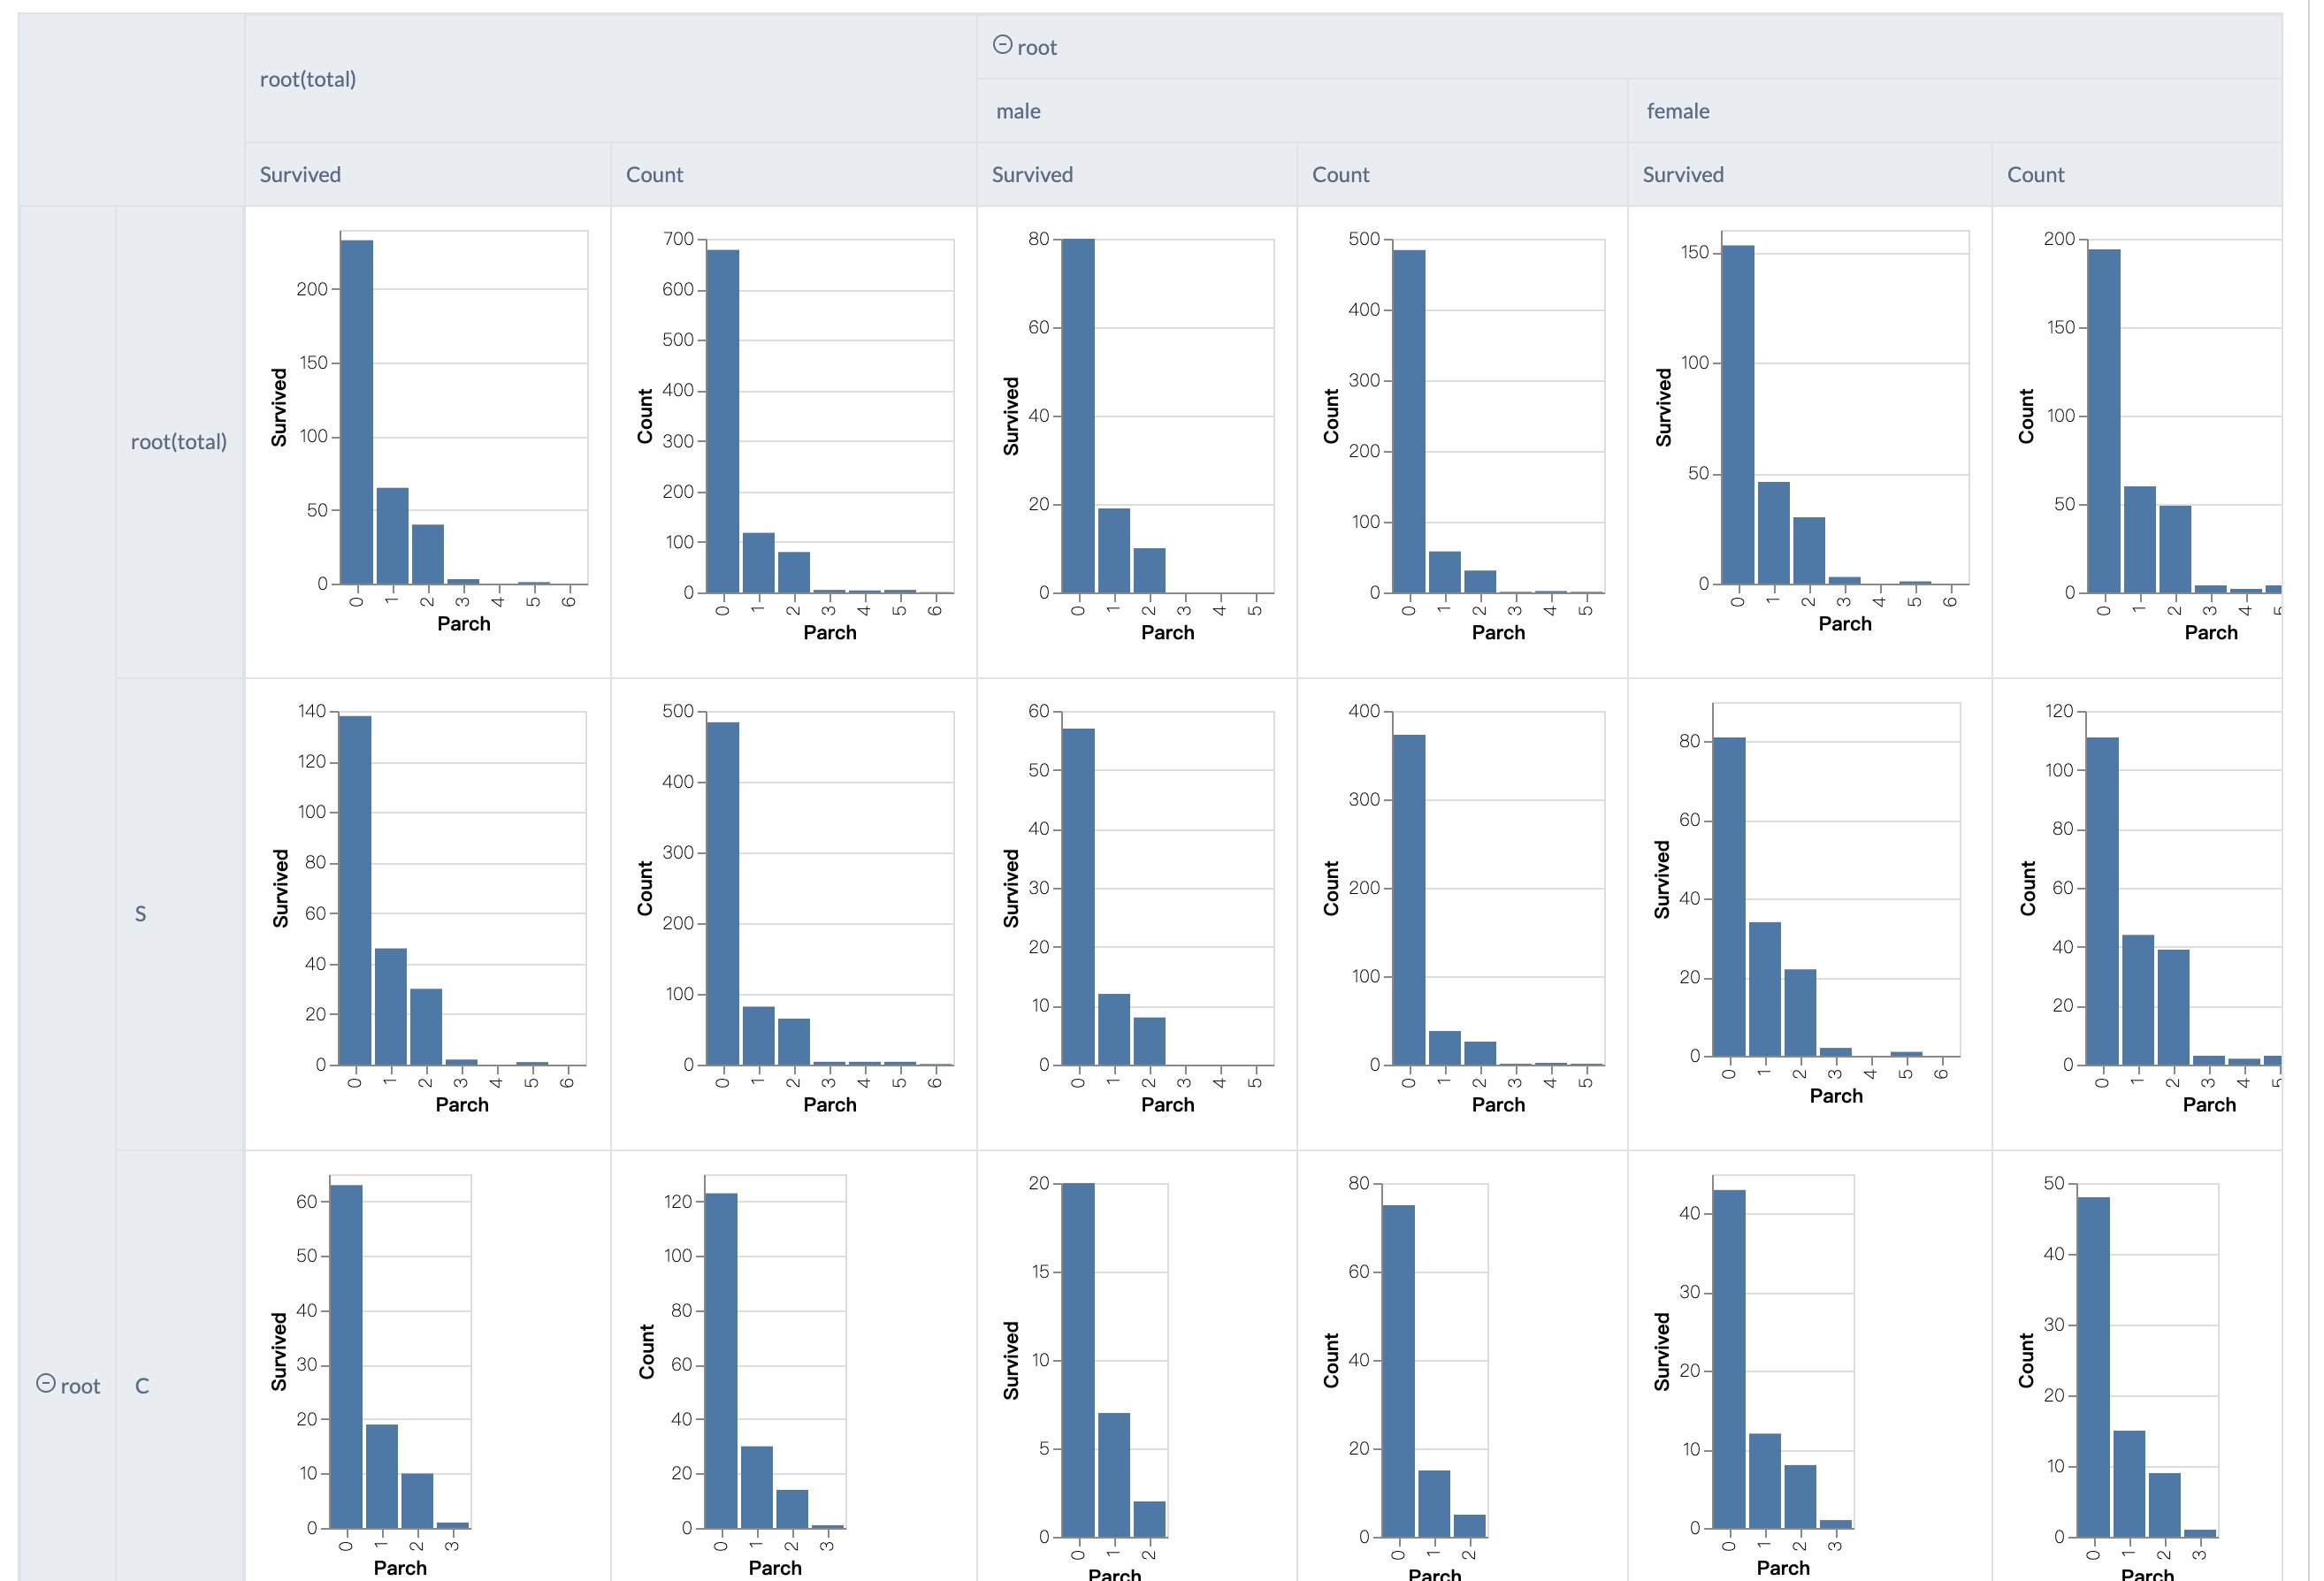 |
install npm package.
npm i --save pivot-chart

# or

yarn add pivot-chart
basic usage.
import { PivotChart } from 'fast-pivot';

function App () {
  return <PivotChart
    visType={visType}
    dataSource={data}
    rows={rows}
    columns={columns}
    measures={measures}
    />
}
demo above can be run locally with
# init development environment
yarn workspace pivot-chart initenv
# start dev server
yarn workspace pivot-chart dev| Type | Desc |
|---|---|
| Field | - id - name - aggName aggregator's name.- cmp <(a: any, b: any) => number> |
| Measure | extends Field - aggregator aggregator function.- minWidth - formatter <value: number> => number |
| VisType | currently support number , bar , line , scatter . |
| Record | a plain javascript object |
| DataSource | Record[] , Array of Record. |
| QueryNode | - dimCode - dimValue |
| QueryPath | <QueryNode[]>. example: [{dimCode: 'Sex', dimValue: 'male'}, {dimCode: 'Age', dimValue:'*'}] |
common interface are those used in both async pivot table and sync pivot table.
- rows:
Field[]dimensions in row. required - columns:
Field[]dimensions in column.required - measures:
Measure[]measures or indicators.required - visType:
VisTypemark type in cell.numberas default(which is a common pivot table).optional - defaultExpandedDepth. default expanded level in row or column nest tree.optional
- defaultExpandedDepth.rowDepth:
number - defaultExpandedDepth.columnDepth:
number
- defaultExpandedDepth.rowDepth:
- showAggregatedNode:
{row: boolean; column: boolean}whether display aggregated node for each group. optional
- dataSource:
Record[]. Array of record(normaly plain object). (json style data array). required
example:
import React, { useEffect, useState, useMemo } from 'react';
import ReactDOM from 'react-dom';
import { getTitanicData } from './mock';
import { ToolBar, PivotChart, DragableFields, Aggregators, DataSource, VisType, DraggableFieldState } from '../src/index';

const { dataSource, dimensions, measures } = getTitanicData();
const fields = dimensions.concat(measures).map(f => ({ id: f, name: f }));

const initDraggableState: DraggableFieldState = {
  fields: [],
  rows: [],
  columns: [],
  measures: []
};

function App () {
  const [data, setData] = useState<DataSource>([]);
  const [fstate, setFstate] = useState<DraggableFieldState>(initDraggableState)
  const [visType, setVisType] = useState<VisType>('number');
  useEffect(() => {
    setData(dataSource);
  }, [])
  const measures = useMemo(() => fstate['measures'].map(f => ({
    ...f,
    aggregator: Aggregators[(f.aggName || 'sum') as keyof typeof Aggregators]
  })), [fstate['measures']]);
  return <div>
    <DragableFields onStateChange={(state) => {setFstate(state)}} fields={fields} />
    <ToolBar visType={visType} onVisTypeChange={(type) => { setVisType(type) }} />
    <PivotChart visType={visType} dataSource={data} rows={fstate['rows']} columns={fstate['columns']} measures={measures} />
  </div>
}

ReactDOM.render(<App />, document.getElementById('root'))- cubeQuery:
(path: QueryPath, measures: string[]) => Promise;. A function handle for cube query. path is the groupby dimension path(made of a series of dimension and its value). measures are the fields needed to be aggregated. required - branchFilter: bad api, not recommanded to use it. a fake filter whihc only control display of node and not influence the aggregated result of parent node. optional
- dimensionCompare:
(a: string, b: string) => number.compare function for sort of dimension node. optional
function AsyncApp () {

  const [data, setData] = useState<DataSource>([]);
  const [fields, setFields] = useState<Field[]>([]);
  const [fstate, setFstate] = useState<DraggableFieldState>(initDraggableState)
  const [visType, setVisType] = useState<VisType>('number');
  useEffect(() => {
    const { dataSource, dimensions, measures } = getTitanicData();
    setData(dataSource);
    const fs: Field[] = [...dimensions, ...measures].map((f: string) => ({ id: f, name: f }));
    setFields(fs);
  }, [])
  const measures = useMemo(() => fstate['measures'].map(f => ({
    ...f,
    aggregator: Aggregators[(f.aggName || 'sum') as keyof typeof Aggregators],
    minWidth: 100,
    formatter: f.id === 'Survived' && ((val: any) => `${val} *`)
  })), [fstate['measures']]);
  const cubeQuery = useCallback(async (path: QueryPath, measures: string[]) => {
    return TitanicCubeService(path.map(p => p.dimCode), measures);
  }, [])
  return <div>
    <DragableFields onStateChange={(state) => {setFstate(state)}} fields={fields} />
    <ToolBar visType={visType} onVisTypeChange={(type) => { setVisType(type) }} />
    <AsyncPivotChart
      visType={visType}
      rows={fstate['rows']}
      columns={fstate['columns']}
      async
      defaultExpandedDepth={{
        rowDepth: 20,
        columnDepth: 20
      }}
      cubeQuery={cubeQuery}
      measures={measures} />
  </div>
}- Theme.registerTheme(theme: ThemeConfig)
ThemeConfig
interface ThemeConfig {
  root?: {
    display?: boolean,
    label?: string
  },
  summary?: {
    label?: string
  },
  table?: {
    thead?: {
      backgroundColor?: string;
      color?: string;
    }
    borderColor?: string;
    color?: string;
  }
}
// default config
const THEME_CONFIG: ThemeConfig = {
  root: {
    display: true,
    label: 'All'
  },
  summary: {
    label: '(total)'
  },
  table: {
    thead: {
      backgroundColor: '#E9EDF2',
      color: '#5A6C84'
    },
    borderColor: '#DFE3E8',
    color: '#333333'
  }
};
import React, { useEffect, useState, useMemo } from 'react';
import ReactDOM from 'react-dom';
import { getTitanicData } from './mock';
import { ToolBar, PivotChart, DragableFields, Aggregators, DataSource, VisType, DraggableFieldState, Theme } from '../src/index';
const { dataSource, dimensions, measures } = getTitanicData();
const fields = dimensions.concat(measures).map(f => ({ id: f, name: f }));
const initDraggableState: DraggableFieldState = {
fields: [],
rows: [],
columns: [],
measures: []
};
Theme.registerTheme({
root: {
display: true,
label: 'root'
},
summary: {
label: '(total)'
}
})
function App () {
const [data, setData] = useState<DataSource>([]);
const [fstate, setFstate] = useState<DraggableFieldState>(initDraggableState)
const [visType, setVisType] = useState<VisType>('number');
useEffect(() => {
setData(dataSource);
}, [])
const measures = useMemo(() => fstate['measures'].map(f => ({
...f,
aggregator: Aggregators[(f.aggName || 'sum') as keyof typeof Aggregators]
})), [fstate['measures']]);
return <div>
<DragableFields onStateChange={(state) => {setFstate(state)}} fields={fields} />
<ToolBar visType={visType} onVisTypeChange={(type) => { setVisType(type) }} />
<PivotChart visType={visType} dataSource={data} rows={fstate['rows']} columns={fstate['columns']} measures={measures} />
</div>
}
ReactDOM.render(<App />, document.getElementById('root'))
another implementation of cube-core pivot-table can be found as ./packages/demo
SyncPivotChart vs. AsyncPivotChart ?
Sync Pivot Chart does all cube computaion in frontend.(In future, it may do those work in webworker and it will seems to be async). Those cube query can be speeded up by cube-core which can reuse similarly groupby result.
Async Pivot Chart can use cube query from server or customed implementation(either on server or browser, async or sync), but developer need to figure out how to speed up those by themsleves.