This repository is now archived.
The Top Bar components have been moved to the Jupyter Resource Usage extension: https://github.com/jupyter-server/jupyter-resource-usage
If you are using JupyterLab 4+, install with:
pip install jupyter-resource-usage
If you are using JupyterLab 3, you can still install jupyterlab-system-monitor but the extension is not maintained anymore.
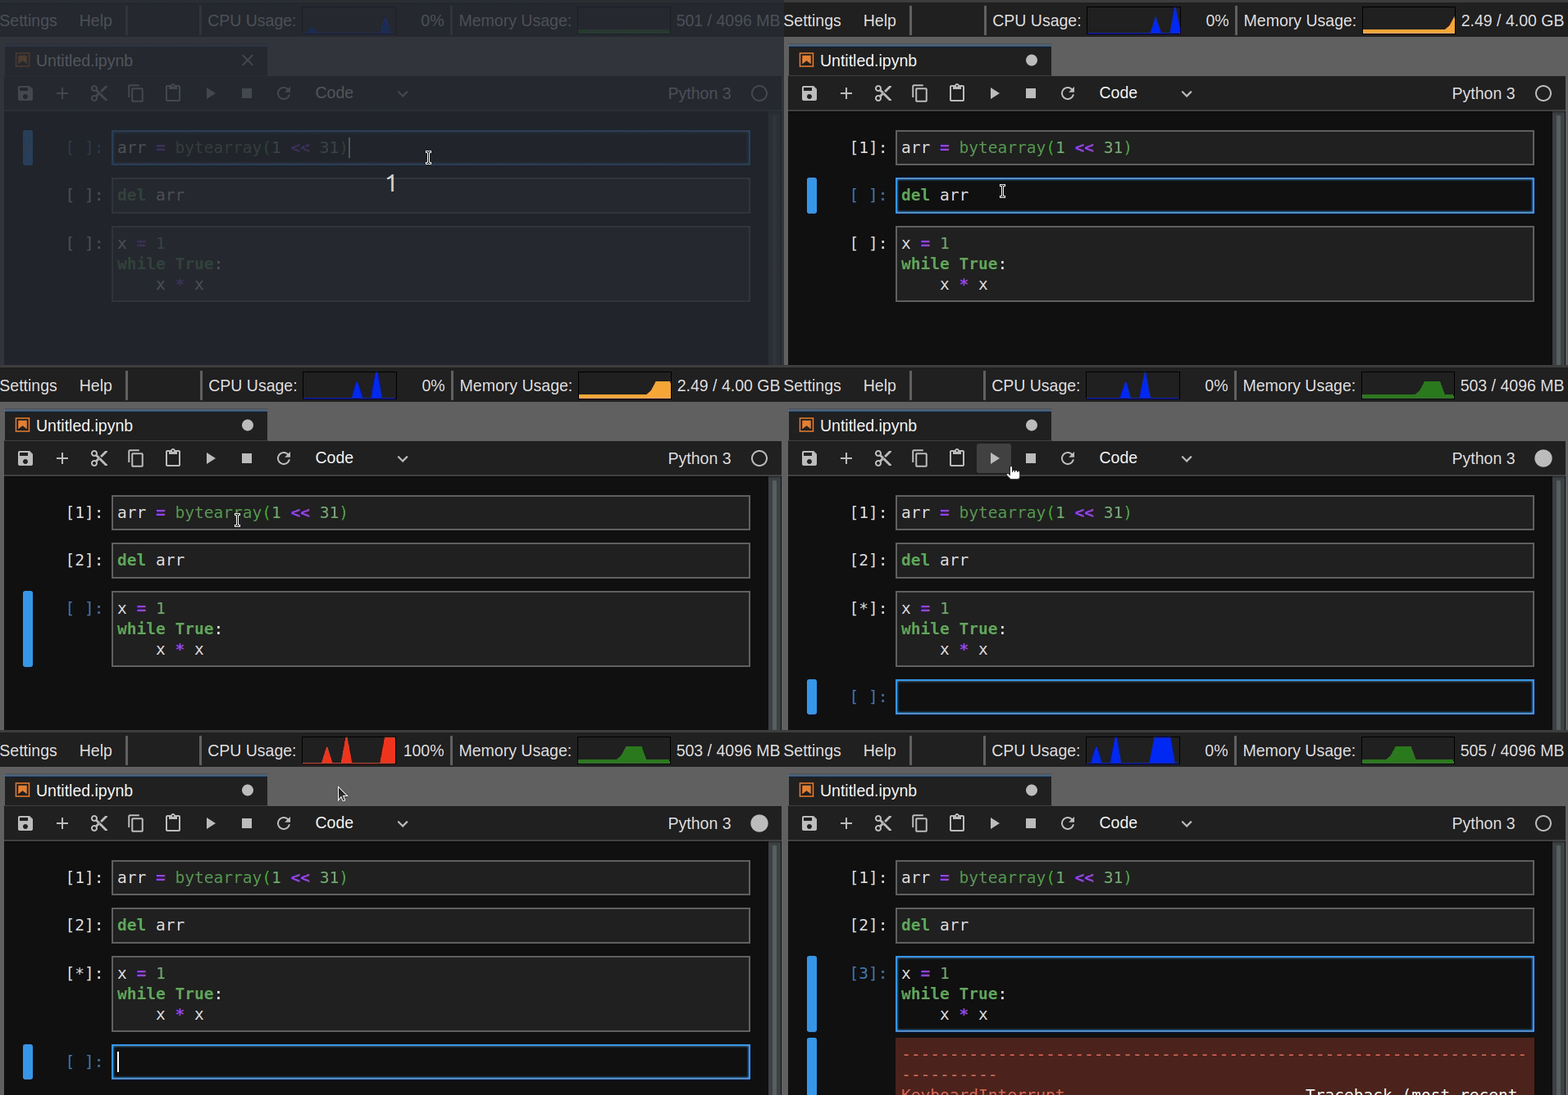
JupyterLab extension to display system information (memory and cpu usage).
Provides an alternative frontend for the jupyter-resource-usage metrics: https://github.com/jupyter-server/jupyter-resource-usage
This extension was originally developed as part of the jupyterlab-topbar project, and extracted into its own repository later on.
- Add Network I/O
- Expose more settings
- JupyterLab 1.0+
- Node.js
This extension requires the jupyter-resource-usage package and the jupyterlab-topbar-extension extension for JupyterLab.
Note: This extension is not compatible with nbresuse==0.3.4.
Starting from JupyterLab 3.0, extensions can be distributed as a Python package. Installation instructions will differ depending on your version of JupyterLab:
pip install jupyterlab-system-monitorpip install nbresuse
jupyter labextension install jupyterlab-topbar-extension jupyterlab-system-monitornbresuse can also be installed with conda:
conda install -c conda-forge nbresuseNote: Node.js is required to install JupyterLab extensions. It can be installed with conda:
conda install -c conda-forge nodejsYou can set the memory and cpu limits (but not enforce it) to display the indicator in the top bar.
For more info, check the memory limit in the nbresuse repository.
Edit ~/.jupyter/jupyter_notebook_config.py (note: see here if you do not have a config file:
c = get_config()

# memory
c.ResourceUseDisplay.mem_limit = <size_in_GB> *1024*1024*1024

# cpu
c.ResourceUseDisplay.track_cpu_percent = True
c.ResourceUseDisplay.cpu_limit = <number_of_cpus>
For example:
c.ResourceUseDisplay.mem_limit = 4294967296
c.ResourceUseDisplay.track_cpu_percent = True
c.ResourceUseDisplay.cpu_limit = 2
Or use the command line option:
# POSIX shell
jupyter lab --NotebookApp.ResourceUseDisplay.mem_limit=$(( size_in_GB *1024*1024*1024)) \
            --NotebookApp.ResourceUseDisplay.track_cpu_percent=True \
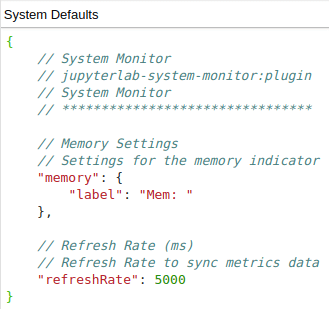
--NotebookApp.ResourceUseDisplay.cpu_limit=$(( number_of_cpus ))You can change the label and refresh rate in JupyterLab's advanced settings editor:
When this extension is running when Jupyter is hosted in a Docker container you will need to make some small adjustments. By default psutil reads the resources available to the entire system e.g. /proc/meminfo. However Docker uses cgroups to limit what resources are available to the container. Running in a container does not have an impact on the memory or CPU usage numbers, only the limits. The extension looks at all the running processes and sums up their usage. As Docker can not see processes outside the container this number will be correct.
If you are launching your Docker container with the --cpus and --memory options the easiest solution is to just pass these same values as environment variables and read them from inside the container and set limits as described in the previous configuration section. e.g.
docker run --cpus=4 --memory=16g -e CPU_LIMIT=4 -e MEM_LIMIT=16g <remaining args>
If you do not have access to these values you can get the memory limit via the cgroups file: /sys/fs/cgroup/memory/memory.limit_in_bytes. The CPU limit is much more difficult and highly depends on your use case. You will need to consult with the admin who is running your container in order to determine what CPU restrictions have been put in place.
If you are experiencing issues with the memory and cpu indicators not being displayed, make sure to check the nbresuse changelog for any breaking changes from major releases.
# create a new conda environment
conda create -n jupyterlab-system-monitor -c conda-forge jupyterlab nodejs nbresuse
conda activate jupyterlab-system-monitor

# Install dependencies
jlpm

# Install the package in development mode
pip install -e .

# Link your development version of the extension with JupyterLab
jlpm run develop

# Rebuild extension TypeScript source after making changes
jlpm run buildpip uninstall jupyterlab-system-monitor

