An agent component for Java system.
- EaseAgent
- Easeagent is the underlying component that provides non-intrusive extensions to applications of the Java ecosystem.
- Non-intrusive application extensions currently include data collection, such as tracing, metric and log collection in the APM application domain; it also includes control-panel extensions, such as redirection plugins, to provide the ability of dynamically modify configuration of the connecting back-end for supporting special scenarios, such as online stress testing in the production environment.
- In addition, users can extend Easeagent in the form of plugins to support the non-intrusive needs of user-specific scenarios.
- EaseAgent can be a Java agent for APM(Application Performance Management) system.
- EaseAgent collects the basic metrics and the service tracing logs, which is very helpful for performance analysis and troubleshooting.
- EaseAgent is compatible with mainstream monitoring ecosystems, such as Kafka, ElasticSearch, Prometheus, Zipkin, etc.
- EaseAgent majorly focuses on the Spring Boot development environments, but users can support any Java ecosystem applications through plugins.
- Easeagent can support scenario-specific business requirements through the plugin mechanism, such as traffic redirection, traffic coloring, etc.
- Safe to Java application/service.
- Instrumenting a Java application in a non-intrusive way.
- Lightweight and very low CPU, memory, and I/O resource usage.
- Highly extensible, users can easily do extension through a simple and clear plugin interface.
- Design for Micro-Service architecture, collecting the data from a service perspective.
-
Easy to use. It is right out of the box for Metirc, Tracing and Logging collecting.
- Collecting Metric & Tracing Logs.
JDBC 4.0HTTP Servlet、HTTP FilterSpring Boot 2.2.x:WebClient、RestTemplate、FeignClientRabbitMQ Client 5.x、Kafka Client 2.4.xJedis 3.5.x、Lettuce 5.3.x
- Collecting Access Logs.
HTTP Servlet、HTTP FilterSpring Cloud Gateway
- Instrumenting the
traceIdandspanIdinto user application logging automatically - Supplying the
health checkendpoint - Supplying the
readiness checkendpoint forSpringBoot2.2.x
- Collecting Metric & Tracing Logs.
-
Easy to Extend
- Simple and clear Plugin Interface, creating a plugin as few as three classes.
- Extremely cleanly packaged
TracingandMetricAPI, with a small amount of code to achieve business support.
-
Standardization
- The tracing data format is fully compatible with the zipkin data format.
- Metric data format fully supports integration with Prometheus.
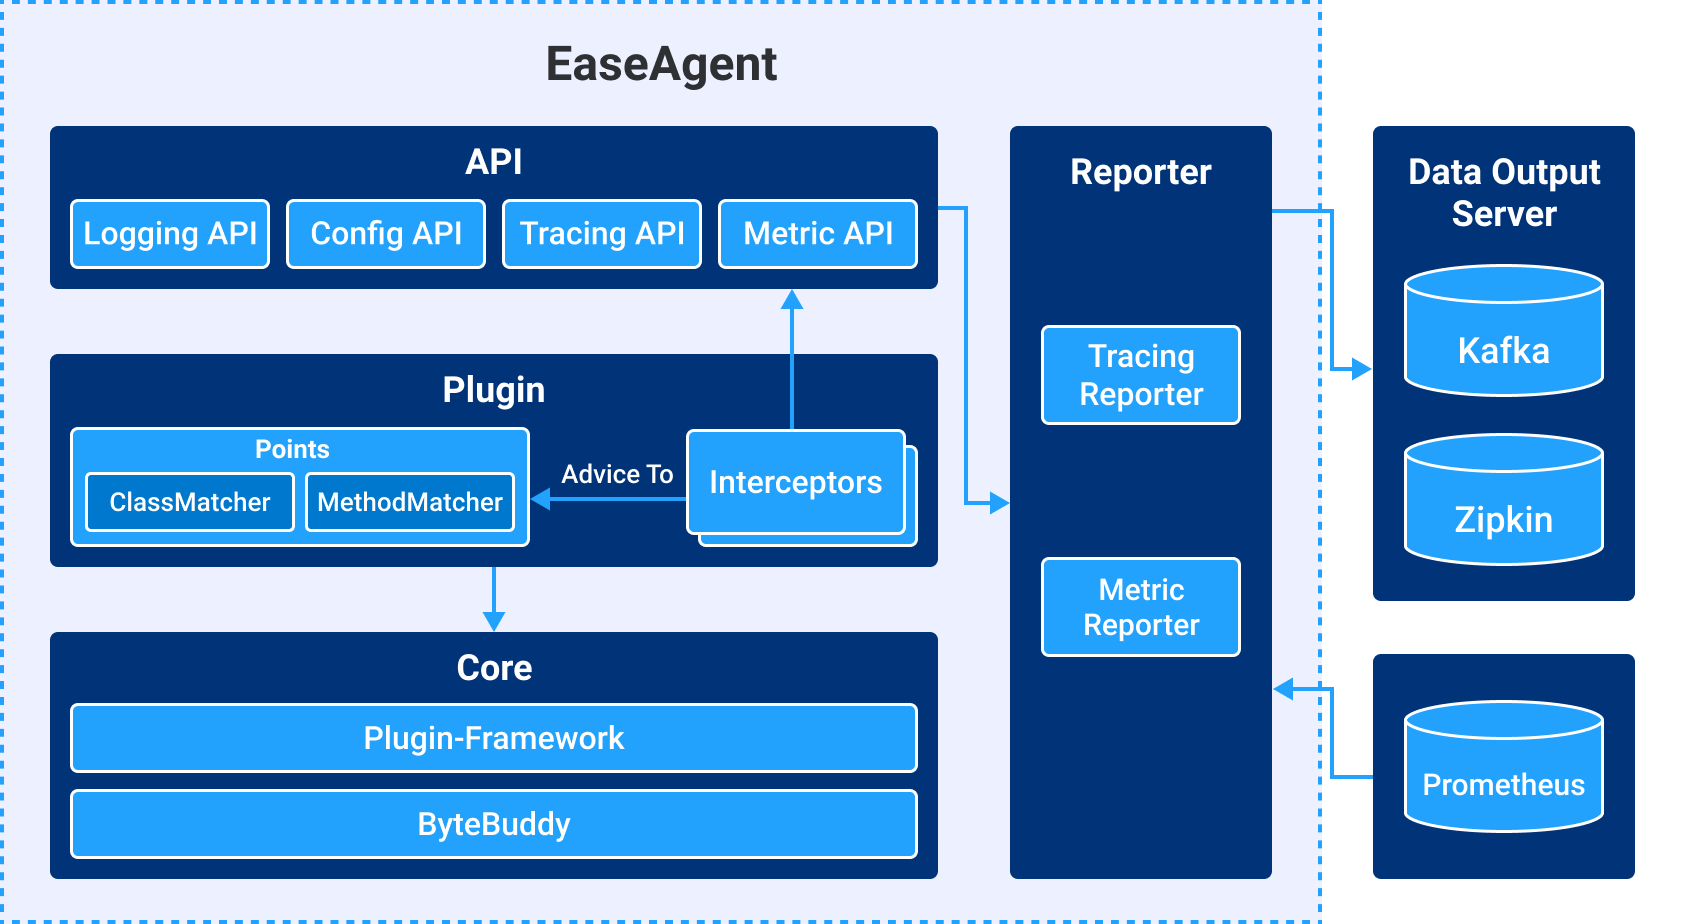
Plugin Framework in core module is base on Byte buddy technology.
- Easeagent's plugin defines where (which classes and methods) to make enhancements by Points implementation and what to do at the point of enhancement by the implementations of Interceptor.
- When the program invokes the enhanced method of class defined by Points, the
unique index(uid) owned by the method will be used as a parameter to call the common interface ofAgent Common Method Advice, which finds theAgent Interceptor Chainby theUnique Indexand calls thebeforemethod of each Interceptor in the chain in order of priority. - Normally, both the
Metric Interceptorand theTracing Interceptorare in the agent interceptor chain and are called sequentially. - According to call the
Metric APIandTracing APIin interceptors, theMetricandTracinginformation will be stored inMetricRegistryandTracing. - The
Reportermodule will get information fromMetricRegistryandTracingand send it toKafka. - The
aftermethod of each interceptor in theAgent Interceptor Chainwill be invoked in the reverse order of thebeforeinvoked at last. - The
tracingdata can be send tokafkaserver orzipkinserver, themetricdata can be send tokafkaserver and pull byPrometheusserver.
Download easeagent.jar from releases releases.
or
$ curl -Lk https://github.com/megaease/easeagent/releases/download/{tag}/easeagent.jar -O
Download EaseAgent with git clone https://github.com/megaease/easeagent.git.
$ cd easeagent
$ mvn clean package
The ./build/target/easeagent-dep.jar is the agent jar with all the dependencies.
Windows platform user please make sure git
core.autocrlfis set to false before git clone. You can usegit config --global core.autocrlf falseto modifycore.autocrlf.
Extracting the default configuration file.
$ jar xf easeagent.jar agent.properties easeagent-log4j2.xml
- Modify service name, default configuration is
demo-service.
name=[app-name]
- Modify kafka server config, default configuration is
127.0.0.1:9092. Bothtracingdata andmetricdata will be send to kafka server by default configuration.
observability.outputServer.bootstrapServer = [ip:port]
- Modify output configuration, if you want to watch log information in console.
# metric output
observability.metrics.[xxxx].appendType=console

# tracings output to console
observability.tracings.output.target=system
observability.tracings.output.enabled=false
If you want to watch tracing information only in console, comment out the outputServer configuration and set target to 'system':
# observability.outputServer.bootstrapServer=127.0.0.1:9092
# observability.outputServer.timeout=10000
# observability.outputServer.enabled=true

observability.tracings.output.target=system
- Sending tracing data to zipkin server
# [zipkin]: send data to zipkin server
# [system]: send data to kafka
observability.tracings.output.target=zipkin
observability.tracings.output.target.zipkinUrl=http://localhost:9411/api/v2/spans
$ git clone https://github.com/megaease/easeagent-test-demo.git
$ cd spring-web
$ mvn clean package

$ cd simple-plugin
$ mvn clean package
There is an agent.properties configuration file in the demo directory, which is configured to print all information to the console. If you want to print all information to console, then you can use this configuration file.
There is a simple plugin which only for demonstrating the use of the plugin.
The compiled simple plugin JAR package should be copy to the plugins directory located in EASE_AGENT_PATH, and if the directory is not exsist, it need to be created.
$ export EASE_AGENT_PATH=[Replace with agent path]
cp target/simple-plugin-1.0.jar $EASE_AGENT_PATH/plugins/
# Open another console
$ export EASE_AGENT_PATH=[Replace with agent path]
$ java "-javaagent:${EASE_AGENT_PATH}/easeagent-dep.jar=${EASE_AGENT_PATH}/agent.properties" -Deaseagent.server.port=9900 -jar target/spring-web-1.0.jar
Adding the following configuration in prometheus.yml
  - job_name: 'spring-web-service'
    static_configs:
      - targets: ['localhost:9900']
    metrics_path: "/prometheus/metrics"
Start Prometheus
$ ./prometheus --config.file=prometheus.yml

# Open another console, run curl to access the test url for several times.
$ curl -v http://127.0.0.1:18888/web_client
- Tracing
If the tracing data is send to console, there would be some tracing log in console like this:
[{"traceId":"5a8800b902703307","parentId":"84c4cba42fb92788","id":"fd00a1705c88cbb2","kind":"SERVER","name":"get","timestamp":1639493283759877,"duration":217545,"shared":true,"localEndpoint":{"serviceName":"demo-service","ipv4":"192.168.0.102"},"remoteEndpoint":{"ipv4":"127.0.0.1","port":55809},"tags":{"http.method":"GET","http.path":"/hello","http.route":"/hello","i":"ServerName.local"},"type":"log-tracing","service":"demo-service","system":"demo-system"},{"traceId":"5a8800b902703307","id":"5a8800b902703307","kind":"SERVER","name":"get","timestamp":1639493283753466,"duration":228827,"localEndpoint":{"serviceName":"demo-service","ipv4":"192.168.0.102"},"remoteEndpoint":{"ipv4":"127.0.0.1","port":55851},"tags":{"http.method":"GET","http.path":"/web_client","i":"ServerName.local"},"type":"log-tracing","service":"demo-service","system":"demo-system"}]

...
- Metric
Open Browser to visit http://localhost:9090.
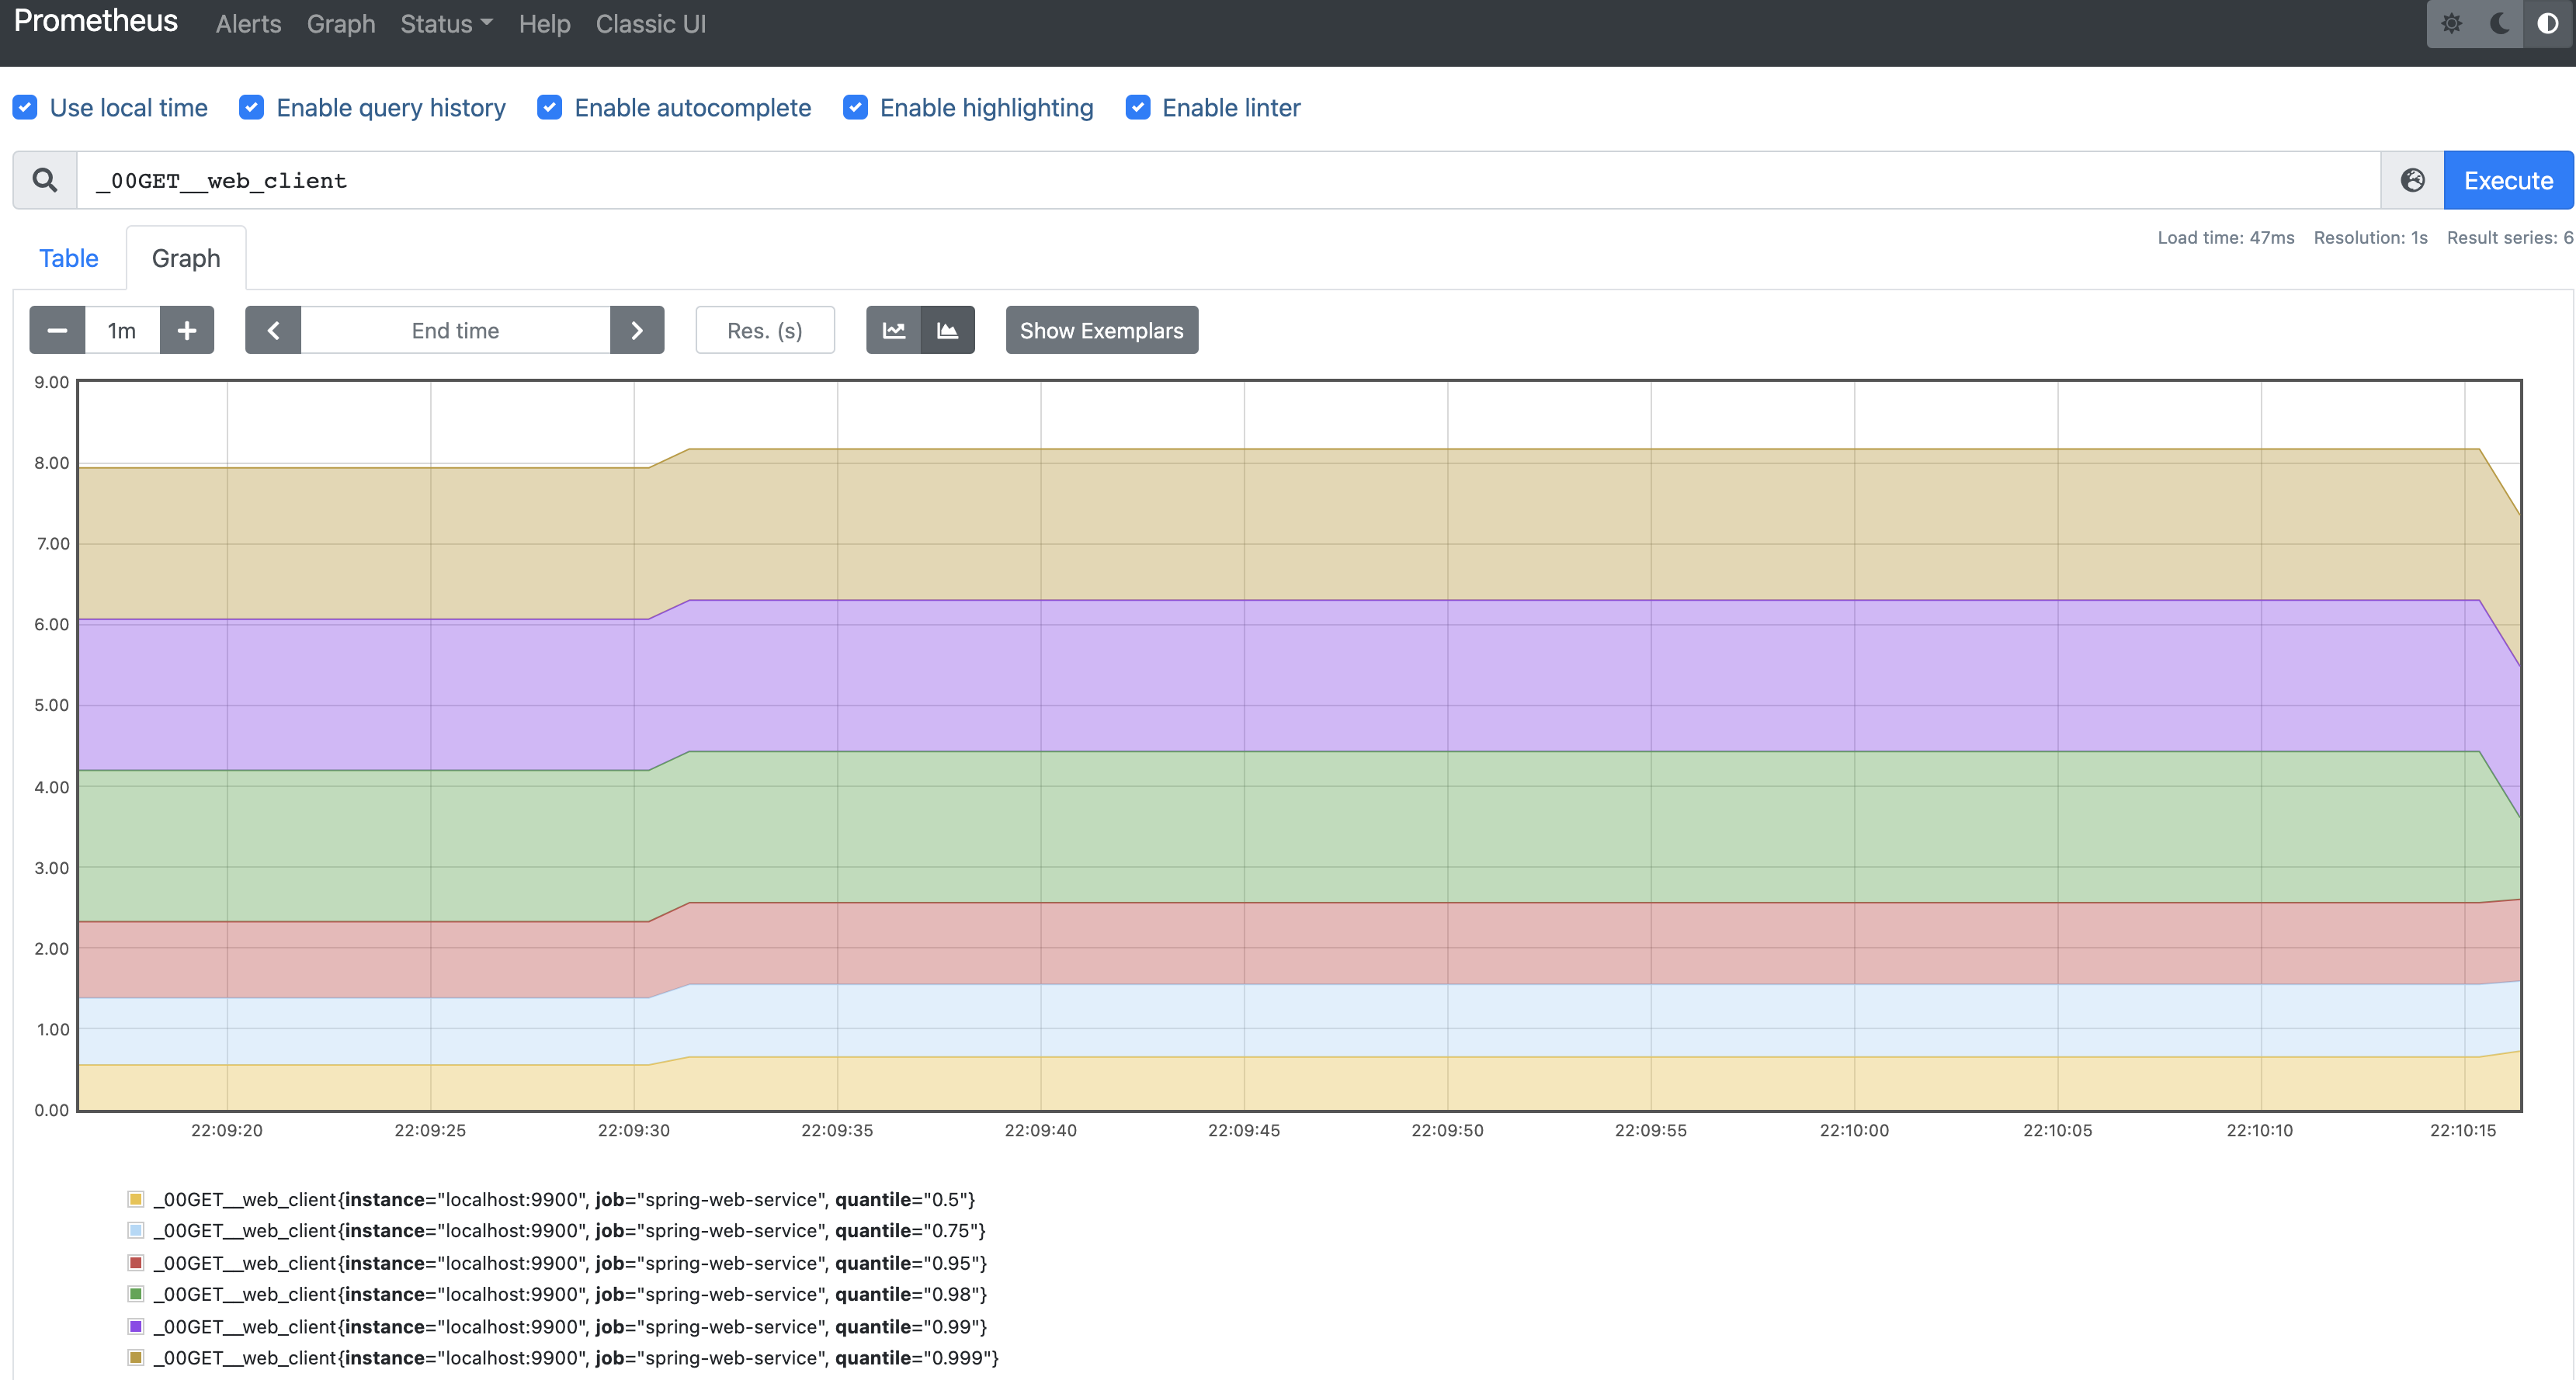
After visit more pages, open Prometheus manager http://localhost:9090, and search _00GET__web_client. You will see as following.
For more information, please refer to the User Manual.
Refer to Plugin Development Guide.
EaseAgent is licensed under the Apache License, Version 2.0. See LICENSE for the full license text.

