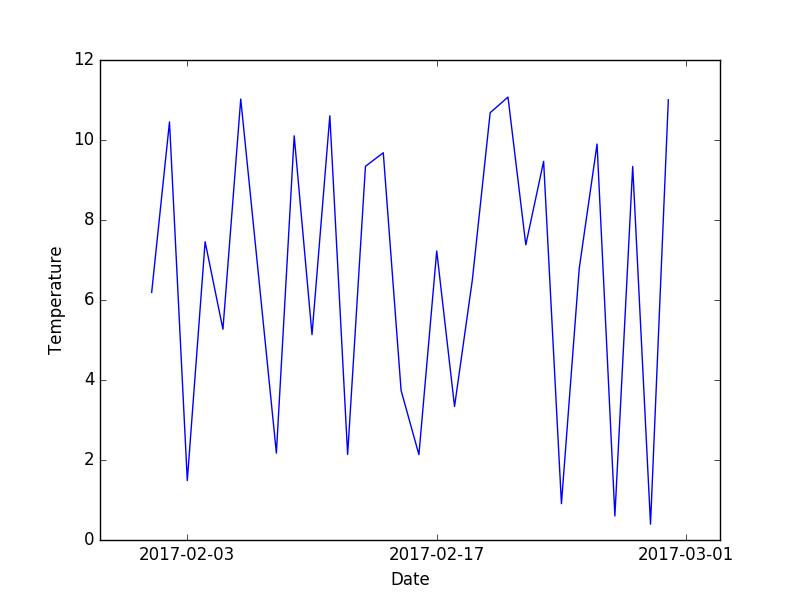
Support for cftime axis in matplotlib.
conda install -c conda-forge nc-time-axis
import random

import matplotlib.pyplot as plt
import nc_time_axis
import cftime

d_time = [cftime.datetime(year=2017, month=2, day=n) for n in range(1, 31)]
c_d_time = [nc_time_axis.CalendarDateTime(item, "360_day") for item in d_time]
temperatures = [round(random.uniform(0, 12), 3) for _ in range(len(c_d_time))]

plt.plot(c_d_time, temperatures)
plt.margins(0.1)
plt.ylim(0, 12)
plt.xlabel("Date")
plt.ylabel("Temperature")
plt.show()
