Repository Description:
Instructions and tools for deploying and using the Spark on Kubernetes Operator and the Spark History Server on OpenShift alongside Open Data Hub. The provided custom Spark images include S3 connectors and committers, and JMX exporter for monitoring.
Compatibility:
-
Tested with OpenShift 4.7, 4.8, 4.9, 4.10
-
No link with Open Data Hub, so will work with any version.
We include in this project custom Spark images with the Hadoop S3a connector to connect to S3-based object storage. Those images are based on ubi8/openjdk-8, and are updated accordingly.
Pre-built images can be found here, https://quay.io/repository/opendatahub-contrib/spark and https://quay.io/repository/opendatahub-contrib/pyspark, but you can also choose to build your own.
Available images:
-
Spark images:
-
Spark 2.4.4 + Hadoop 2.8.5
-
Spark 2.4.6 + Hadoop 3.3.0
-
Spark 3.0.1 + Hadoop 3.3.0
-
Spark 3.3.0 + Hadoop 3.3.3
-
Spark 3.3.1 + Hadoop 3.3.4
-
-
PySpark images:
-
Spark 2.4.4 + Hadoop 2.8.5 + Python 3.6
-
Spark 2.4.6 + Hadoop 3.3.0 + Python 3.6
-
Spark 3.0.1 + Hadoop 3.3.0 + Python 3.8
-
Spark 3.3.0 + Hadoop 3.3.3 + Python 3.9
-
Spark 3.3.1 + Hadoop 3.3.4 + Python 3.9
-
In the spark-images folder you will find the sources for the pre-built images. You can built them again, or use them as templates for your own images, should you want to change additional libraries versions or add others. Pay attention to the slight differences in the Dockerfiles depending on the version of Spark, Hadoop or Python you want to install.
Example, from the spark-images folder:
podman build --file spark-3.3.0_hadoop-3.3.3.Dockerfile --tag spark-odh:s3.3.0-h3.3.3_v0.0.1 .podman tag spark-odh:s3.3.0-h3.3.3_v0.0.1 your_repo/spark-odh:s3.3.0-h3.3.3_v0.0.1
podman push your_repo/spark-odh:s3.3.0-h3.3.3_v0.0.1You can also extend a Spark image with Python to create a PySpark-compatible image:
podman build --file pyspark.Dockerfile --tag pyspark-odh:s3.3.0-h3.3.3_v0.0.1 --build-arg base_img=spark-odh:s3.3.0-h3.3.3_v0.0.1 .podman tag pyspark-odh:s3.3.0-h3.3.3_v0.0.1 your_repo/pyspark-odh:s3.3.0-h3.3.3_v0.0.1
podman push your_repo/pyspark-odh:s3.3.0-h3.3.3_v0.0.1The operator will be installed in its own namespace but will be able to monitor all namespaces for jobs to be launched.
oc new-project spark-operator|
Note
|
From now on all the oc commands are supposed to be run in the context of this project.
|
We can use the standard version of the Spark on Kubernetes Operator at its latest version.
helm repo add spark-operator https://googlecloudplatform.github.io/spark-on-k8s-operatorhelm install spark-operator spark-operator/spark-operator --namespace spark-operator --create-namespace --set image.tag=v1beta2-1.3.3-3.1.1 --set webhook.enable=true --set resourceQuotaEnforcement.enable=trueWe can monitor the Spark operator itself, as well as the applications it creates with Prometheus and Grafana. Note that this is only monitoring and reporting on the workload metrics. To get information about the Spark Jobs themselves you need to deploy the Spark History Server (see below).
|
Note
|
Prerequisites: Prometheus and Grafana must be installed in your environment. The easiest way is to use their respective operators. Deploy the operators in the spark-operator namespace, and create simple instance of Prometheus and Grafana.
|
From the spark-operator folder:
oc apply -f spark-application-metrics_svc.yaml
oc apply -f spark-operator-metrics_svc.yamloc apply -f spark-service-monitor.yamloc apply -f prometheus-datasource.yaml|
Note
|
We also need another datasource to retrieve base CPU and RAM metrics from Prometheus. To do that we will connect to the "main" OpenShift Prometheus with the following procedure. |
oc adm policy add-cluster-role-to-user cluster-monitoring-view -z grafana-serviceaccountexport BEARER_TOKEN=$(oc serviceaccounts get-token grafana-serviceaccount)Deploy main-prometheus-datasource.yaml file with the BEARER_TOKEN value.
cat main-prometheus-datasource.yaml | sed -e "s/BEARER_TOKEN/$BEARER_TOKEN/g" | oc apply -f -oc apply -f spark-operator-dashboard.yaml
oc apply -f spark-application-dashboard.yamlThe operator creates a special Service Account and a Role to create pods and services in the namespace where it is deployed.
If you want to create SparkApplication or ScheduledSparkApplication objects in another namespace, you first have to create an account, a role and a rolebinding into it.
This ServiceAccount is the one you need to use for your all the Spark applications in this specific namespace.
From the spark-operator folder, while in the target namespace (oc project YOUR_NAMESPACE):
oc apply -f spark-rbac.yamlThe operator only creates ephemeral workloads. So unless you look at the logs in real time, you will loose all related information after the workload is finished.
To avoid losing this precious information, you can (and you should!) send all the logs to a specific location, and set up the Spark History Server to be able to view and interpret them at any time.
The logs location has to be shared storage that all pods can access simultaneously, so Object Storage (S3), Hadoop (HDFS), NFS,…
For this setup we will be using Object Storage from OpenShift Data Foundation.
|
Note
|
All the following commands are executed from the spark-history-server folder.
|
First, create a dedicated bucket to store the logs from the Spark jobs.
Again, here we are using an Object Bucket Claim from OpenShift Data Foundation, which will create a bucket using the Multi-Cloud Gateway. Please adapt this depending on your chosen storage solution.
oc apply -f spark-hs-obc.yaml|
Important
|
The Spark/Hadoop instances cannot log directly into an empty bucket. A "folder" must exist where the logs will be sent. We will help Spark/Hadoop into creating this folder by uploading an empty hidden file to the location we want this folder. |
Retrieve the Access and Secret Key from the Secret named obc-spark-history-server, the name of the bucket from the ConfigMap named obc-spark-history-server, as well as the Route to the S3 storage.
export AWS_ACCESS_KEY_ID=YOUR_ACCESS_KEY
export AWS_SECRET_ACCESS_KEY=YOUR_SECRET_ACCESS_KEY
export S3_ROUTE=YOUR_ROUTE_TO_S3
export BUCKET_NAME=YOUR_BUCKET_NAME
aws --endpoint-url $S3_ROUTE s3 cp .s3keep s3://$BUCKET_NAME/logs-dir/.s3keep
Naming this file .s3keep will mark it as hidden from from the History Server and Spark logging mechanism perspective, but the "folder" will appear as being present, making everyone happy!
You will find an empty .s3keep file that you can already use in the spark-history-server folder.
We can now create the service account, Role, RoleBonding, Service, Route and Deployment for the History Server.
oc apply -f spark-hs-deployment.yamlThe UI of the Spark History Server is now accessible through the Route that was created, named spark-history-server
A quick test/demo can be done with the standard word count example from Shakespeare’s sonnets.
Create a bucket using an Object Bucket Claim and populate it with the data.
|
Note
|
This OBC creates a bucket with the MCG from an OpenShift Data Foundation deployment. Adapt the instructions depending on your S3 provider. |
From the test folder:
oc apply -f obc.yamlRetrieve the Access and Secret Key from the Secret named spark-demo, the name of the bucket from the ConfigMap named spark-demo as well as the Route to the S3 storage.
shakespeare.txt), to the bucketexport AWS_ACCESS_KEY_ID=YOUR_ACCESS_KEY
export AWS_SECRET_ACCESS_KEY=YOUR_SECRET_ACCESS_KEY
export S3_ROUTE=YOUR_ROUTE_TO_S3
export BUCKET_NAME=YOUR_BUCKET_NAME
aws --endpoint-url $S3_ROUTE s3 cp shakespeare.txt s3://$BUCKET_NAME/shakespeare.txt|
Tip
|
If your endpoint is using a self-signed certificate, you can add --no-verify-ssl to the command.
|
Our application file is wordcount.py that you can find in the folder. To make it accessible to the Spark Application, we will package it as data inside a Config Map. This CM will be mounted as a Volume inside our Spark Application YAML definition.
oc apply -f wordcount_configmap.yamlWe are now ready to launch our Spark Job using the SparkApplication CRD from the operator. Our YAML definition will:
-
Use the application file (wordcount.py) from the ConfigMap mounted as a volume in the Spark Operator, the driver and the executors.
-
Inject the Endpoint, Bucket, Access and Secret Keys inside the containers definition so that the driver and the workers can retrieve the data to process it.
oc apply -f spark_app_shakespeare_version-to-test.yamlIf you look at the OpenShift UI you will see the driver, then the workers spawning. They will execute the program, then terminate.
You can now retrieve the results:
aws --endpoint-url $S3_ROUTE s3 ls s3://$BUCKET_NAME/You will see that the results have been saved in a location called sorted_count_timestamp.
timestamp with the right value)aws --endpoint-url $S3_ROUTE s3 cp s3://$BUCKET_NAME/sorted_counts_timestamp ./ --recursiveThere should be different files:
-
_SUCCESS: just an indicator -
part-00000andpart-00001: the results themselves that will look like:
('', 2832)
('and', 490)
('the', 431)
('to', 414)
('my', 390)
('of', 369)
('i', 339)
('in', 323)
('that', 322)
('thy', 287)
('thou', 234)
('with', 181)
('for', 171)
('is', 167)
('not', 166)
('a', 163)
('but', 163)
('love', 162)
('me', 160)
('thee', 157)
....
So the sorted list of all the words with their occurrences in the full text.
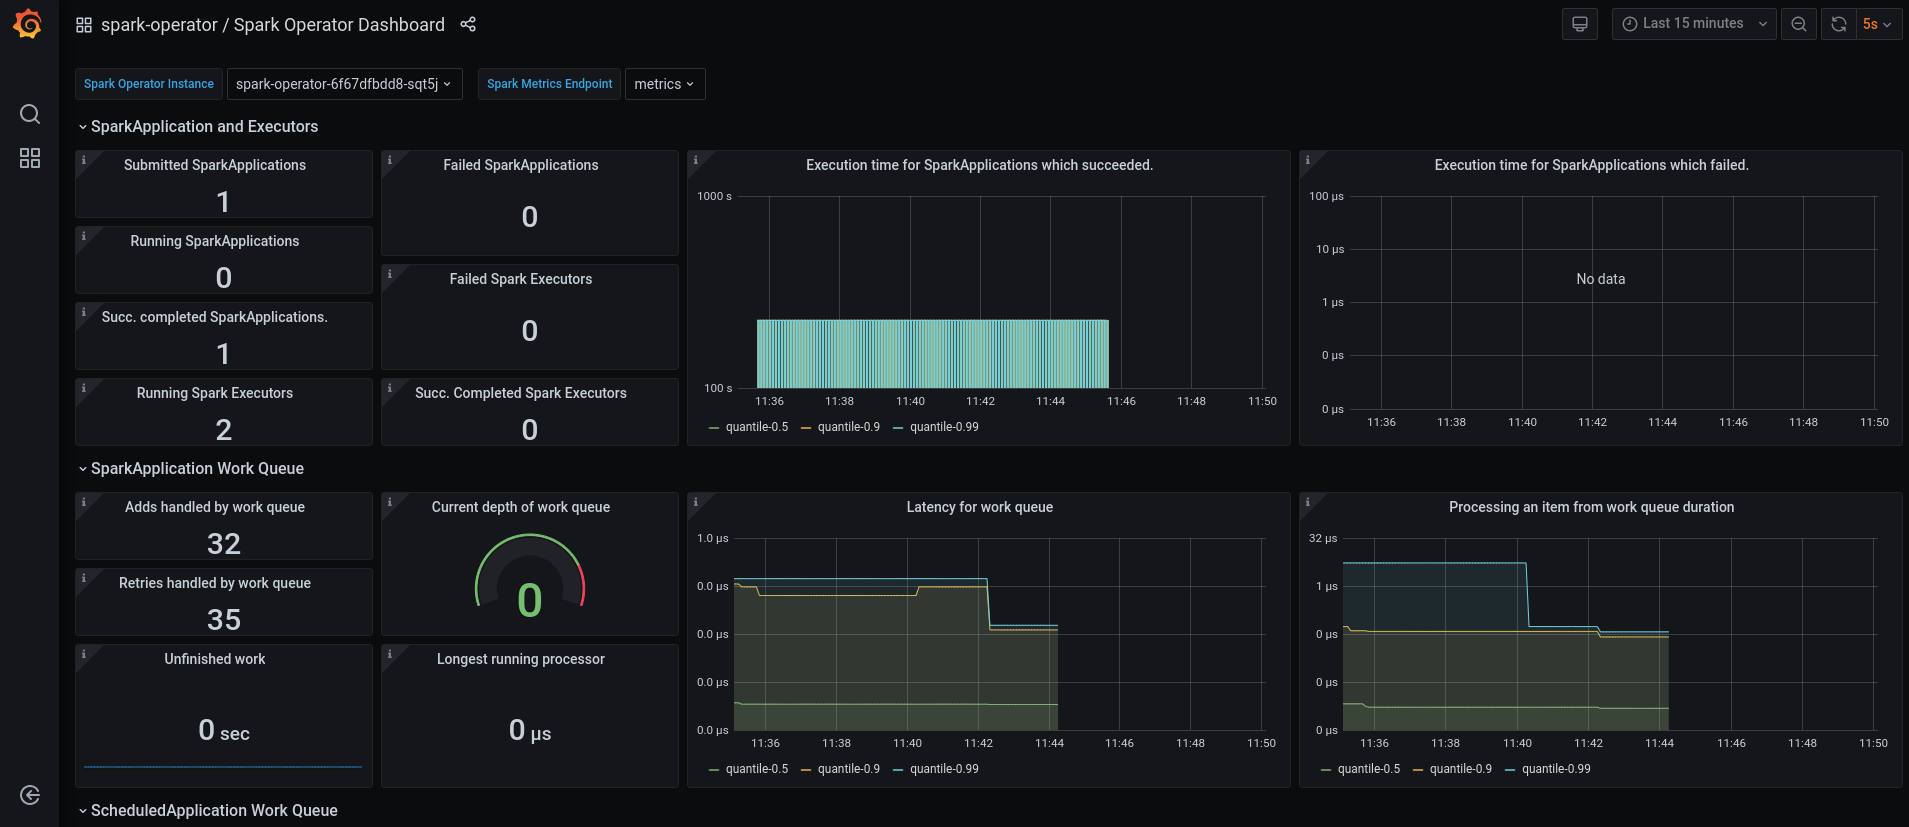
While a job is running you can also have a look at the Grafana dashboards we created for monitoring. It will look like this:
We will now run the same job, but log the output using our history server. Have a look at the YAML file to see how this is configured.
To send the logs to the history server bucket, you have to modify the `sparkconf`section starting at line 9. Replace the values for YOUR_BUCKET, AWS_ACCESS_KEY_ID and AWS_SECRET_ACCESS_KEY with the corresponding value for the history server bucket.
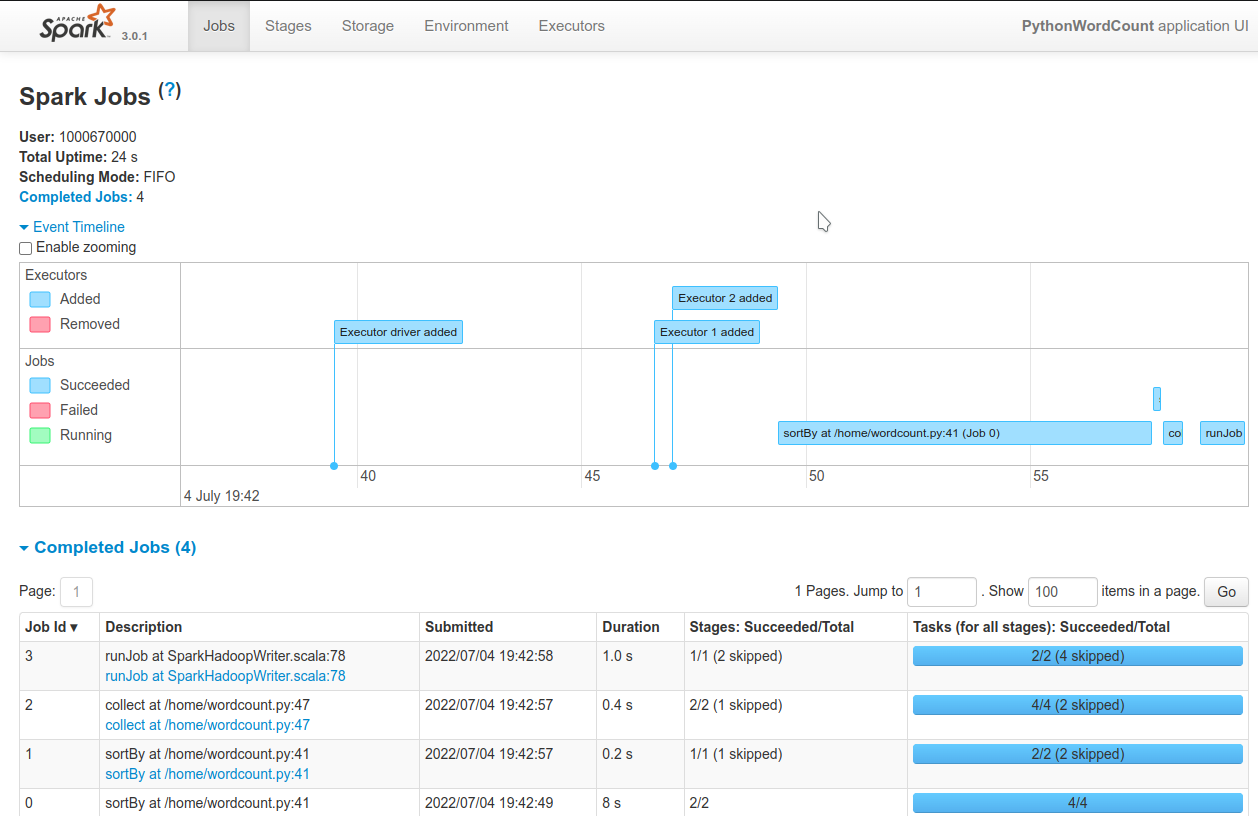
oc apply -f spark_app_shakespeare_version-to-test_history_server.yamlIf you go to the history server URL, you now have access to all the logs and nice dashboards like this one for the different workloads you have run.
There are endless configuration, settings and tweaks you can use with Spark. On top of the standard documentation, here are some documents you will find interesting to make the most use of Spark on OpenShift.
-
Detailed walkthrough and code for running TPC-DS benchmark with Spark on OpenShift. Lots of useful configuration information to interact with the storage.


