Crisis In Your City
Live version: http://crisis-in-your-city.herokuapp.com/
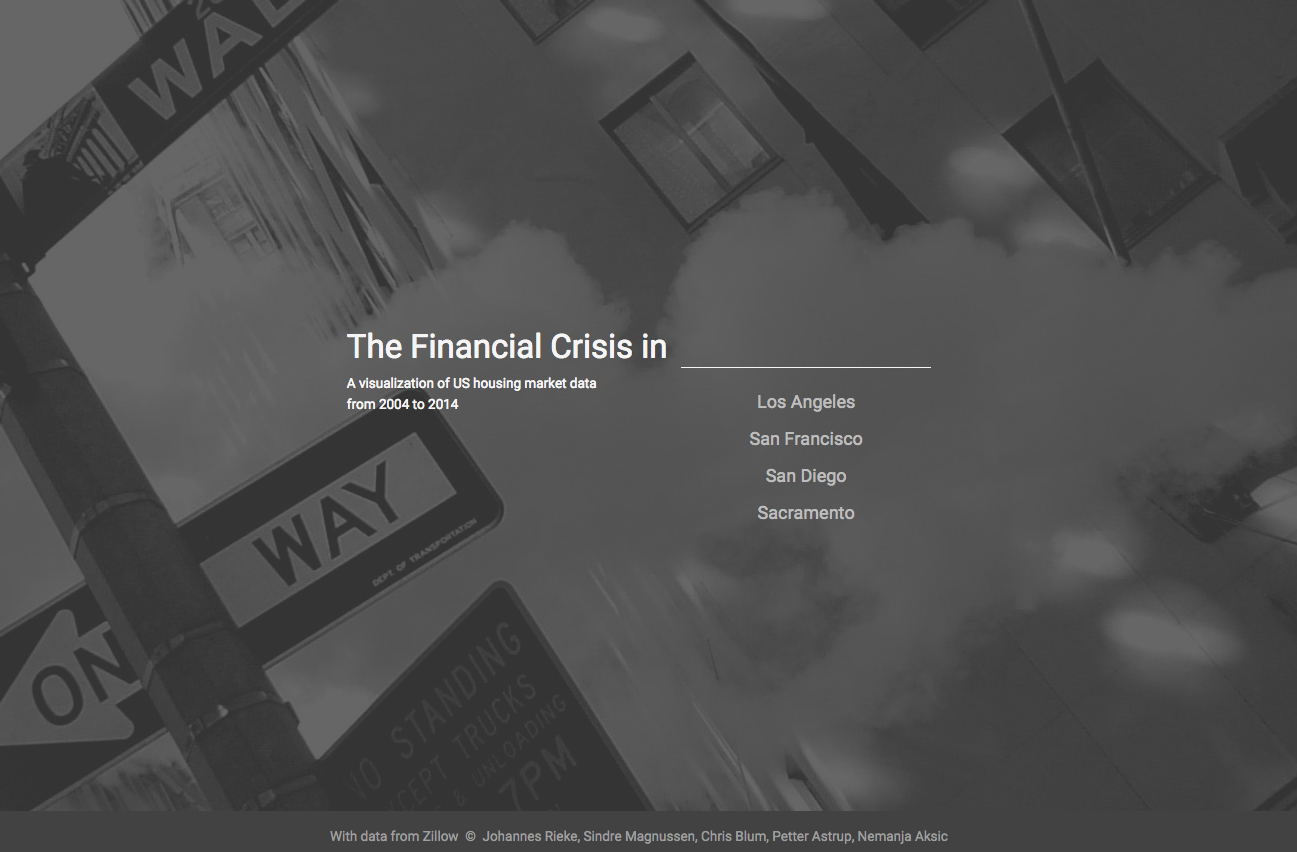
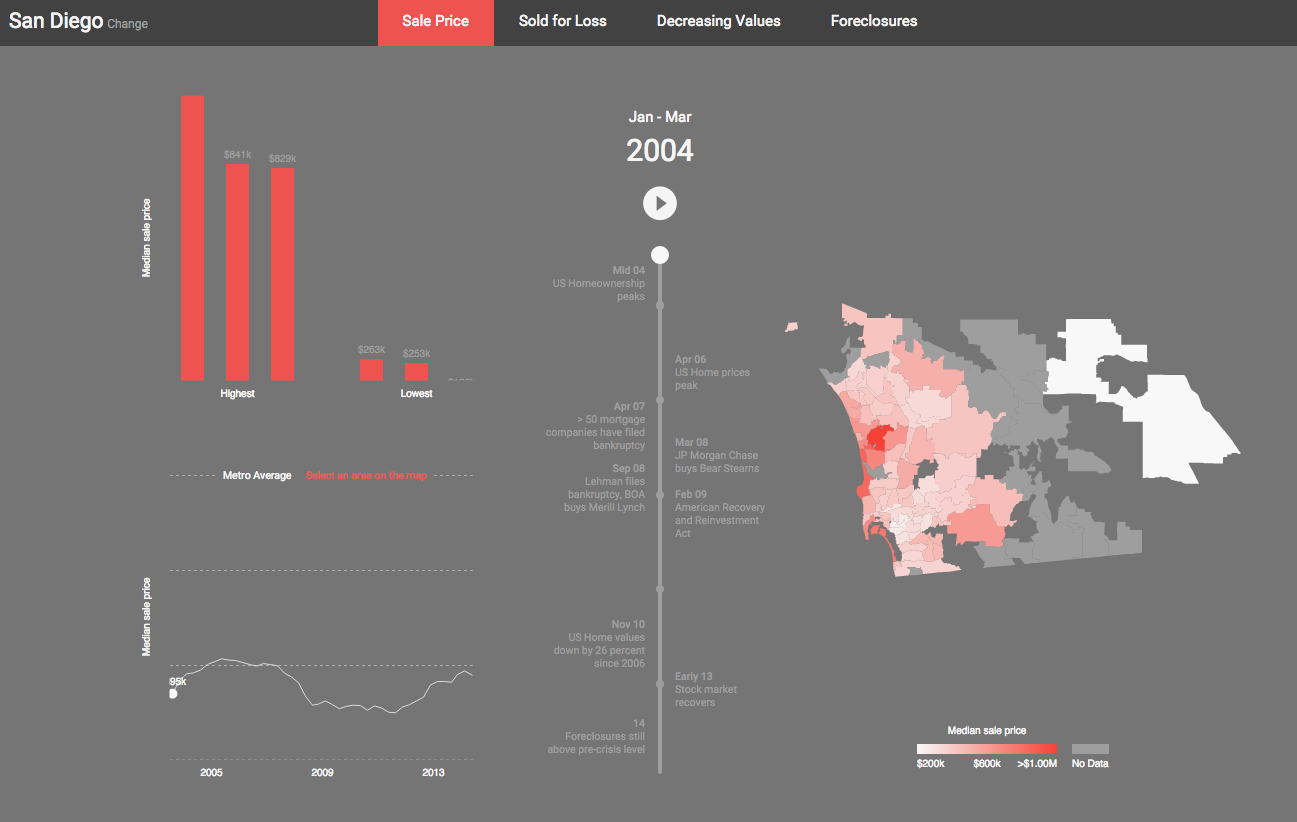
This website visualizes data about the housing market during the time of the financial crisis. Specifically, it shows how the crisis affected the situation within a city. Currently, all cities in the states of California and New York are integrated.
The application is built on Node.js and Express. The datasets come from Zillow Real Estate Research and are accessed through the DELPHI database at UCSD. Visualizations are done with D3.js, C3.js and datamaps.
This is our final project for the class Cognitive Science 121: Human Computer Interaction Programming Studio at UCSD (Spring Quarter 2015).
Team name: Extension-1
Team members: Johannes Rieke, Chris Blum, Sindre Magnussen, Petter Astrup, Nemanja Aksic

