A simple Python program to show the prevalence of obesity among adults, BMI
Use the function lib.load_dataset to see the data from the CSV file (./dataset/obesity-cleaned.csv). To generate the plot use the function lib.plot_data using the parameters:
- csv_file (str): The path to the CSV file containing the data.
- country (str): The country for which the data will be plotted.
- sex (str, optional): The sex for which the data will be plotted. Defaults to "all". Other options are: "Female", "Male" and "Both sexes".
It generates a plot using Matplotlib and saves it in a PNG file.
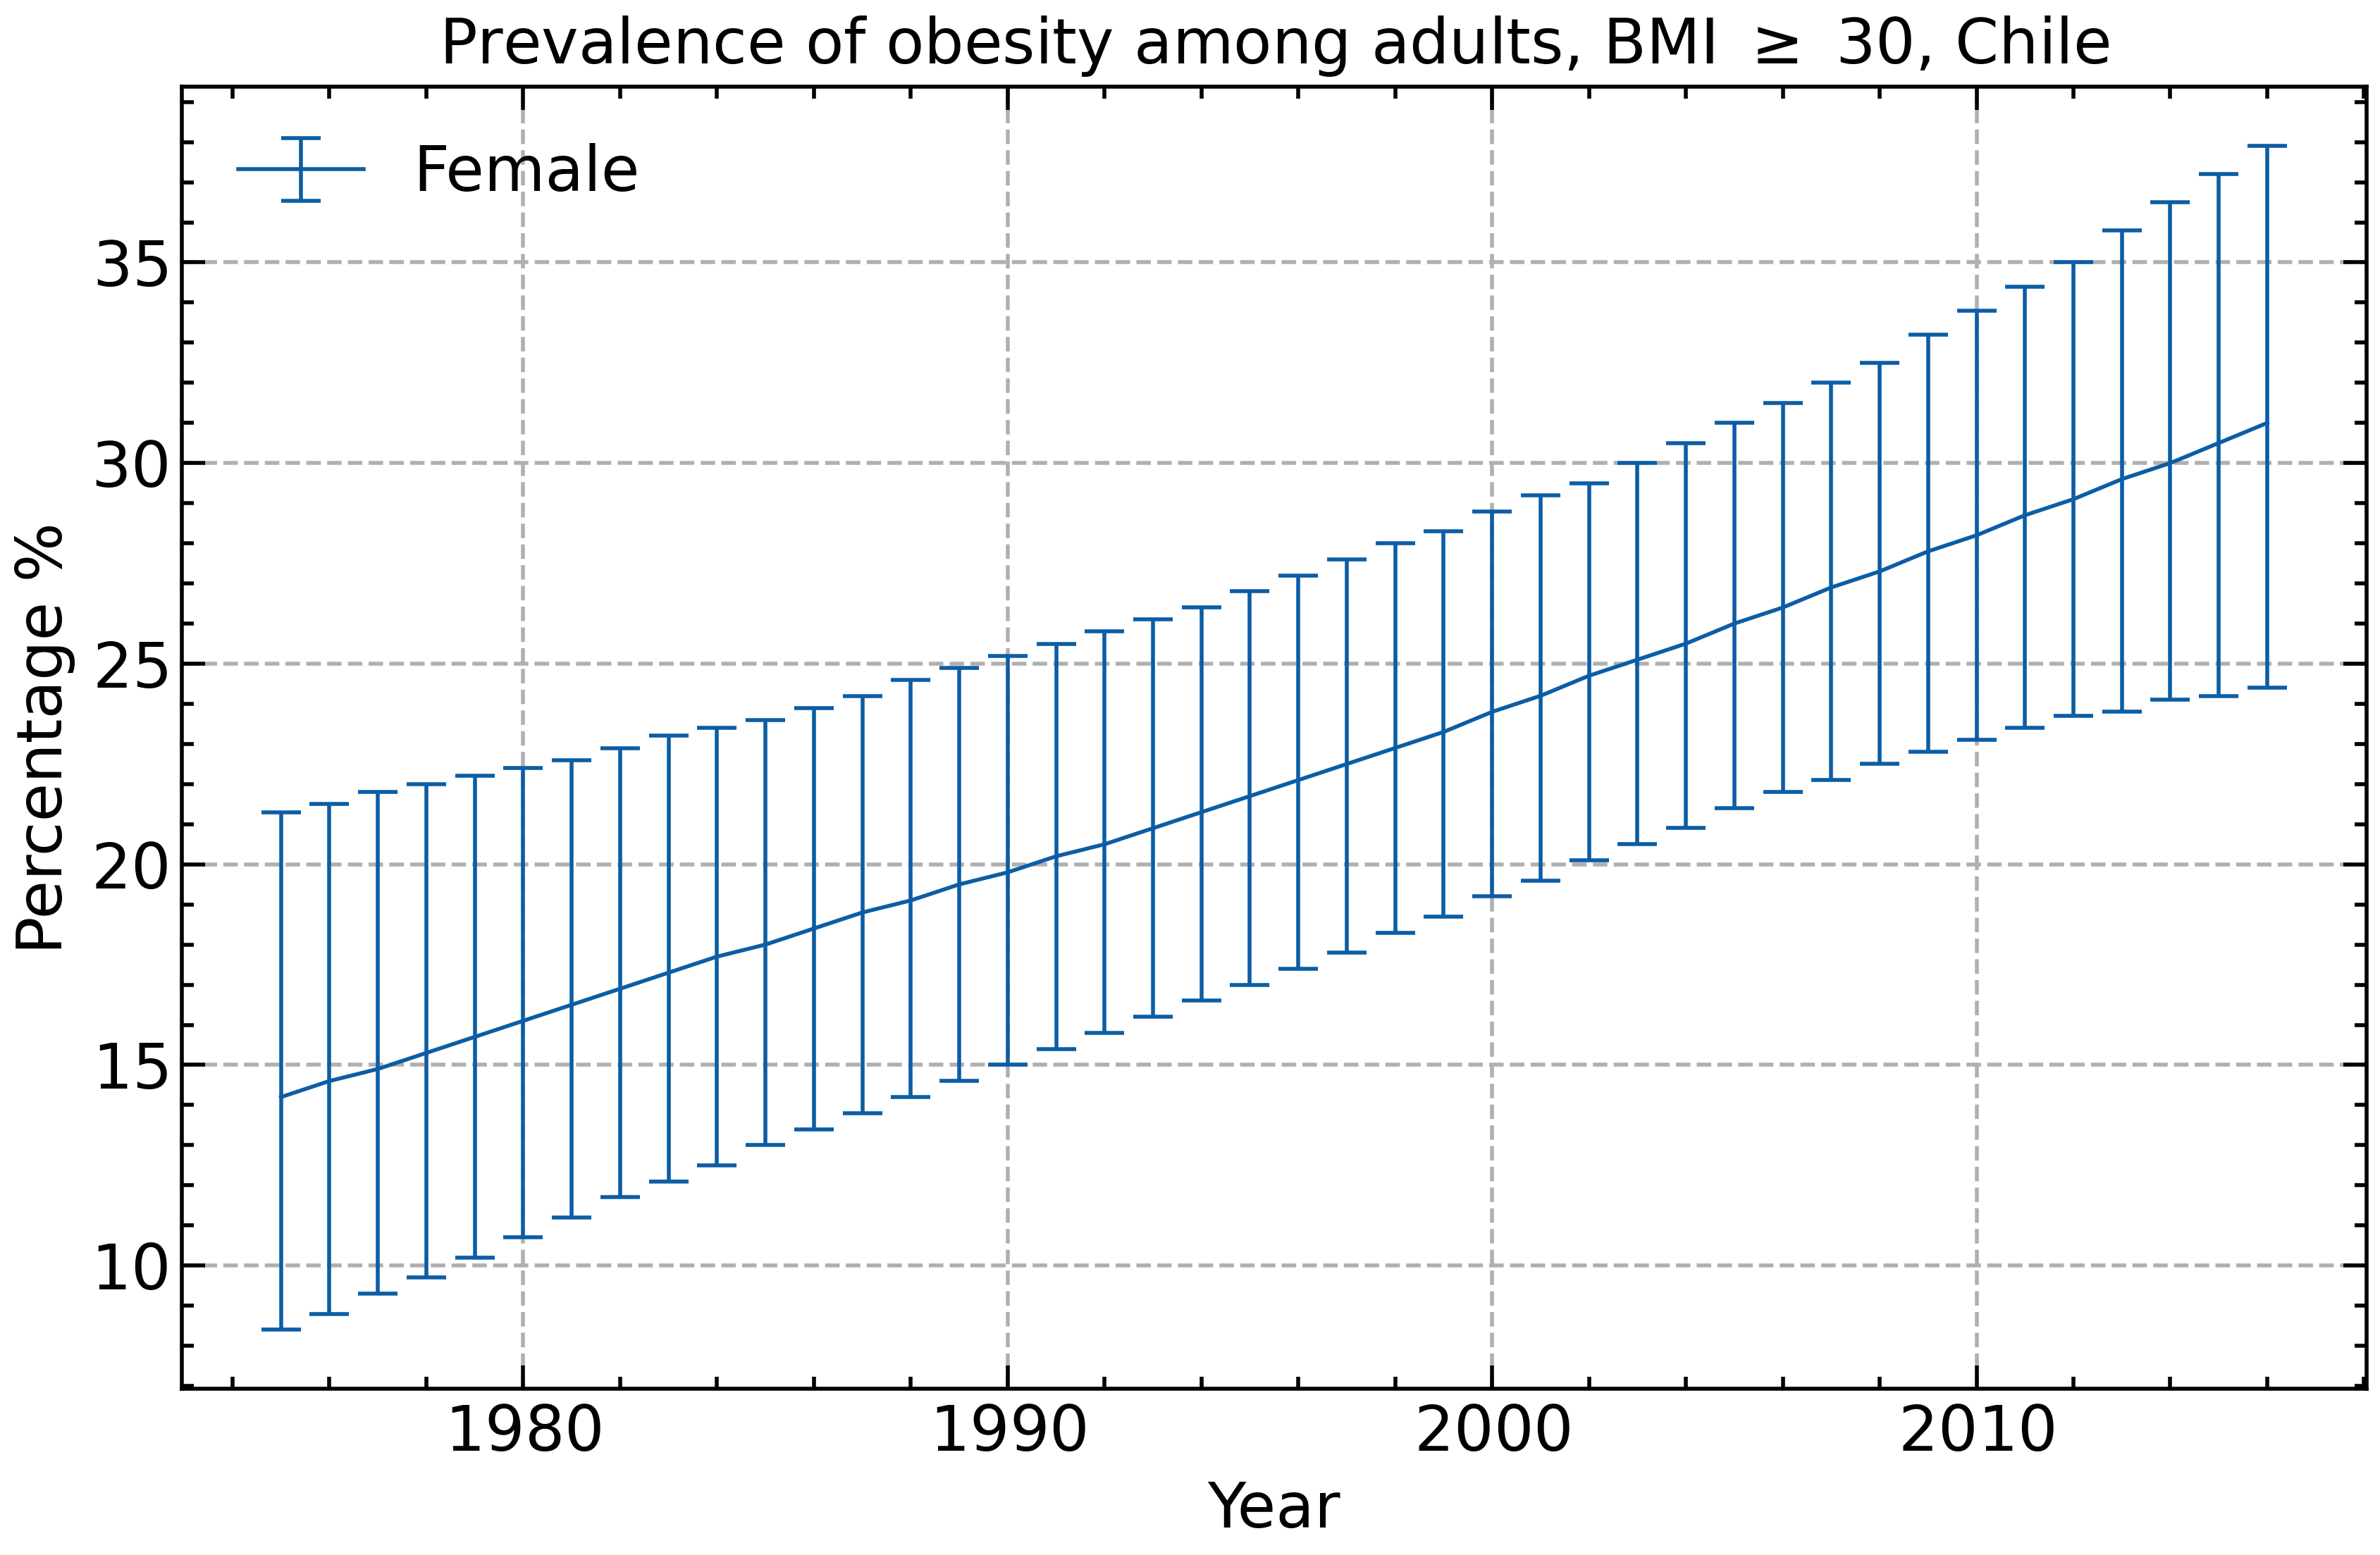
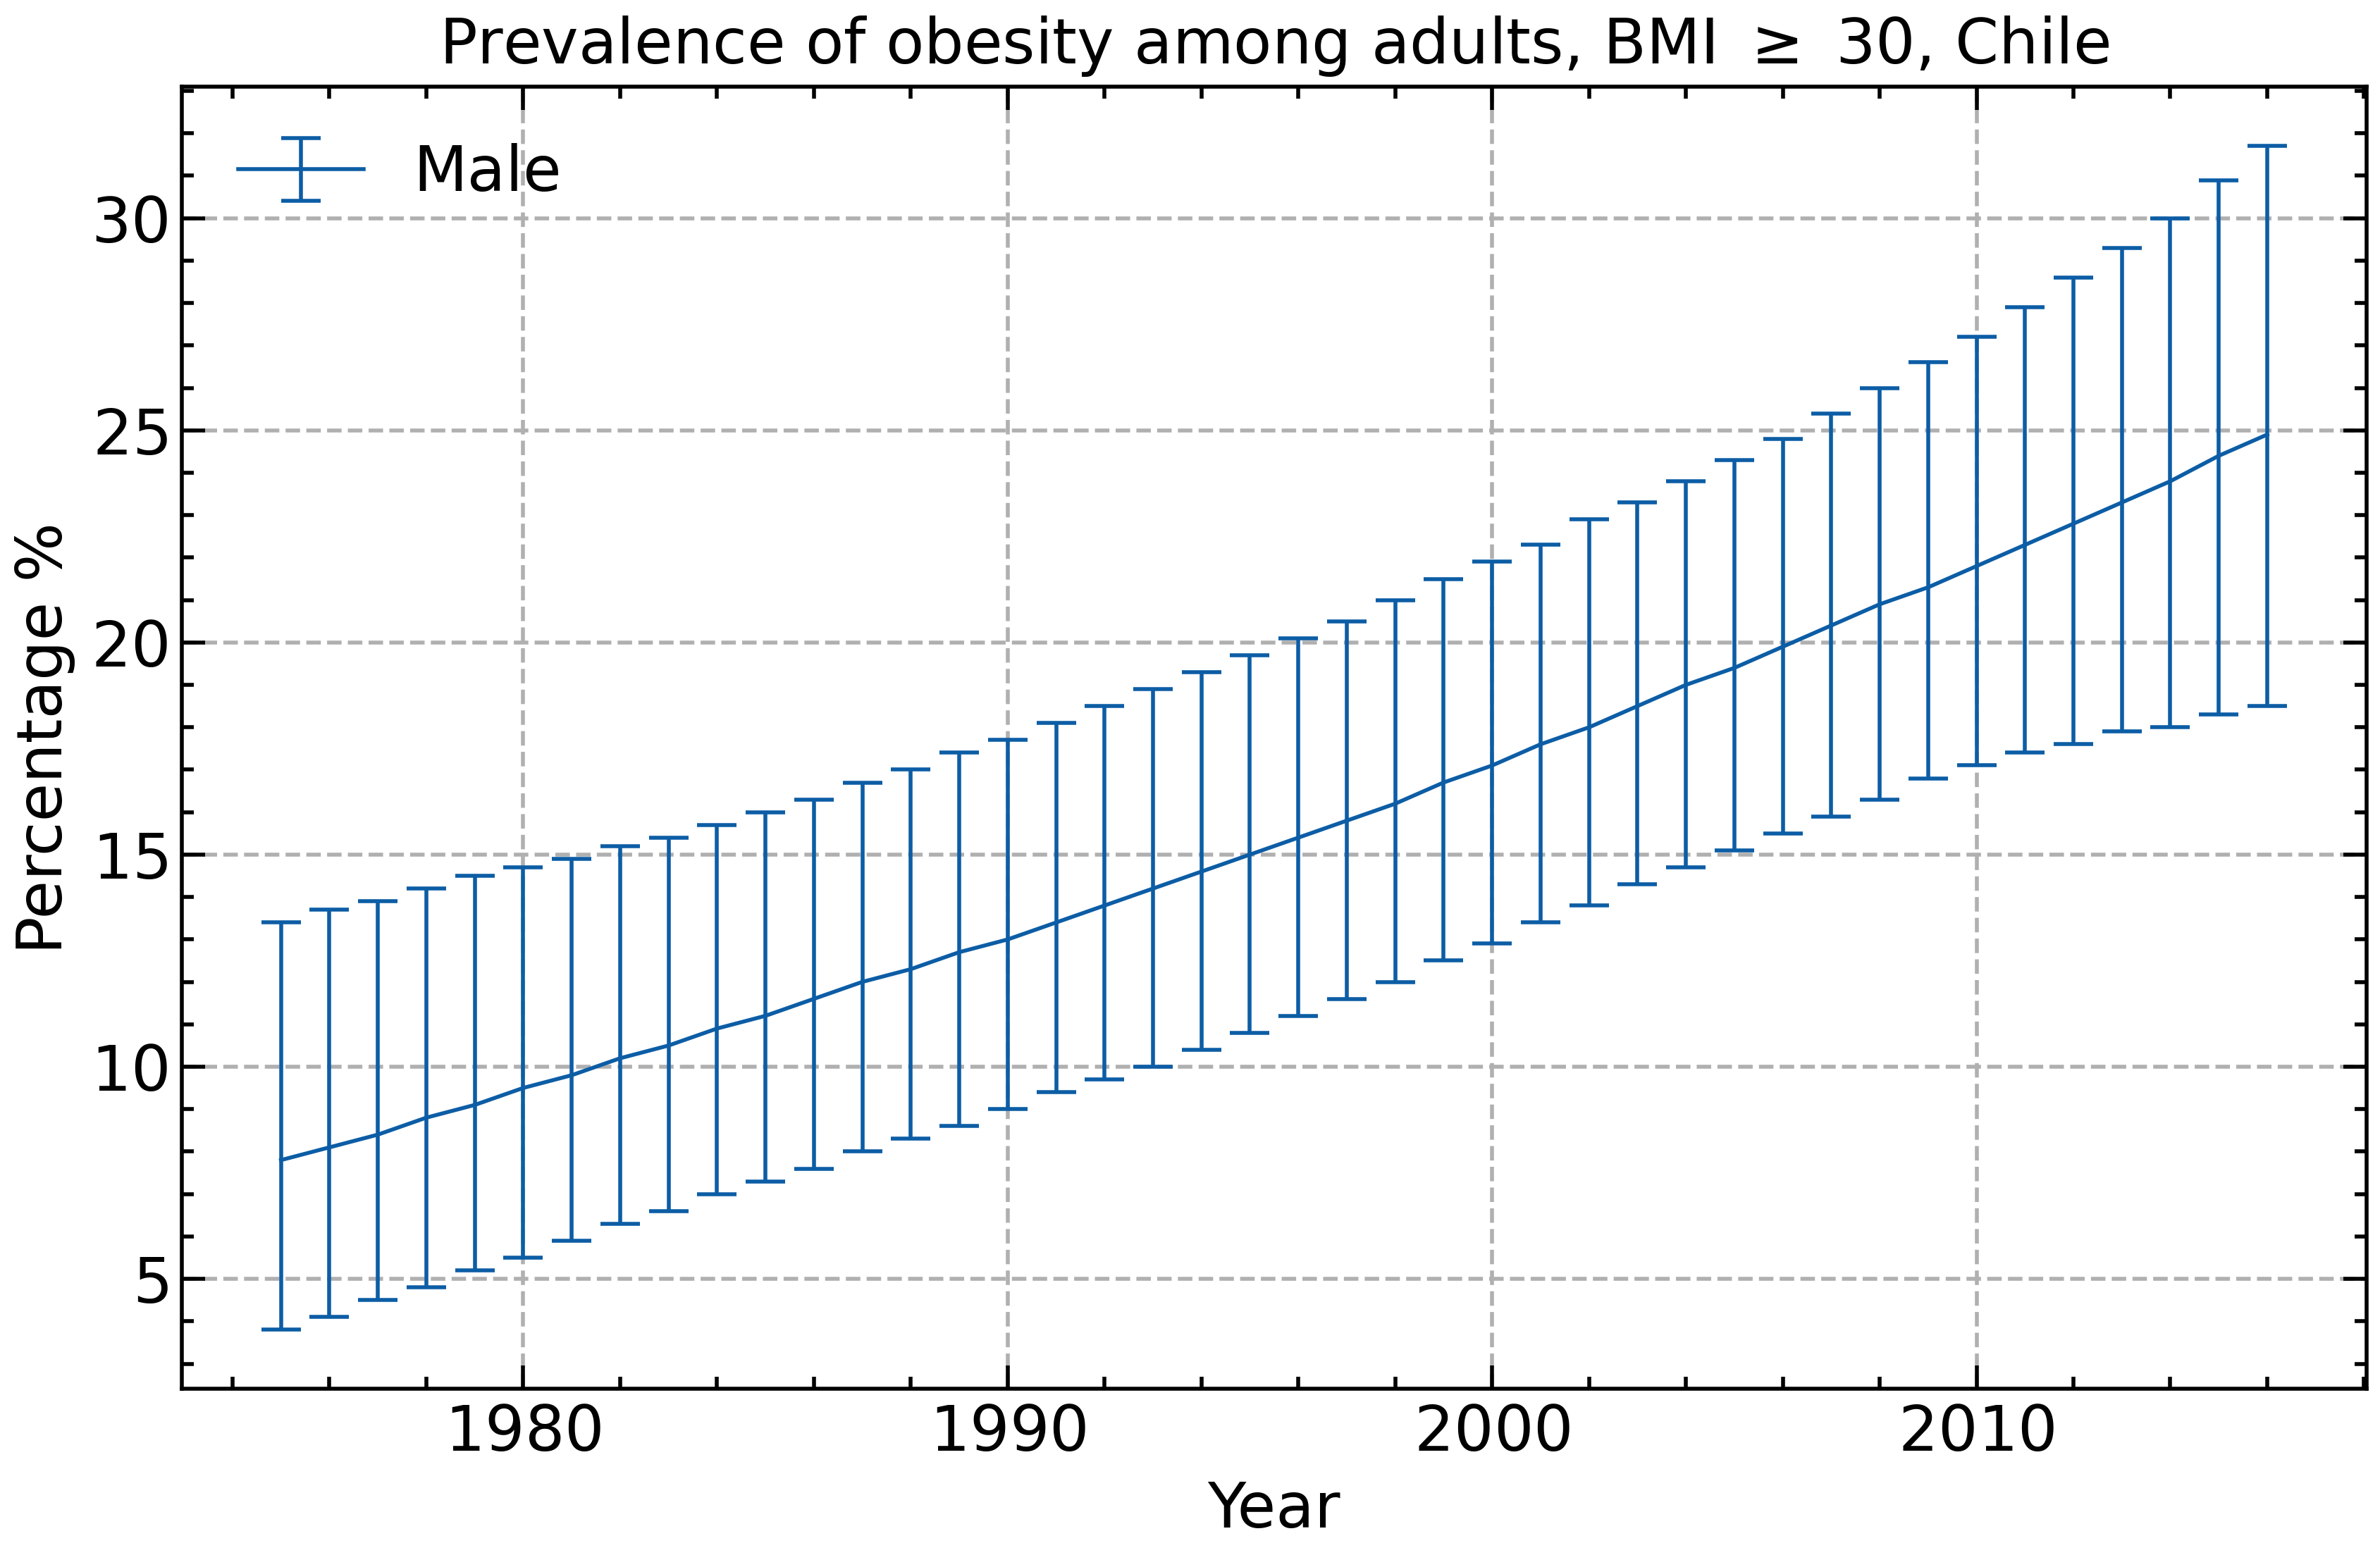
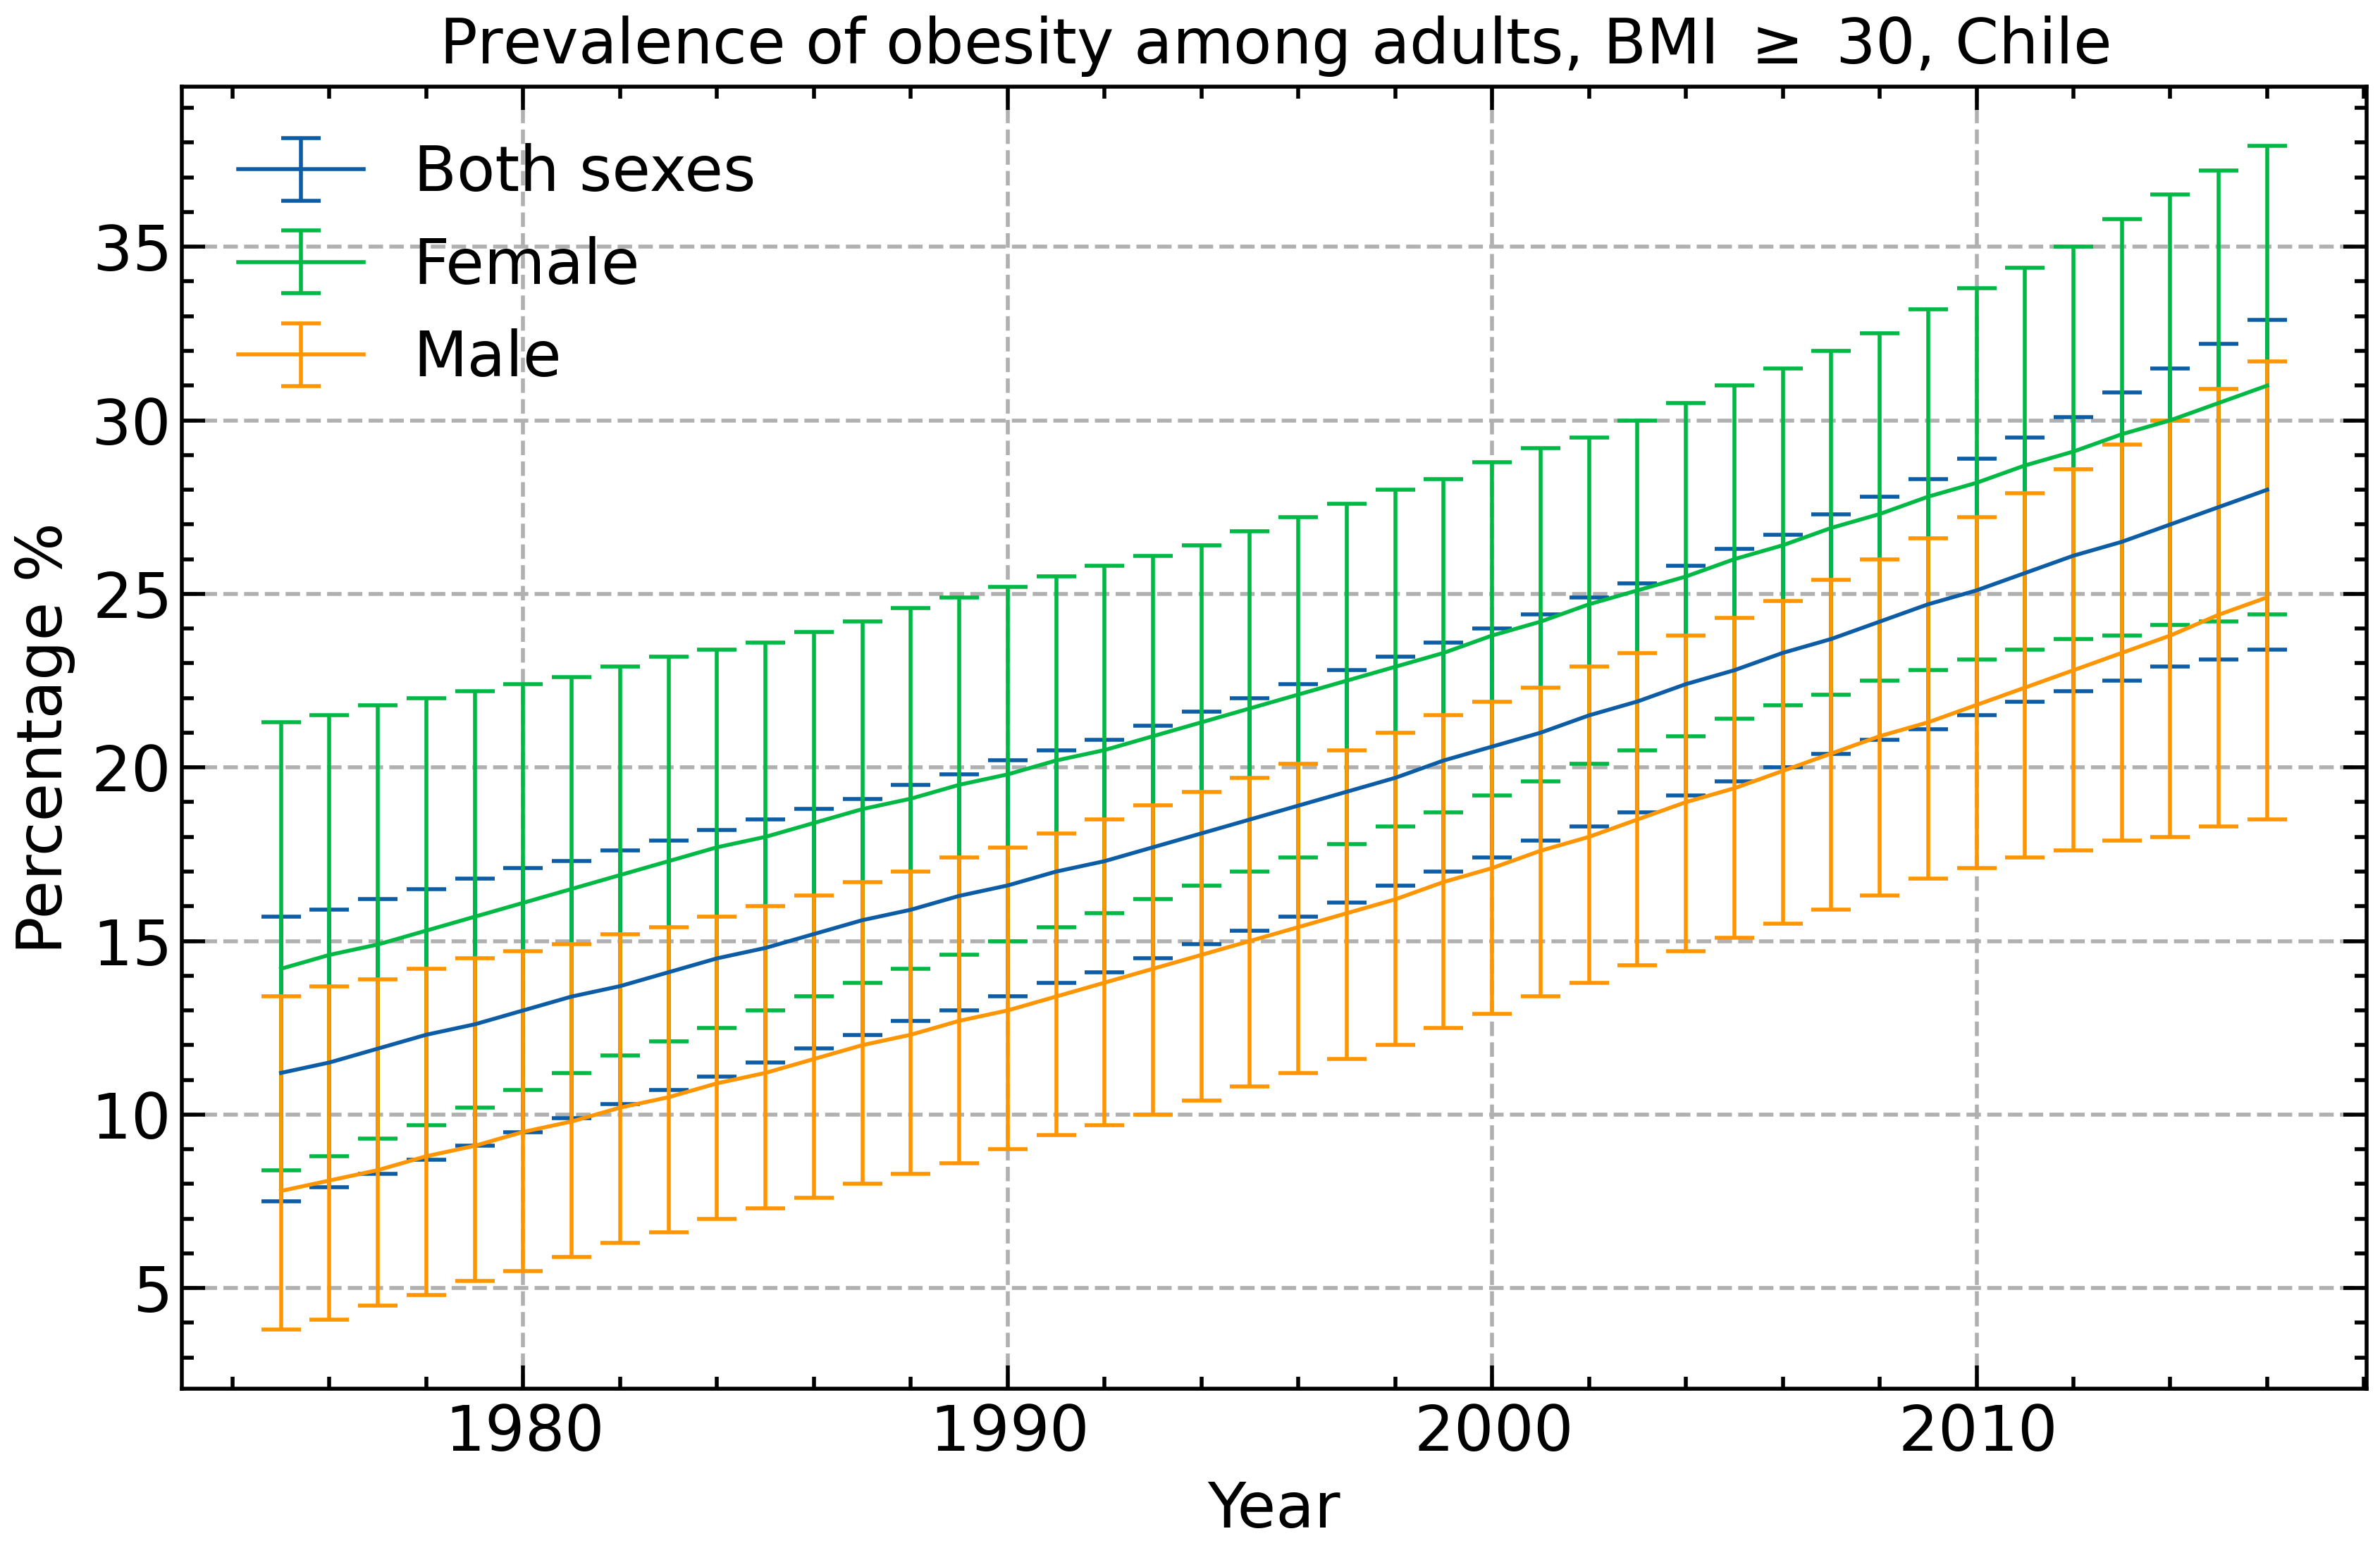
The following plots showcase the prevalence of obesity in different sexes for the specified country.
code:
import lib

csv_file = './dataset/obesity-cleaned.csv'
country = "Chile"

# To load and view the dataset
data = lib.load_dataset(csv_file, country)
print(data)

# To create plots for different sexes
lib.plot_data(csv_file, country=country, sex="Female")
lib.plot_data(csv_file, country=country, sex="Male")
lib.plot_data(csv_file, country=country, sex="all")
output files:
-
Female:
-
Male:
-
Both Sexes:


conda install -c conda-forge matplotlib numpy scienceplots