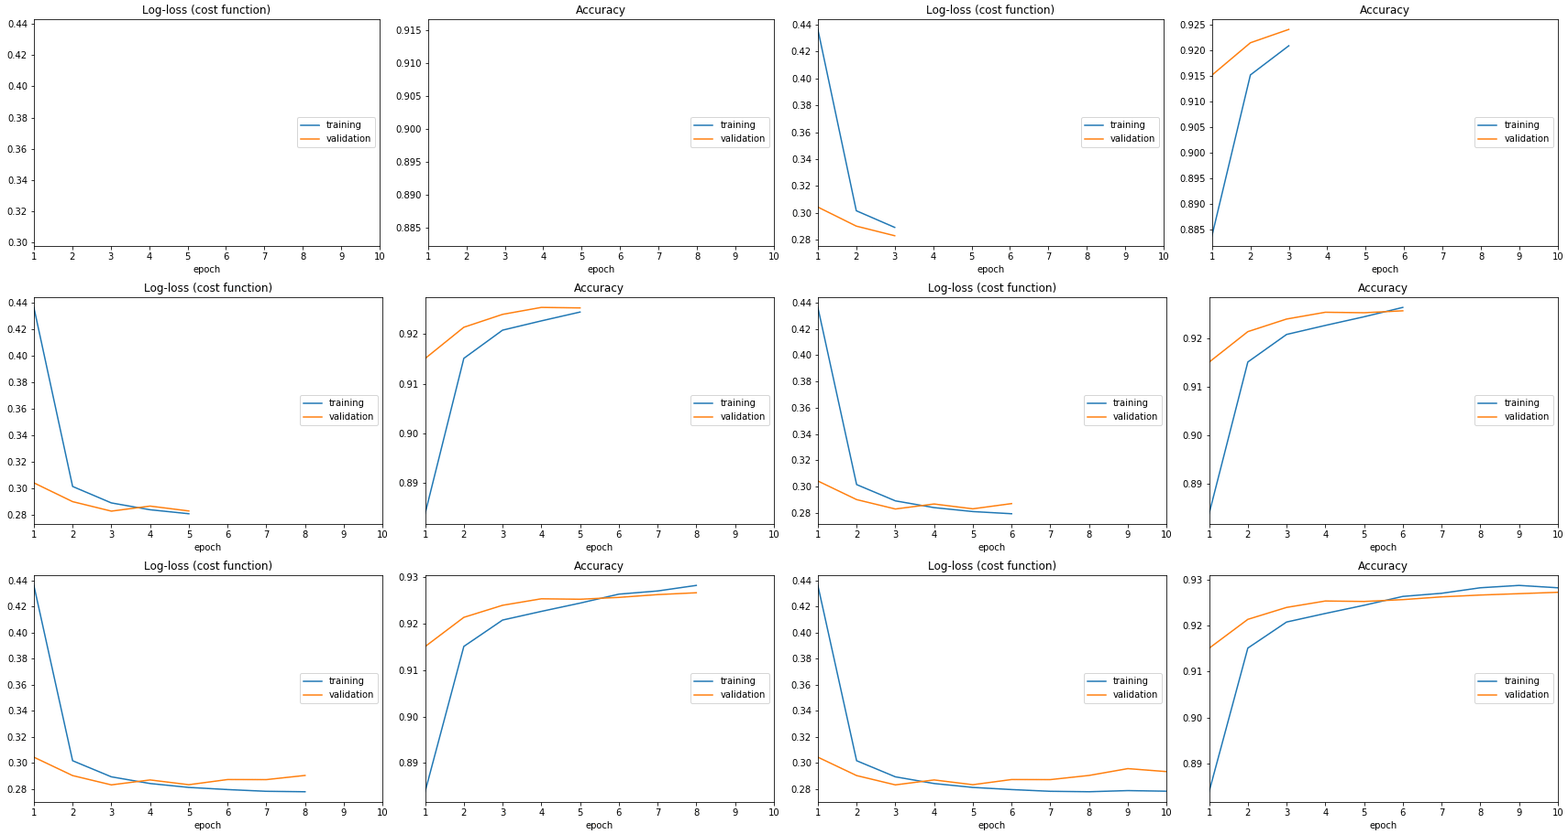
Don't train deep learning models blindfolded! Be impatient and look at each epoch of your training!
🎉 New release 0.5.0 (20 Mar 2020). See CHANGELOG and updated EXAMPLES IN COLAB. There are some API changes, to make it better, cleaner, and more modular. 🎉
A live training loss plot in Jupyter Notebook for Keras, PyTorch and other frameworks. An open-source Python package by Piotr Migdał, Bartłomiej Olechno and others. Open for collaboration! (Some tasks are as simple as writing code docstrings, so - no excuses! :))
This project supported by Jacek Migdał, Marek Cichy. Join the sponsors - show your ❤️ and support, and appear on the list! It will give me time and energy to work on this project.
from livelossplot import PlotLossesKeras

model.fit(X_train, Y_train,
          epochs=10,
          validation_data=(X_test, Y_test),
          callbacks=[PlotLossesKeras()],
          verbose=0)
So remember, log your loss!
- (The most FA)Q: Why not TensorBoard?
- A: Jupyter Notebook compatibility (for exploration and teaching). The simplicity of use.
To install this version from PyPI, type:
pip install livelossplot
To get the newest one from this repo (note that we are in the alpha stage, so there may be frequent updates), type:
pip install git+git://github.com/stared/livelossplot.git
Look at notebook files with full working examples:
- keras.ipynb - a Keras callback
- minimal.ipynb - a bare API, to use anywhere
- pytorch.ipynb - a bare API, as applied to PyTorch
- 2d_prediction_maps.ipynb - example of custom plots - 2d prediction maps (0.4.1+)
- poutyne.ipynb - a Poutyne callback (Poutyne is a Keras-like framework for PyTorch)
- torchbearer.ipynb - an example using the built in functionality from torchbearer (torchbearer is a model fitting library for PyTorch)
- neptune.py and neptune.ipynb - a Neptune.AI
Text logs are easy, but it's easy to miss the most crucial information: is it learning, doing nothing or overfitting? Visual feedback allows us to keep track of the training process. Now there is one for Jupyter.
If you want to get serious - use TensorBoard, .
But what if you just want to train a small model in Jupyter Notebook? Here is a way to do so, using livelossplot as a plug&play component
PlotLosses for a generic API.
plotlosses = PlotLosses()
plotlosses.update({'acc': 0.7, 'val_acc': 0.4, 'loss': 0.9, 'val_loss': 1.1})
plot.send()  # draw, update logs, etc
There are callbacks for common libraries and frameworks: PlotLossesKeras, PlotLossesKerasTF, PlotLossesPoutyne, PlotLossesIgnite.
Feel invited to write, and contribute, your adapter.
If you want to use a bare logger, there is MainLogger.
Plots: MatplotlibPlot, BokehPlot.
Loggers: ExtremaPrinter (to standard output), TensorboardLogger, TensorboardTFLogger, NeptuneLogger.
To use them, initialize PlotLosses with some outputs:
plotlosses = PlotLosses(outputs=[MatplotlibPlot(), TensorboardLogger()])
There are custom matplotlib plots in livelossplot.outputs.matplotlib_subplots you can pass in MatplotlibPlot arguments.
It started as this gist. Since it went popular, I decided to rewrite it as a package.
Oh, and I am in general interested in data vis, see Simple diagrams of convoluted neural networks (and overview of deep learning architecture diagrams):
A good diagram is worth a thousand equations — let’s create more of these!
...or my other data vis projects.
If you want more functionality - open an Issue or even better - prepare a Pull Request.


