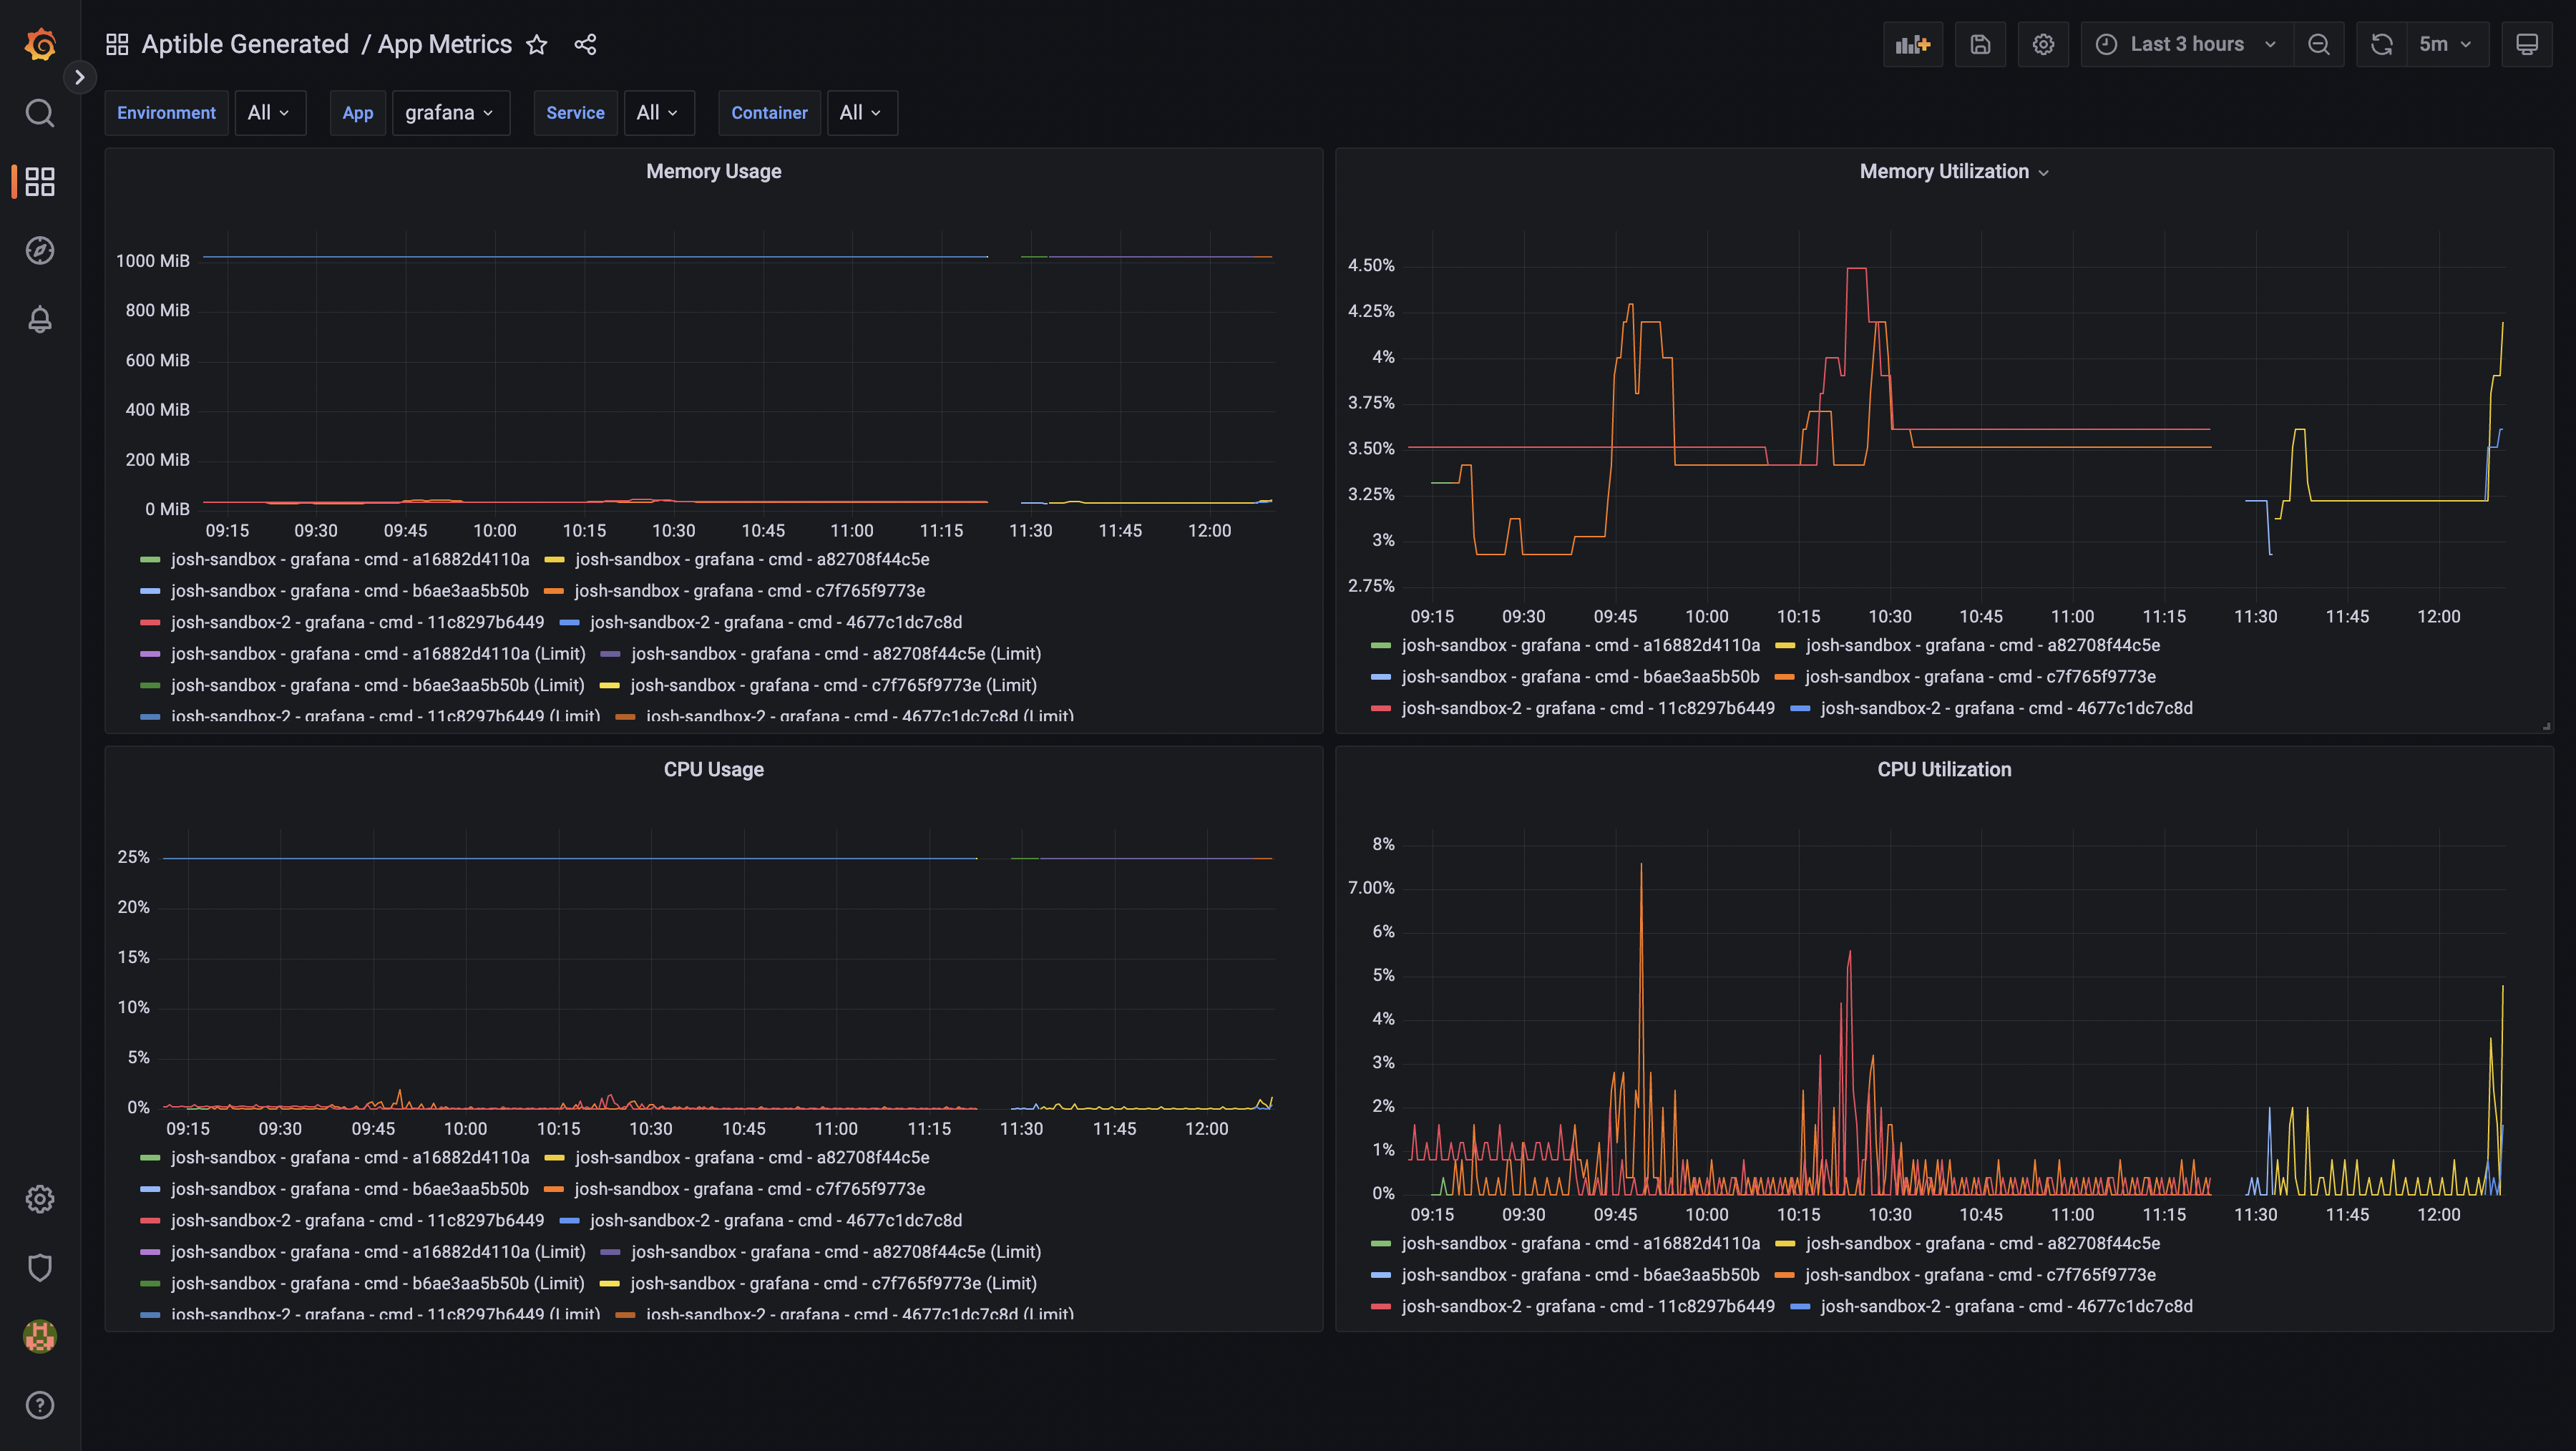
Automate provisioning and configuring the necessary resources to collect metrics for containers running on Aptible.
The Aptible CLI is required to
create the Metric Drain and its resources and you must be logged in with
aptible login. Dashboards can be generated without it if credentials and
connection details are provided via environment variables.
./create-drain-stack.sh enviroment_handleProvisions and configures an InfluxDB Database, PostgreSQL Database, Grafana
App, and InfluxDB Metric Drain in the specified Environment if they do not
exist. If the Grafana App doesn't exist ./generate-dashboards is run on it.
METRICS_ENVIRONEMNT can be used to specify a different environment for the
InfluxDB Database, PostgreSQL Database, and Grafana App. This can be used to
configure multiple environments to send metrics to the same destination. For
example:
Note: This repo was tested against Grafana version 9.0.2. The version can be
changed by setting GRAFANA_TAG. The default is latest.
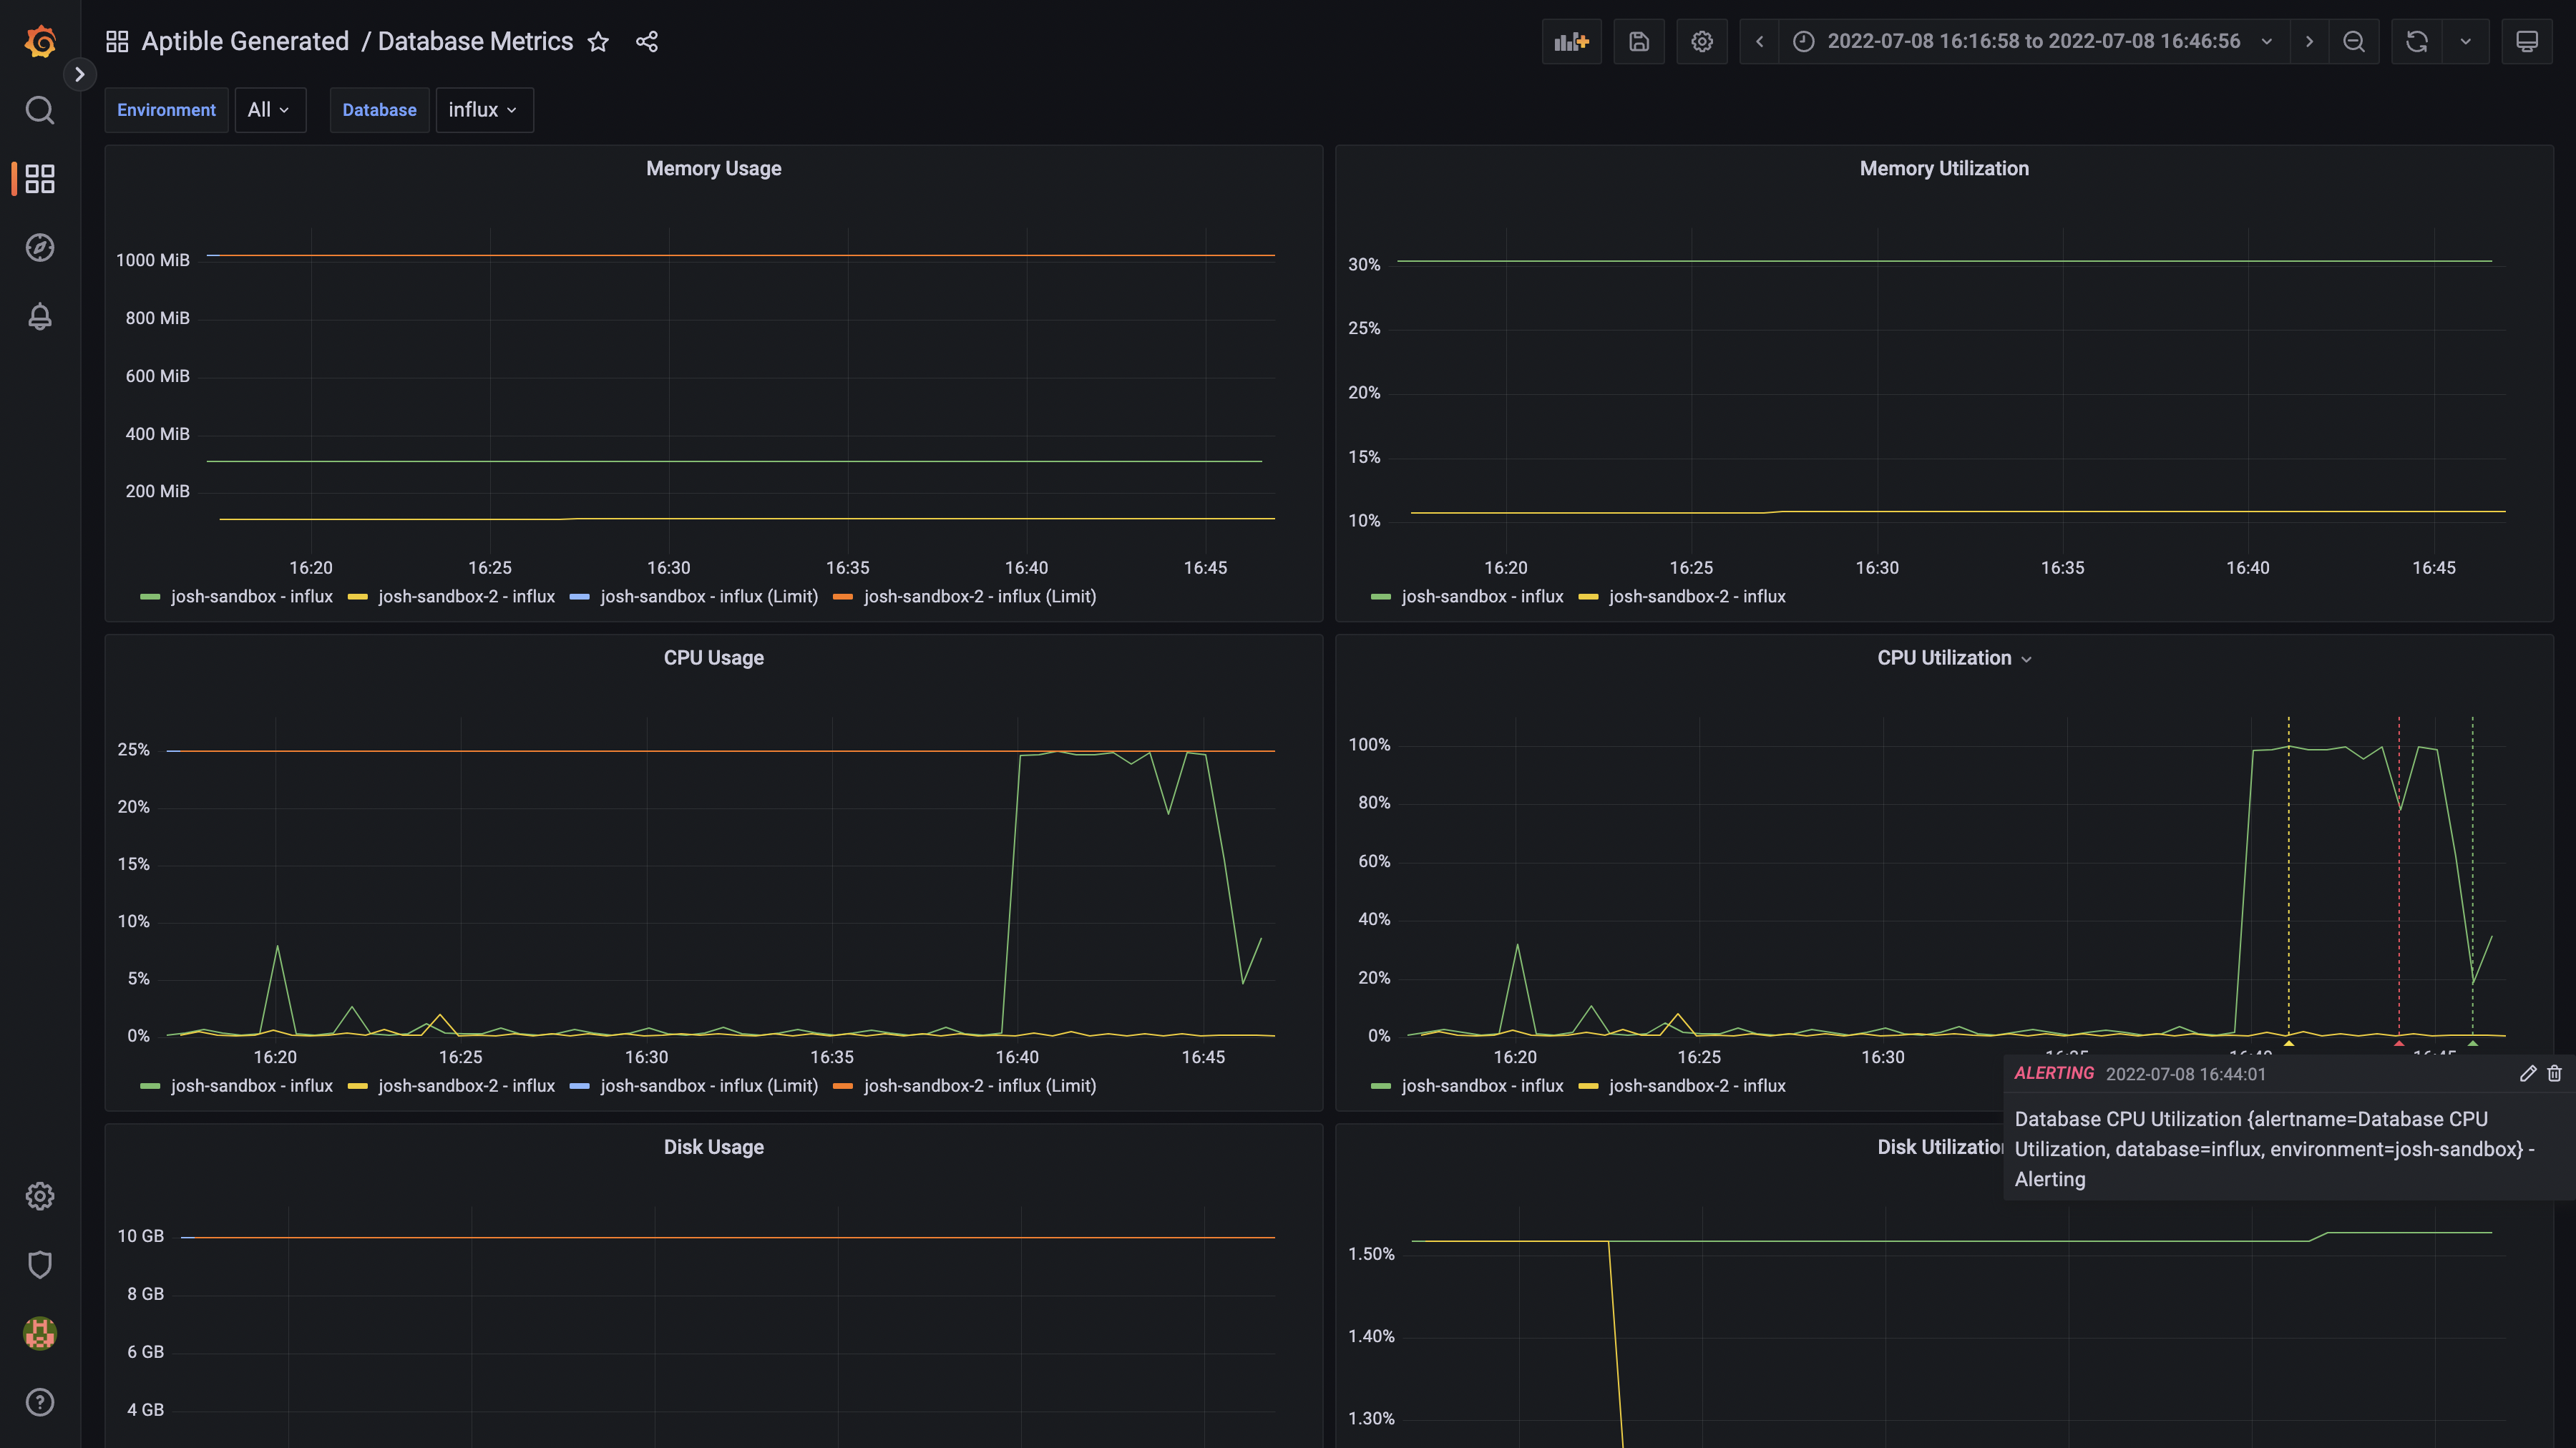
./generate-dashboards.sh [environment_handle] [grafana_handle=grafana]Creates a set of useful dashboards for the metrics provided by Metric Drains (or
updates them if they already exist). All of the dashboards defined in
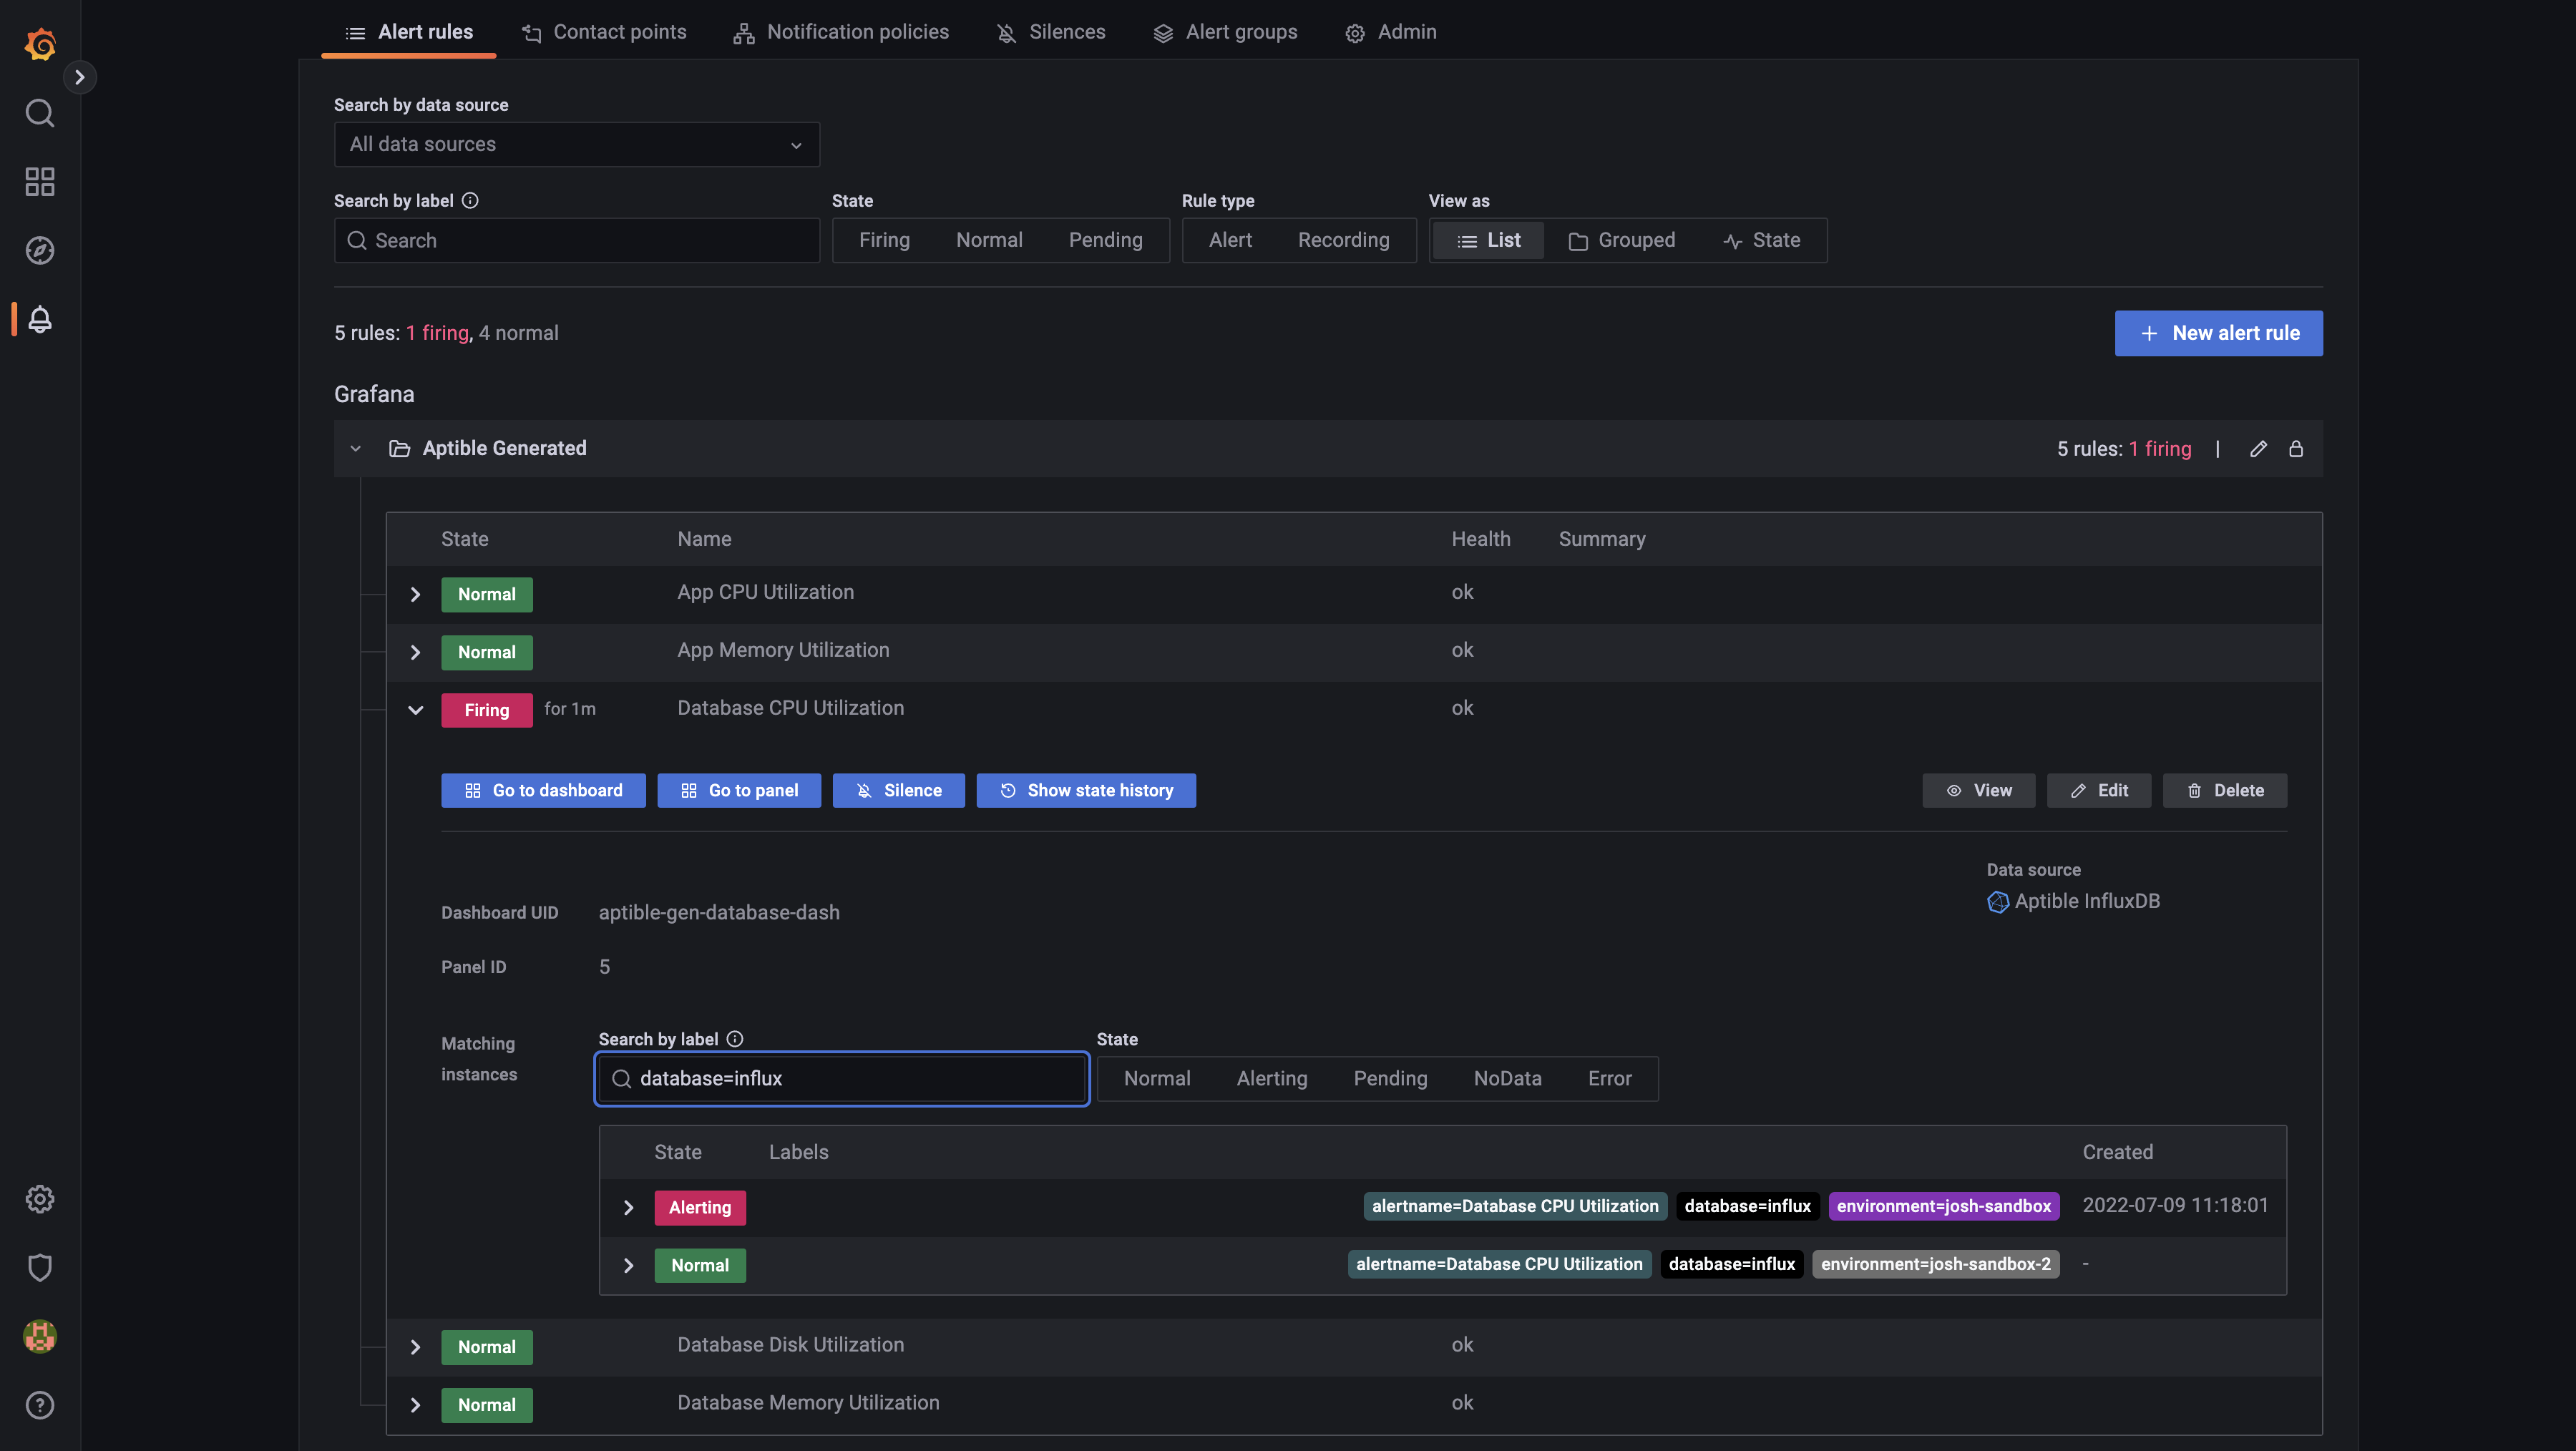
grafana/dashboards will be applied. Also creates alert rules for resource
utilization if they don't exist.
The credentials and connection details for Grafana are extracted from the
specified Aptible App's configuration or they can be supplied through the
GRAFANA_USER, GRAFANA_PASSWORD, and GRAFANA_URL environment variables.
./recreate-alerts.sh [environment_handle] [grafana_handle=grafana]Unfortunately it's not quite as easy to update alert rules as it is dashboards so this script deletes the existing ones and re-creates them. The only downside of this is that the alert rule state history is cleared. The Dashboard will show the past alerts and alert notifications that have been sent out will still exist.
This script handles credentials and connection details the same way as
generate-dashboards.sh. See above for details.
This repo does not configure alert notifications but they can be configured relatively easily through the Grafana UI. All you need to do is:
- Create a contact point such as an email list or Slack integration at Alerting
> Contact points (
https://$GRAFANA_URL/alerting/notifications). - Add the contact point to a notification policy at Alerting > Notification
policies (
https://$GRAFANA_URL/alerting/routes).
The generated alert rules are labeled with alertgroup=aptible-generated so
this can be used to create a specific policy for these alerts.
/create-drain-stack.sh aptible-productionexport METRICS_ENVIRONMENT=aptible-metrics
./create-drain-stack.sh aptible-production
./create-drain-stack.sh aptible-staging
./create-drain-stack.sh aptible-dev/generate-dashboards.sh aptible-production

