This project is the weekly challenge for week 18 of the Data Science Bootcamp. It allows us to put into practice and showcase the skills learned in Module 18 of the bootcamp: Unsupervised Machine Learning.
Create an analysis for clients who are preparing to get into the cryptocurrency market. The analysis includes cryptocurrencies on the trading market and how they could be grouped to create a classification system. To reduce overfitting, Principal Component Analysis (PCA) was used.
This project had of 4 deliverables:
- Deliverable 1: Preprocessing the Data for PCA
- Deliverable 2: Reducing Data Dimensions Using PCA
- Deliverable 3: Clustering Cryptocurrencies Using K-means
- Deliverable 4: Visualizing Cryptocurrencies Results
Files:
-
crypto_clustering.ipynb : Jupyter Notebook file with Python Analysis
-
crypto_data.csv : data file retrieved from CryptoCompare
The dataset was loaded from the source file and transformations were done to prepare the data for PCA.
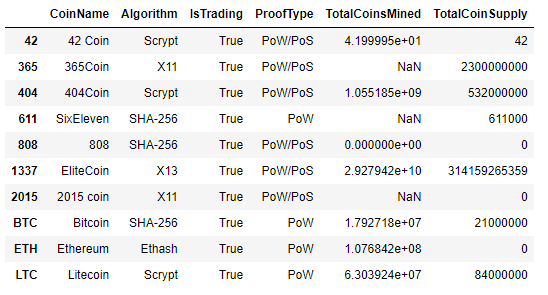
The initial dataframe looked like this:
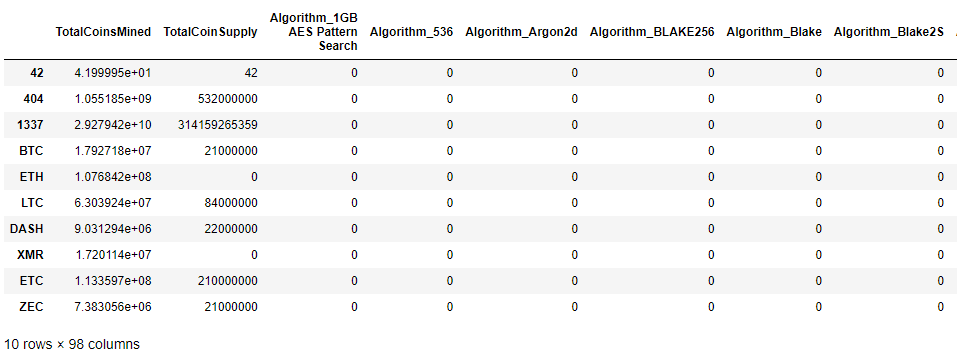
After cleaning operations, the dataframe had this look:
This final dataframe was the scaled using the code below to be ready for the next deliverable:
# Standardize the data with StandardScaler().
scaler = StandardScaler()
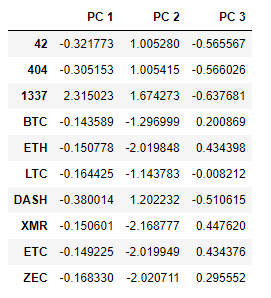
crypto_scaled = scaler.fit_transform(crypto_encoded_df)Reduced the dimesions of the crypto_scaled dataset to 3 principal components.
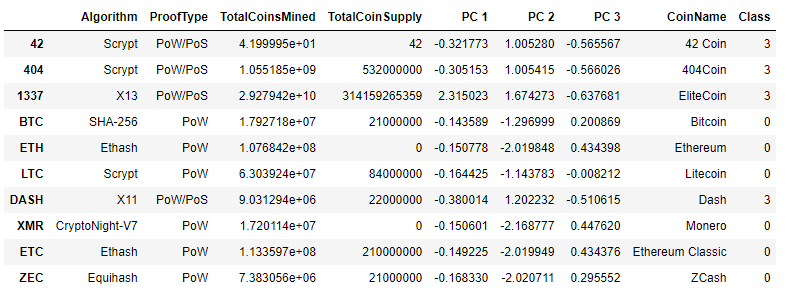
The pcs_df dataframe was created as required.
pca = PCA(n_components=3)
crypto_pca = pca.fit_transform(crypto_scaled)
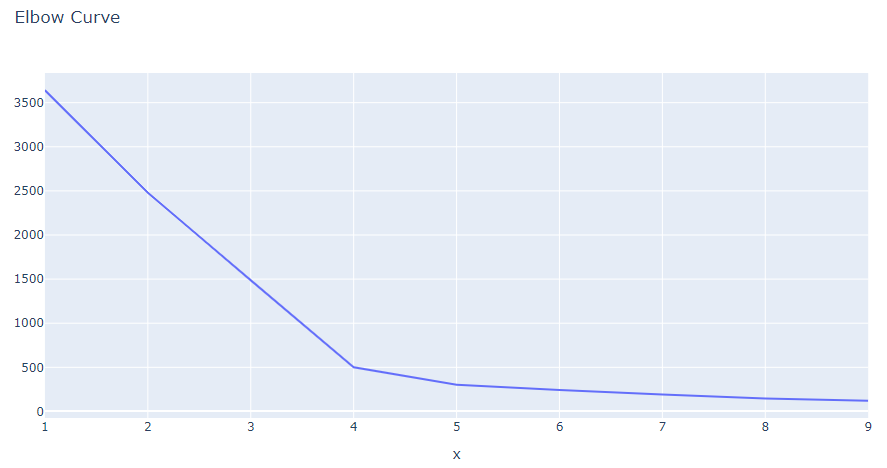
pcs_df = pd.DataFrame(data=crypto_pca, columns=['PC 1','PC 2', 'PC 3'], index=crypto_encoded_df.index)Created an elbow chart to find the best value for K from the pcs_df dataframe from the previous deliverable.
Then I ran the K-means algorith with 4 clusters to predict the clusters for the data.
A dataframe with all the data clustered_df was created.
clustered_df = pd.concat([crypto_df,pcs_df, cryptonames_df], axis=1)
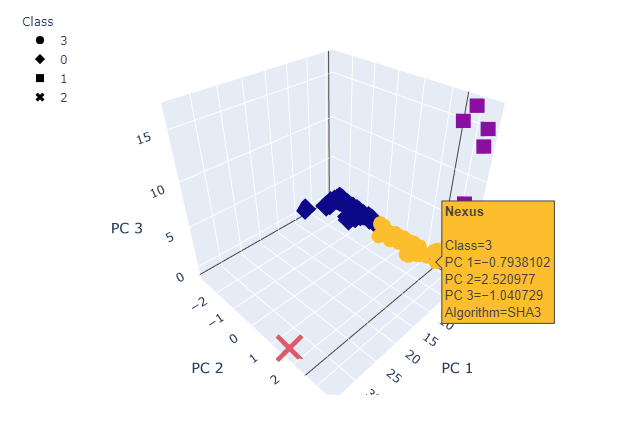
clustered_df['Class']= predictionsVisualized the clusters that correspond to the 3 principal components with a 3D scatter chart.
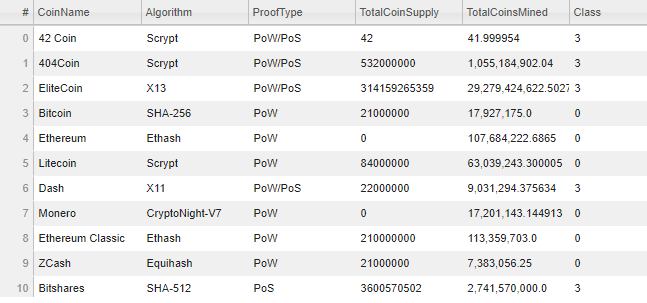
Also created a table using the hvplot.table functionality.
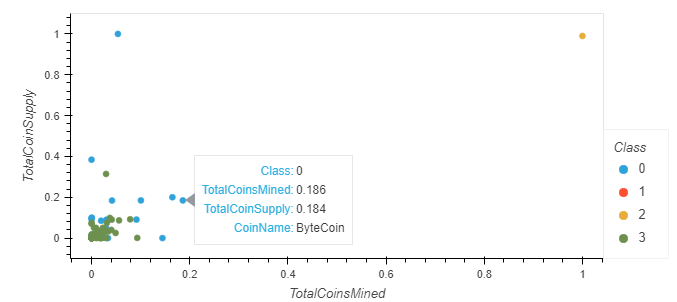
The looked at the relationship between Total Coin Supply and Total Coins Mined by scaling those variables and plotting them on a scatter chart.
We provided the client with a list of cryptocurrencies being traded and classified them into 4 clusters.
