Hello future hackathon attendee! Thanks for dropping by a little early. This repo is still being developed. If you fork the repo before the day of the event (March 14th), you will likely need to sync your fork so you have the latest copy.
Feel free to poke around! And if you spot typos, please open an issue or a pull request.
Sign up for the hackathon if you haven't already. We are sold out. Please sign up for the waitlist.
See you all on March 13/14!
Welcome to the 7th UBC Learning Analytics hackathon! This hackathon is really a workshop, so we're going to be referring to it as a workshopathon from here on out.
This repo contains the basic backend and frontend components of the Student Dashboard application you will be building. By the end of this workshopathon, you should have a working web application that displays your own Canvas data using the Canvas API.
We will also provide other data sources that you are welcome to integrate to build more advanced tools and visualizations.
Due to the compressed nature of this workshopathon, we'll be covering a lot of ground in not a lot of time. You don't need to fully understand everything. There are lots of links to external readings and tutorials within Tasks that you're welcome to explore. And remember that this repo will always be a resource you can access in the future (so give it a star)!
Sign up for the hackathon if you haven't already. We are sold out. Please sign up for the waitlist.
- What You'll Learn
- What You'll Build
- Ask For Help
- Schedule
- Getting Started
- Code Overview
- Tasks
- Project Showcase
- Organizers
- Contributors
By completing this workshopathon, you'll learn to:
- use the Canvas API
- explore the data that Canvas collects from you
- write some code in JavaScript
- learn the difference between the backend and frontend
- clean data
- build your own API endpoints
- use React to build frontend components
- build a modern web application
You'll be building a web application that displays a heatmap of what days of the week and what time of the day you and your peers (and your instructor) are most actively posting in the discussion forum of a course.
It should look something like this:

After you've completed the heatmap, you can either add more features to the heatmap or use the tons of data we provide to build entirely new tools and visualizations.
We don't expect you to come into the workshopathon with any prior knowledge. You may never have coded before - that's okay! You're here to learn, and we're here to help.
There are many volunteers here with lots of software development experience who are happy to help.
And if you're already comfortable with some of the technology we're using, please help your neighbours!
- 5:00pm - Design Thinking Workshop.
- 6:30pm - Social (pizza and pop).
- 9:30am - Doors Open (coffee and pastries).
- 10:00am - Introductions and Welcome to the Workshopathon! We'll give you an overview of the tasks and get you set up with this repository.
- 10:15am - Start hacking!
- 12:30pm - Lunch.
- 1:00pm - Check-in.
- 3:00pm - Check-in.
- 4:30pm - Demos!
- 5:30pm - End of Workshopathon.
These instructions will get you a copy of the project up and running on your local machine for use with your own Canvas API tokens.
- Install Node 12.0.0 or greater.
- Install Git.
- Install Visual Studio Code (optional but recommended).
- Install Brave or Firefox, since Chrome is spyware (optional but recommended; the volunteers are more familiar with using the devtools of Brave or Firefox).
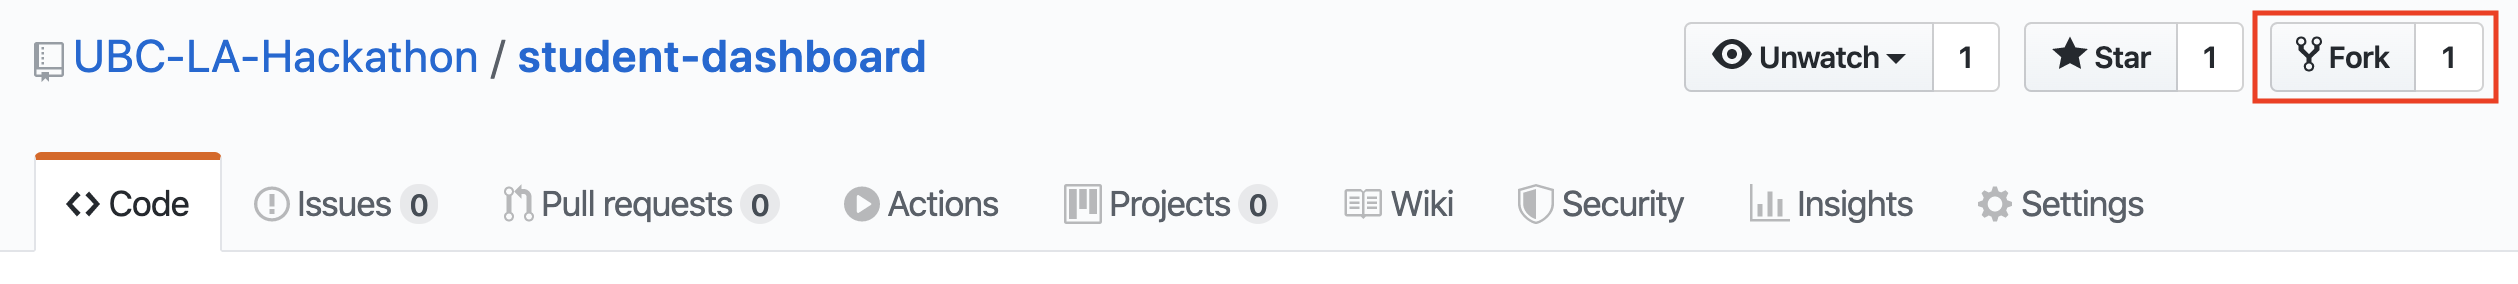
- Fork this repo.
- Copy clone link.
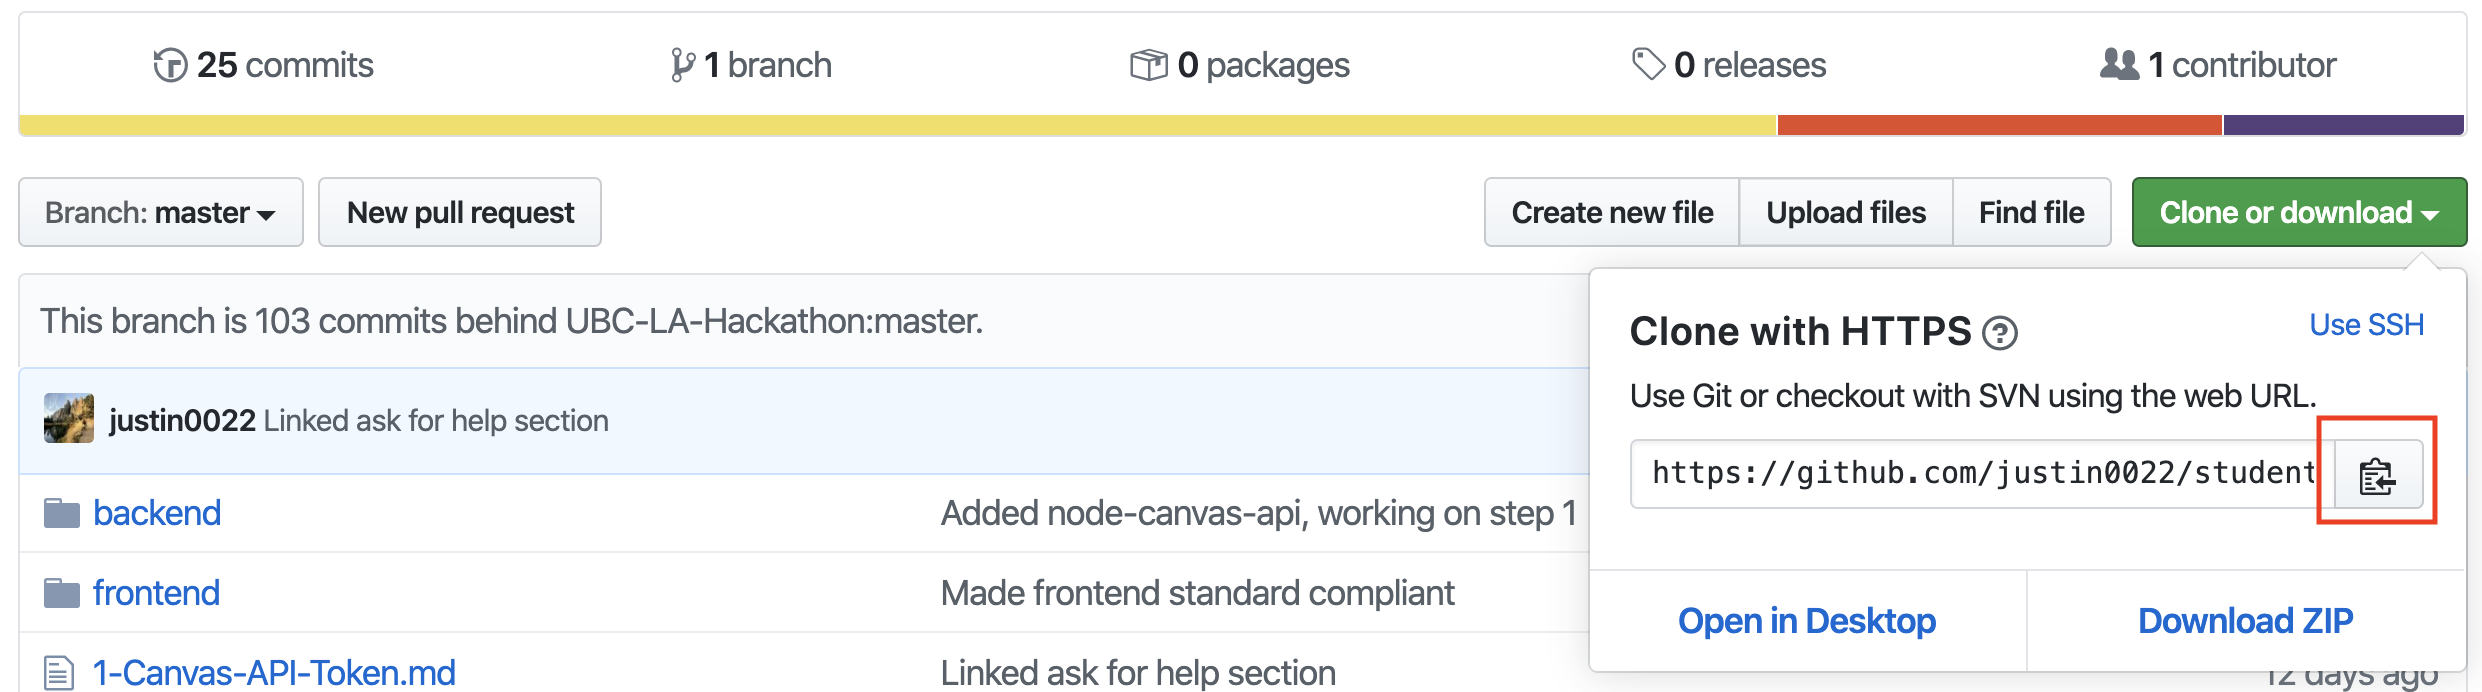
- Open terminal on Mac or command line on Windows. We like to use VSCode's integrated terminal, as it works for both Mac and PC.
- Clone repo.
git clone {paste URL you copied} - Navigate into repo.
cd student-dashboard


- Navigate into
backendrepo.cd backend - Install required dependencies.
npm install - Start server.
npm start - In terminal, you should see
Example app listening on port 4001!.
- Navigate into
frontendrepo.cd frontend - Install required dependencies.
npm install - Start frontend application.
npm start - Your browser should start. If not, navigate to http://localhost:3000/. You should see
Welcome to the Workshopathon, attendee!.
- nodejs - JavaScript runtime.
- expressjs - A framework for building our server's API endpoints.
- cors - A middleware to enable Cross-Origin Resource Sharing.
- node-canvas-api - Easy way to make calls to Canvas API using JavaScript.
- neat-csv - Simple way to read CSV files.
- reactjs - JavaScript library for building user interfaces.
- Victory - React components for easily building data visualizations.
- D3.js - The de facto way to build data visualizations on the web, somewhat painfully.
 Our web application will involve three autonomous entities (two of which we build):
- a frontend React application
- a backend Node.js/Express application
- the Canvas API (accessed through node-canvas-api)
These three entities run independently but communicate with one another by exchanging data via API endpoints. Our Node backend will be responsible for querying the Canvas API, processing the data returned, and hosting that data at API endpoints (that we create) for our frontend application to read and render to the browser.
server.js- The entry point into our backend code. It starts the express server and is responsible for handling requests the frontend makes, making requests to the Canvas API, and reading/sending data to the frontend.canvasDiscussions.js- Exports two functions,getDiscussionsandflattenTopicAndReplies. The first takes as input a Canvas course id and pulls discussions from that course in a way that preserves the threaded nature of replies to discussion topics. The second flattens the topics and replies to make it easier for generating the heatmap.readCSV.js- Simple utility for reading CSVs painlessly. Takes as input the path to the CSV.
App.js- The top-level React component that is responsible for rendering theDiscussionandHeatmapcomponents.Discussion.js-Discussionfetches discussion data, cleans it, and passes it down to the child componentHeatmap.Heatmap.js- Renders the heatmap using D3.js.Welcome.js- Renders a simple welcome message with the Canvas user's name, if available.
- Create a Canvas API token and make calls to the Canvas API
- Create API endpoints in backend
- Make API calls from frontend to frontend
- Create data visualization dashboard
- Create a dropdown to switch between classes
- Create more advanced data visualizations/tools
- Share your work
- Feedback and thanks
At the end of the workshopathon, you can put a link to your work here!
This hackathon is a collaborative effort by the UBC Learning Analytics project, LAVA (Learning Analytics, Visual Analytics), and Sauder Learning Services, with staff volunteers from Faculty of Arts, Faculty of Education, Sauder School of Business, and the Centre for Teaching, Learning and Technology.
A big thank you to Sauder Learning Labs for providing a space designed to facilitate teams in using critical thinking and analytical decision making to solve real-world problems.
And another big thank you to our volunteers and contributors.


This project follows the all-contributors specification. Contributions of any kind welcome!