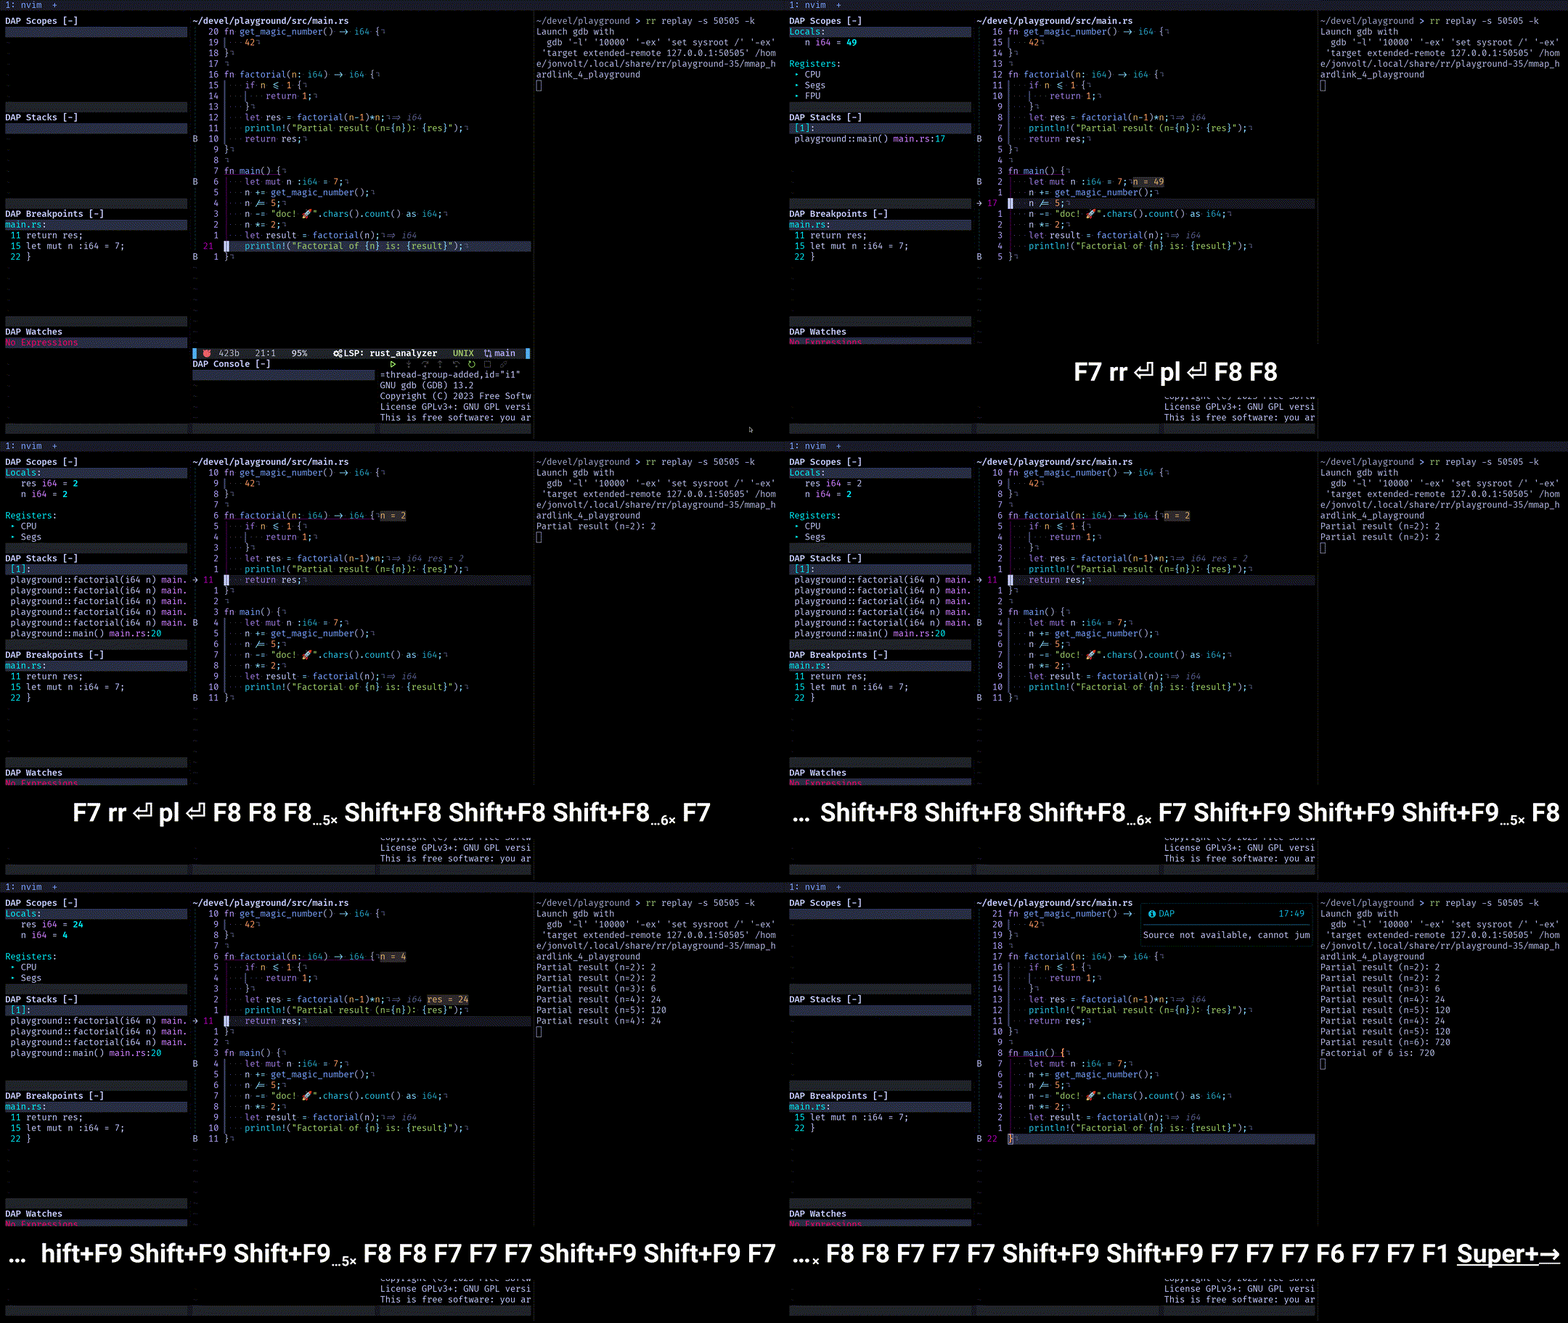
An extension for nvim-dap to generate ready to go rr dap configurations.
The rr debugger allows you to record an execution and later replay it. In replay mode you get deterministic execution, and the ability to "time travel" in your debugging, going backwards and forwards tracking the state of your program.
With this plugin you can connect to a replay session and debug it as any other DAP compatible debugger.
Requirements:
- A reasonably modern neovim (tested on v0.9.2, but older versions should work as well)
- rr (tested on 5.6.0)
- cpptools
- mason.nvim makes the installation trivial (see minimal configuration)
You can skip these next dependencies if you provide an alternative program picker, see Debugger Configuration but they are required by default:
You don't need nvim-dap-ui to run nvim-dap-rr, but if you want a debugger UI it is a good default.
Lazy.nvim:
{"jonboh/nvim-dap-rr", dependencies = {"nvim-dap", "telescope.nvim"}},local dap = require('dap')
-- point dap to the installed cpptools, if you don't use mason, you'll need to change `cpptools_path`
local cpptools_path = vim.fn.stdpath("data").."/mason/packages/cpptools/extension/debugAdapters/bin/OpenDebugAD7"
dap.adapters.cppdbg = {
id = 'cppdbg',
type = 'executable',
command = cpptools_path,
}
-- these mappings represent the maps that you usually use for dap. Change them according to your preference
vim.keymap.set("n", "<F1>", dap.terminate)
vim.keymap.set("n", "<F6>", dap.toggle_breakpoint)
vim.keymap.set("n", "<F7>", dap.continue)
vim.keymap.set("n", "<F8>", dap.step_over)
vim.keymap.set("n", "<F9>", dap.step_out)
vim.keymap.set("n", "<F10>", dap.step_into)
vim.keymap.set("n", "<F11>", dap.pause)
vim.keymap.set("n", "<F56>", dap.down) -- <A-F8>
vim.keymap.set("n", "<F57>", dap.up) -- <A-F9>
local rr_dap = require("nvim-dap-rr")
rr_dap.setup({
mappings = {
-- you will probably want to change these defaults to that they match
-- your usual debugger mappings
continue = "<F7>",
step_over = "<F8>",
step_out = "<F9>",
step_into = "<F10>",
reverse_continue = "<F19>", -- <S-F7>
reverse_step_over = "<F20>", -- <S-F8>
reverse_step_out = "<F21>", -- <S-F9>
reverse_step_into = "<F22>", -- <S-F10>
-- instruction level stepping
step_over_i = "<F32>", -- <C-F8>
step_out_i = "<F33>", -- <C-F8>
step_into_i = "<F34>", -- <C-F8>
reverse_step_over_i = "<F44>", -- <SC-F8>
reverse_step_out_i = "<F45>", -- <SC-F9>
reverse_step_into_i = "<F46>", -- <SC-F10>
}
})
dap.configurations.rust = { rr_dap.get_rust_config() }
dap.configurations.cpp = { rr_dap.get_config() }To append the rr configuration to an already existing dap.configurations.<lang> table substitute
dap.configurations.rust = { rr_dap.get_rust_config() }
dap.configurations.cpp = { rr_dap.get_config() }for
table.insert(dap.configurations.rust, rr_dap.get_rust_config())
table.insert(dap.configurations.cpp, rr_dap.get_config())
The get_rust_config function works as the get_config one, but makes sure to source the rust-gdb, which
will allow you to see sources related to rustc (some basic stuff like Option and Result would raise
"Sourcefile Not Found" errors otherwise).
The demo configuration can be found in my dotfiles
To change the debugger configuration you can use get_config(debuggerOpts):
table.insert(dap.configurations.cpp, rr_dap.get_config(
    {
        miDebuggerPath = "<path>",
        miDebuggerServerAddress = "<remote_address:port>"
        program = <my_own_program_picker>,
        args = {"<argument>"},
        stopAtEntry = false,
        environment = {"<env_var>"},
    }
))
The entries you specify will overwrite the defaults:
local default_rr_config = {
        name= "rr",
        type= "cppdbg",
        request= "launch",
        program = find_program,
        args= {},
        miDebuggerServerAddress= "127.0.0.1:50505",
        stopAtEntry= true,
        cwd= vim.fn.getcwd,
        environment= {},
        externalConsole= true,
        MIMode= "gdb",
        setupCommands= {
            {
                description= "Setup to resolve symbols",
                text= "set sysroot /",
                ignoreFailures= false
            },
            {
               description= "Enable pretty-printing for gdb",
               text= "-enable-pretty-printing",
               ignoreFailures= false
            }
        },
    }
Warning: The plugin uses the name of the configuration to setup the mappings of its dap functions. You are not supposed to change the name of a config once it is returned to you.
Also it is expected that configs not generated by the plugin will have different names that those that are generated by the plugin.
If you have an unrelated dap config with the same name as a rr config, it will make sessions of that unrelated config to trigger the mappings of this plugin possibly breaking its funcionality if the adapter is not based on gdb.
When the replay session gets to the end of a recording the DAP will generally automatically close, not allowing you to go back. Running again a debugging session will immediately close the DAP session as it spawns (as it will detect that the program has terminated).
You can fix this by telling the replay session to go back one instruction.
The plugin includes a helper function ReverseNextiNoDAP for this purpose, it will ask you
the address and port of the debugging session (by default 127.0.0.1:50505),
connect to it and rewind the replay session by one instruction.
At this point you should be able to connect to the replay session as usual.
