Kindergarten - Interactive Plotting GUI for Python Notebooks
Kindergarten is a UI on top of Plotly to visualize Pandas DataFrames (and Series).
Simply pip install kindergarten, and then do
from kindergarten import plot
import pandas as pd

df = pd.DataFrame({"x": [1, 2, 3], "y": [4, 5, 6]})
plot()
in a Jupyter notebook to interactively visualize DataFrames. The library automatically finds all DataFrames and populates all options with column names etc.
If you need a different number of traces, you can specify the number with plot(num_traces=10).
Main Features
- supports a large part of the Plotly API
- support for multiple traces that can use data from different dataframes
Print Codebutton below the plot that allows exporting the code that generates the figures
Examples
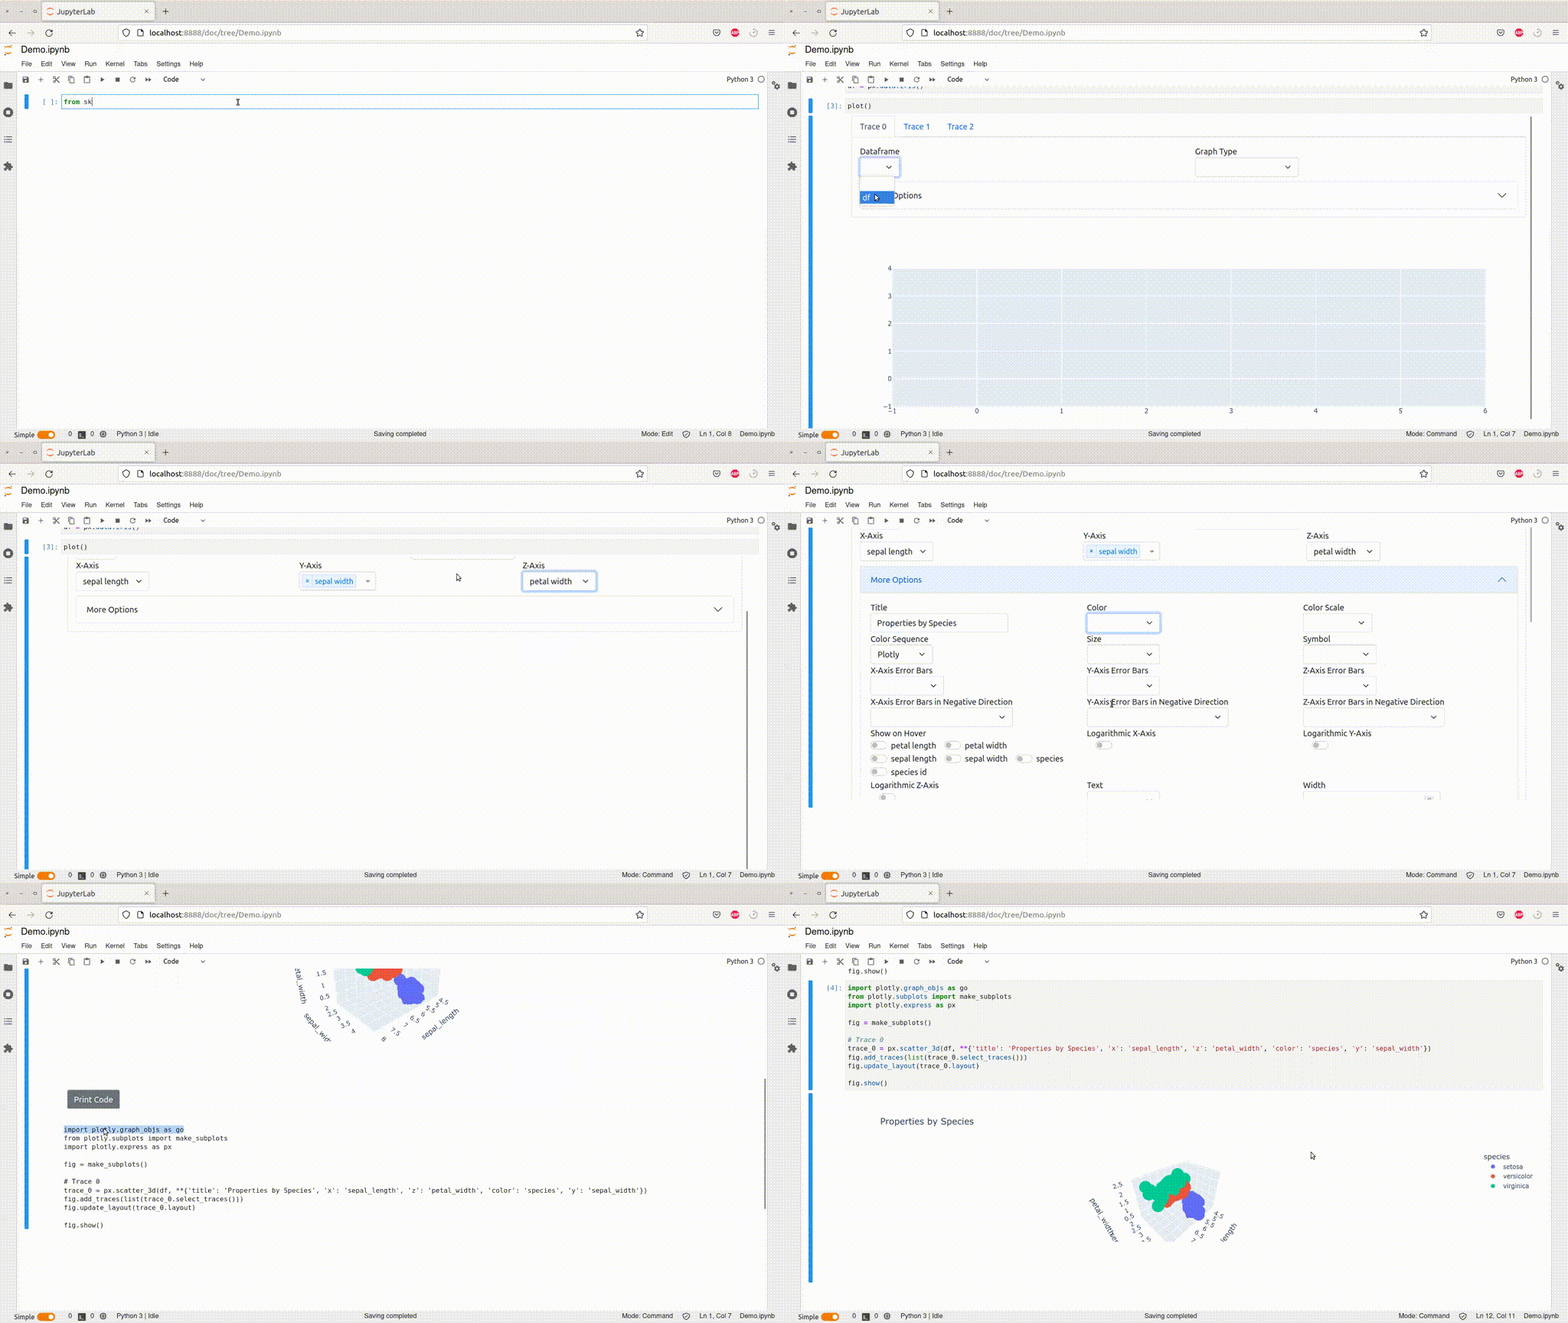
Plotting a single DataFrame:
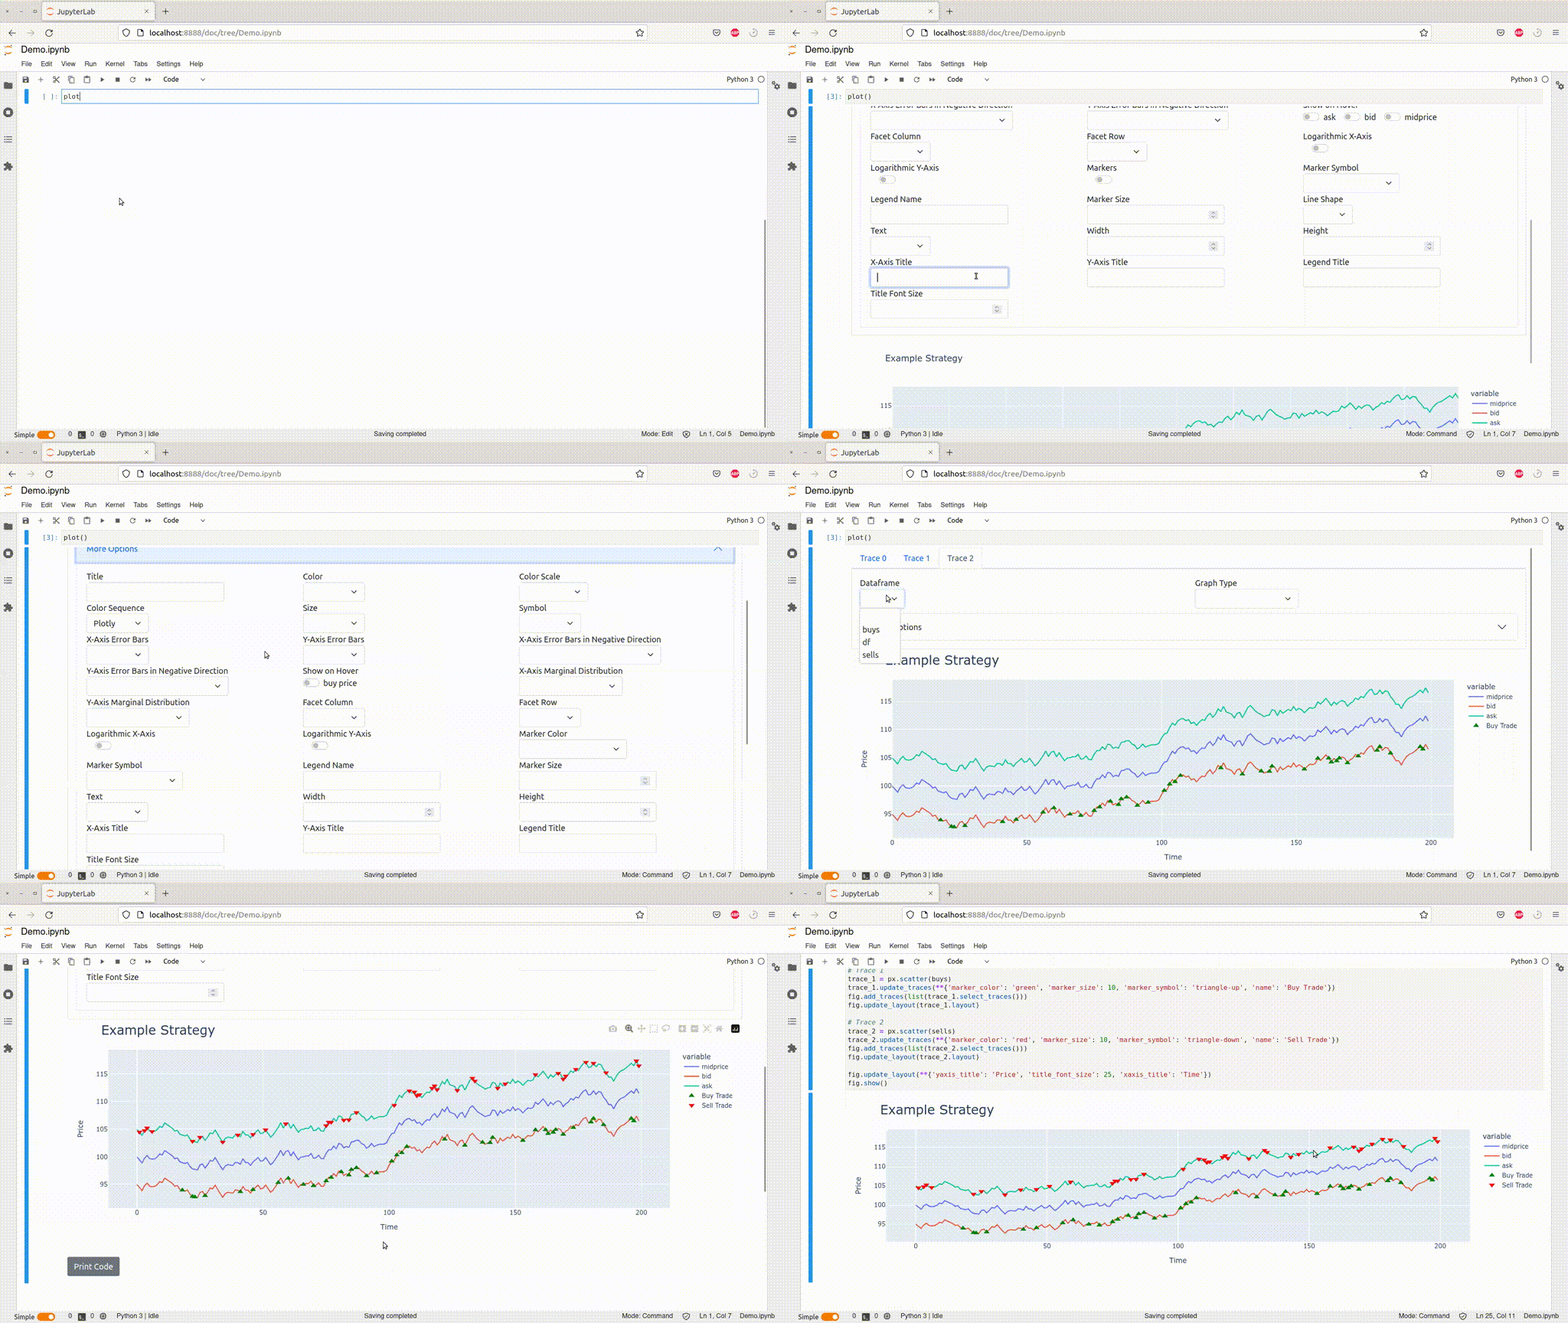
Plotting several traces:
Screenshots
See also
- short blog post introducing the library and explaining some implementation details
- plotly


