Data Acquisition (DAQ) with the Analog Discovery 2 oscilloscope. The OsciDAQ was developed as part of an internship at Wingtra by Jonas Lauener.
For any technical questions, please open an issue: https://github.com/jolau/OsciDAQ/issues/new/choose
Copyright (c) 2020, Jonas Lauener & Wingtra AG


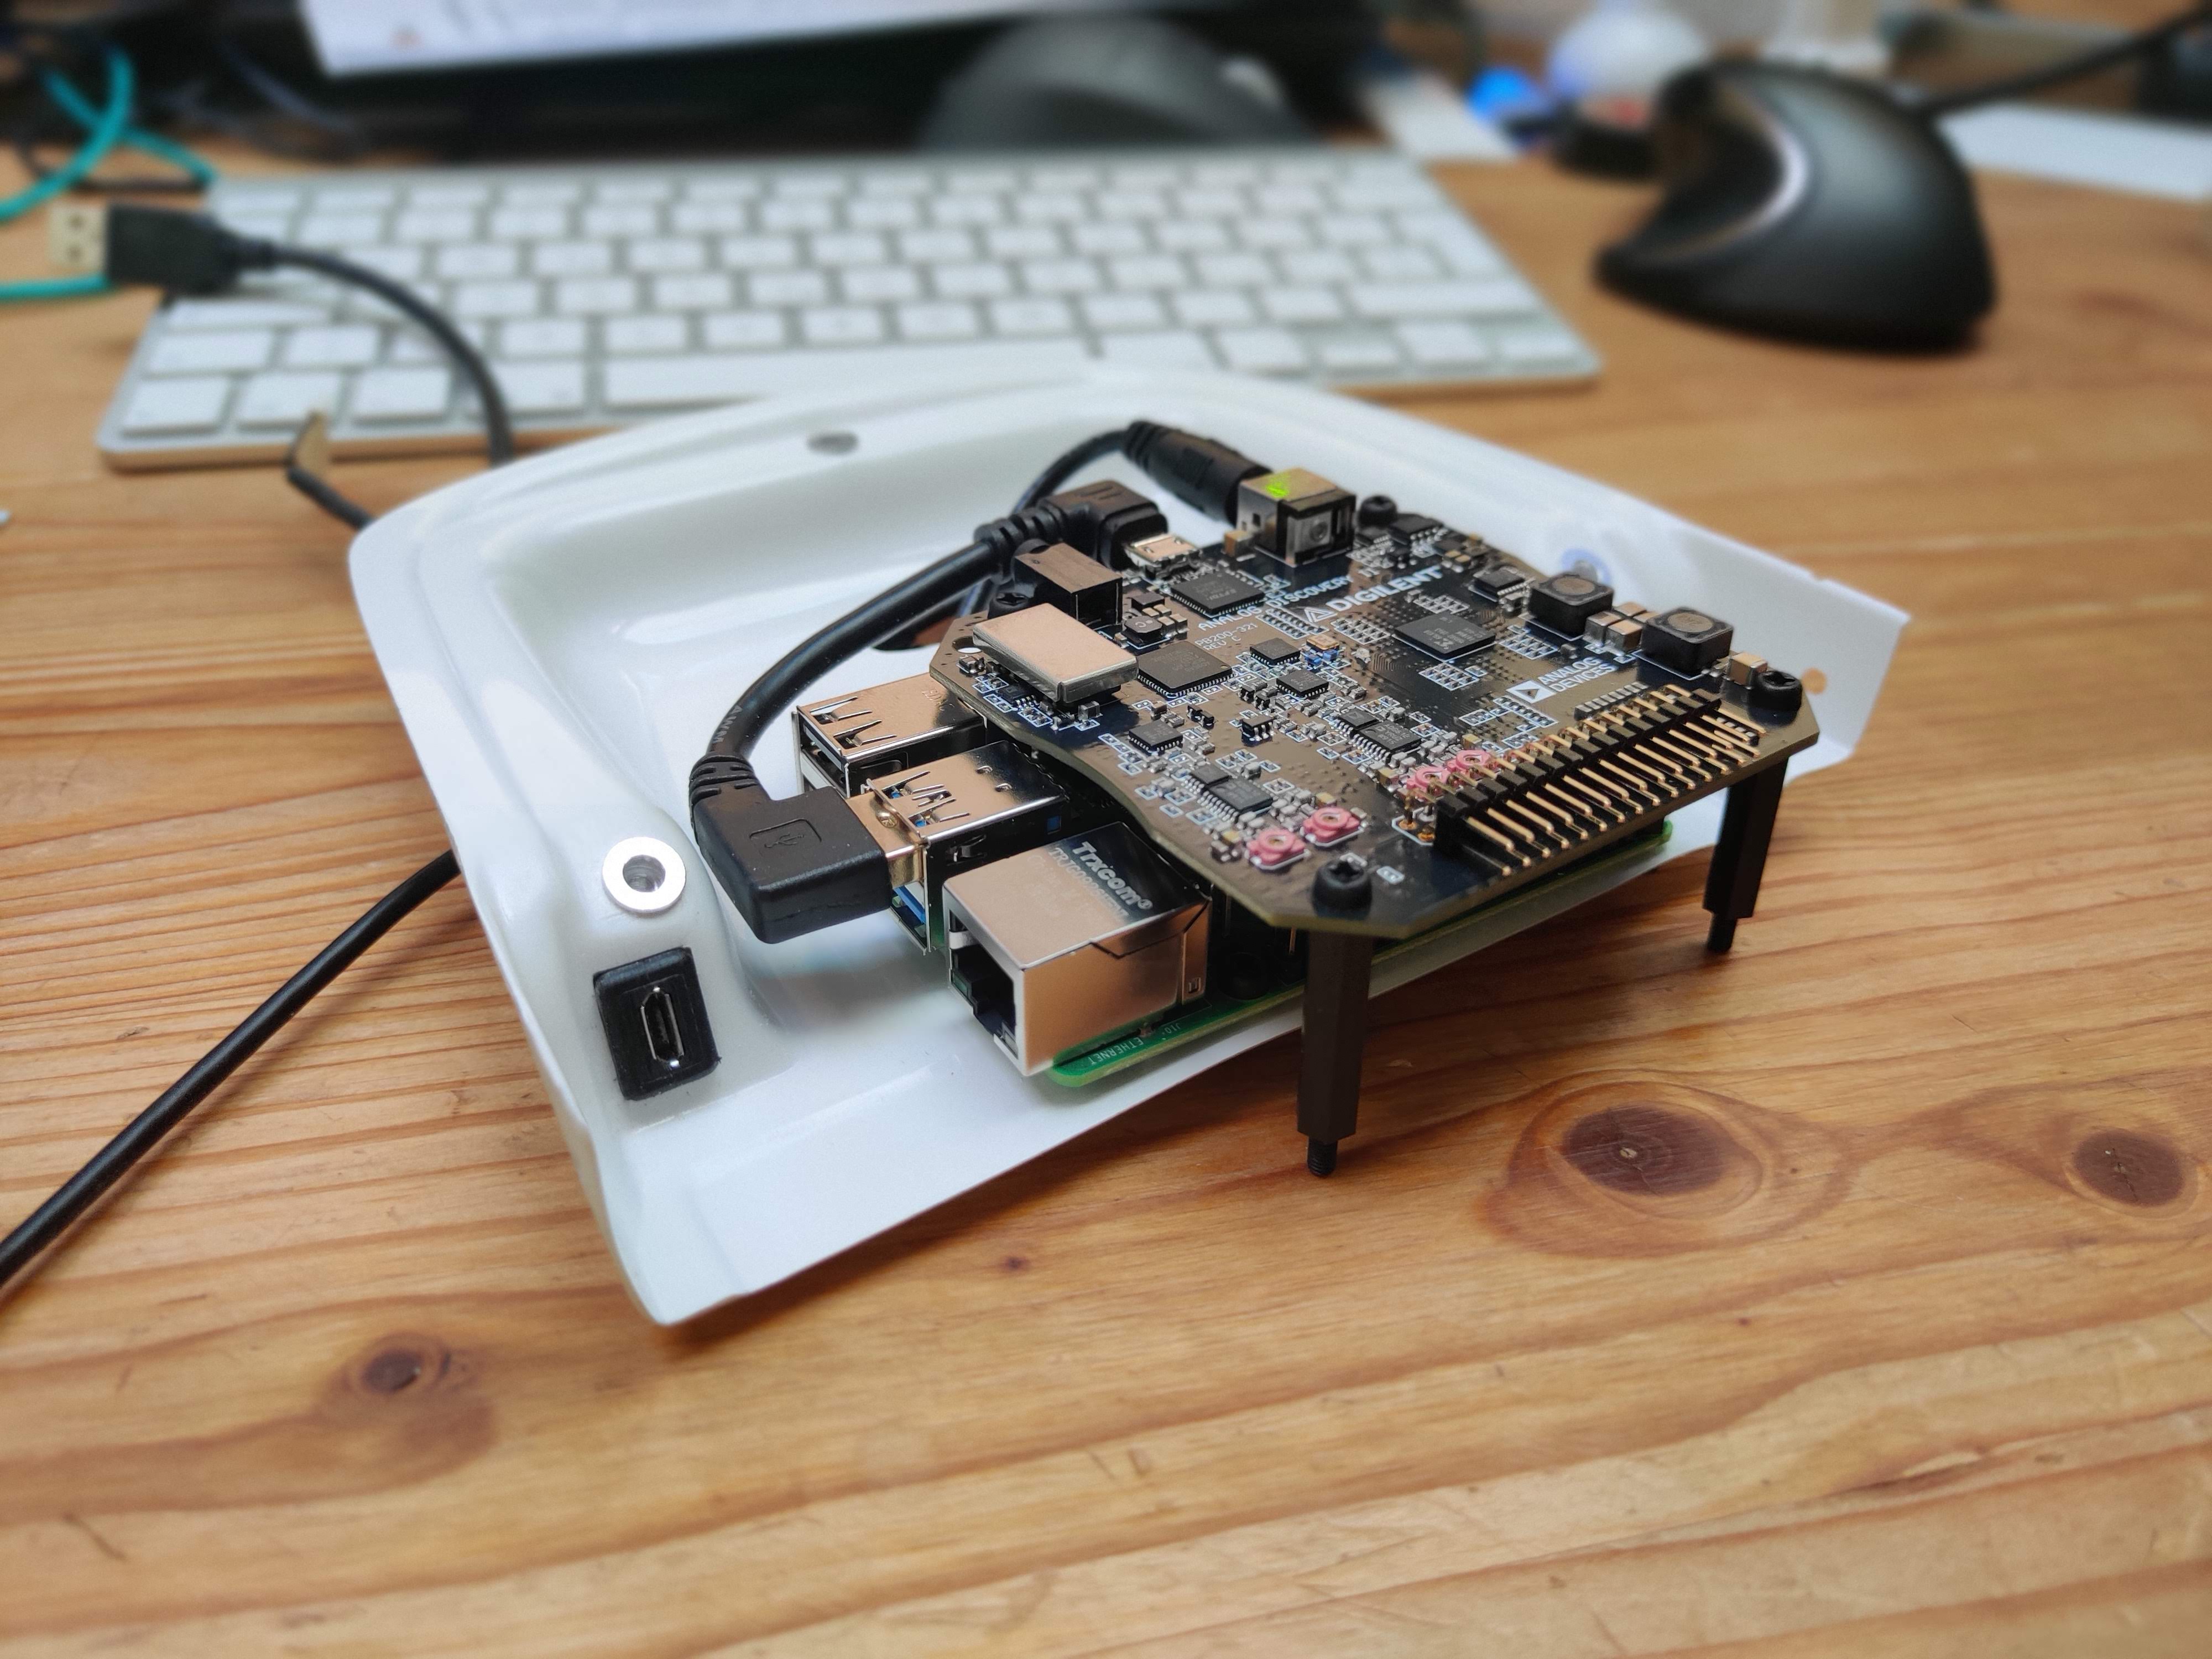
- Raspberry Pi 4
- Analog Discovery 2
- Pololu 5V, 5A Step-Down Voltage Regulator
- For better stability the Raspberry and the Analog Discovery have to be powered separately. Otherwise the voltage drop over Raspberry Pi's USB is to large and the connection to the Analog Discovery is unstable (→ ERC 0x2 in Waveforms software).
Two-channel oscilloscope:
- 1MΩ
- ±25V
- differential
- 14-bit
- 100Msample/sec
- 30MHz+ bandwidth (with the Analog Discovery BNC Adapter Board)
Other features for data acquisition are not yet supported by this toolchain.
- Do the acquisition of the data with the official Waveforms software. The data is logged in the proprietary, binary file format TDMS.
- Convert the TDMS files to CSV.
- Plot and analyze the CSV files.
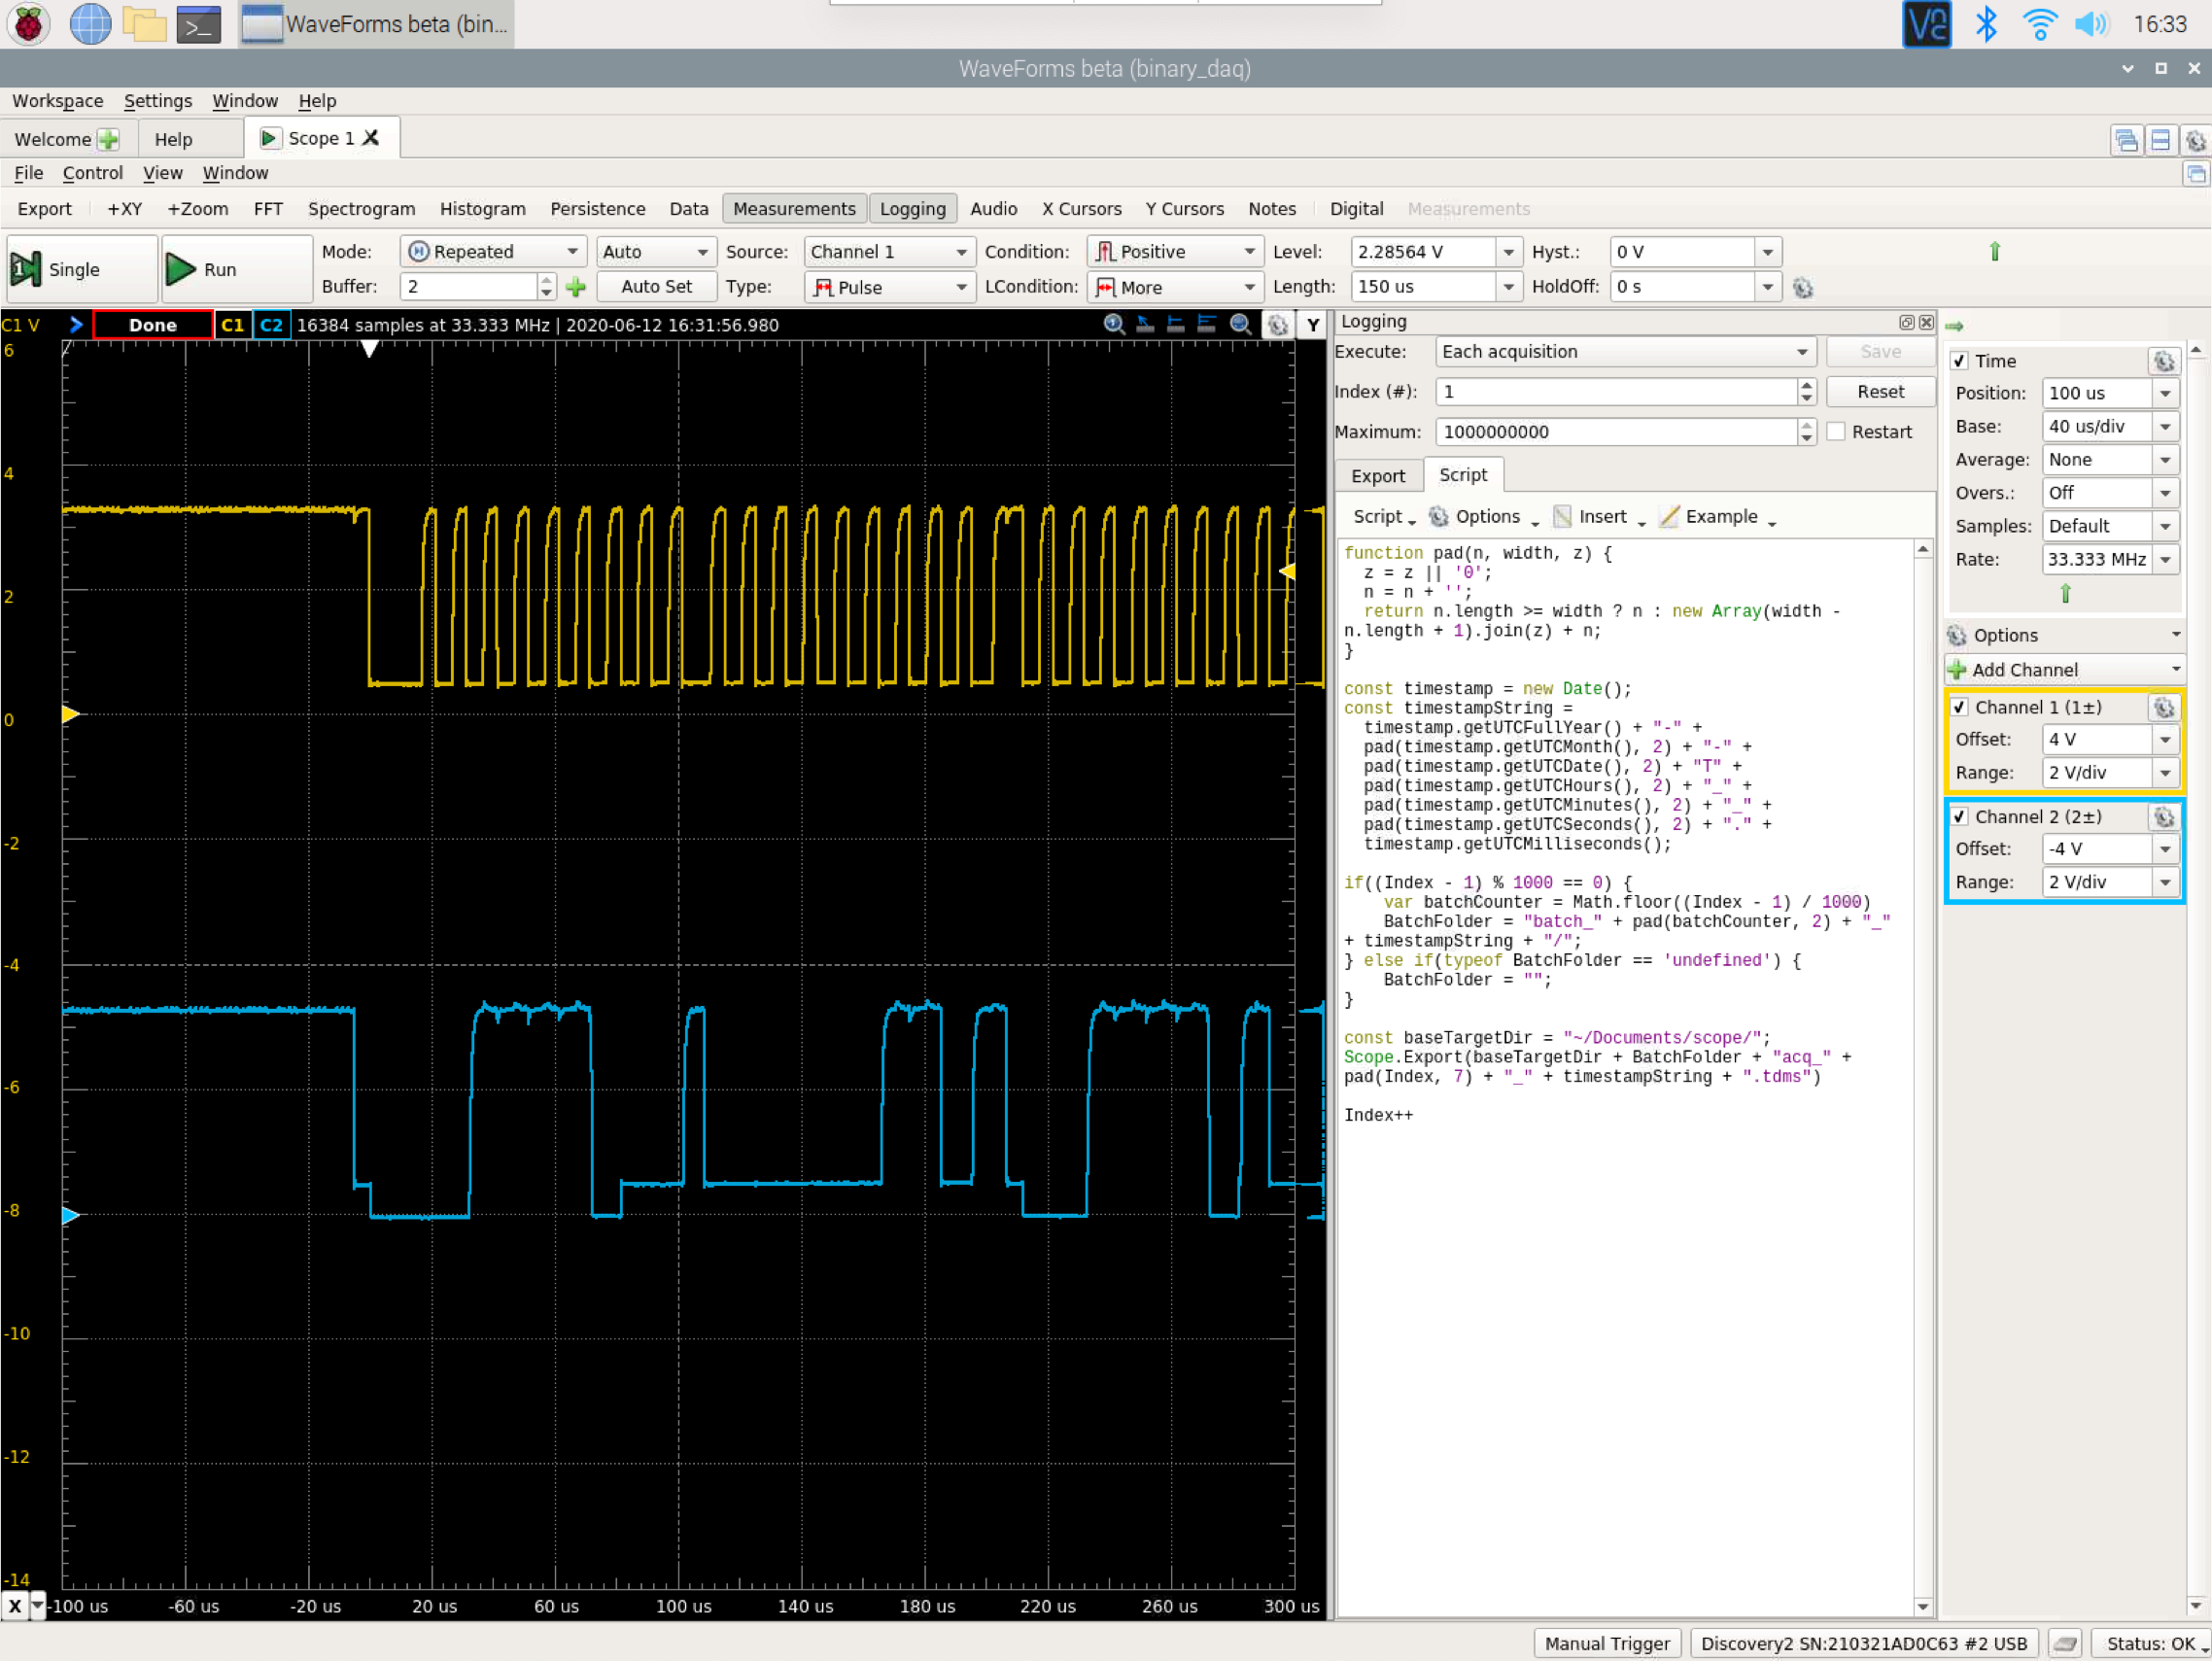
The acquisition is done with the official Waveforms software. With the prepared logging script, it records the samples in the TDMS file format.
In case you want to setup your own OsciDAQ on a Raspberry Pi:
Remark: The Analog Discovery 2 works only with the Raspberry Pi 4.
- Plug the Analog Discovery 2 to a USB 3.0 port on the Raspberry.
- Install Adept 2 Runtime. Last tested version: 2.20.1
- Install latest 32bit Waveforms beta. Last tested version: 3.13.20
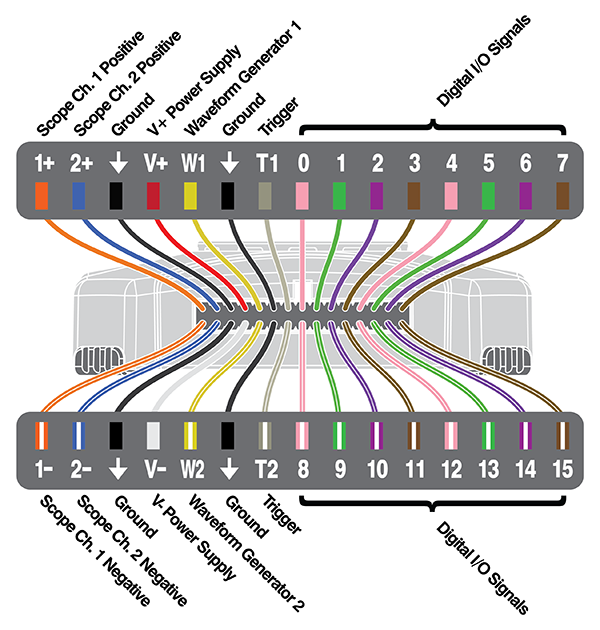
- Connect oscilloscope to the signals you wish to investigate → Pinout
- Connect to OsciDAQ and open the template_logging.dwf3work workspace
- Make your adjustment until you get your signal right
- Save as... workspace
- Connect to OsciDAQ and open your prepared workspace
- Make sure
Each acquisitionis selected in Logging - Press
Run
- Download the collected data (by default under
~/Documents/scope) over SFTP - Proceed with Conversion
- Connect your laptop to the OsciDAQ by Ethernet.
- Find the IP address with
sudo arp-scan --interface=eth0 --localnet - Connect with the VNC Viewer to the Raspberry Pi.
The binary TDMS files coming from the Waveforms software have to be converted to CSV files - this is done using a custom python script.
Install the converter script on your PC:
Run: pip3 install -r OsciConverter/requirements.txt
- Identify the UTC timestamp when the interesting stuff happened
- Identify which batch folder contains the selected timestamp
- Convert the TDMS files to CSV in that batch folder
Run python OsciConverter/tdms_convert.py [path to the batch directory with the TDMS files]
The csv files are stored in a directory named [tdms_files_directory]_csv located next to the directory stated above.
Run python OsciConverter/tdms_convert.py -h to see all available options.
Run python OsciConverter/tdms_preview.py [path to tdms file] to preview data of one file as a plot.
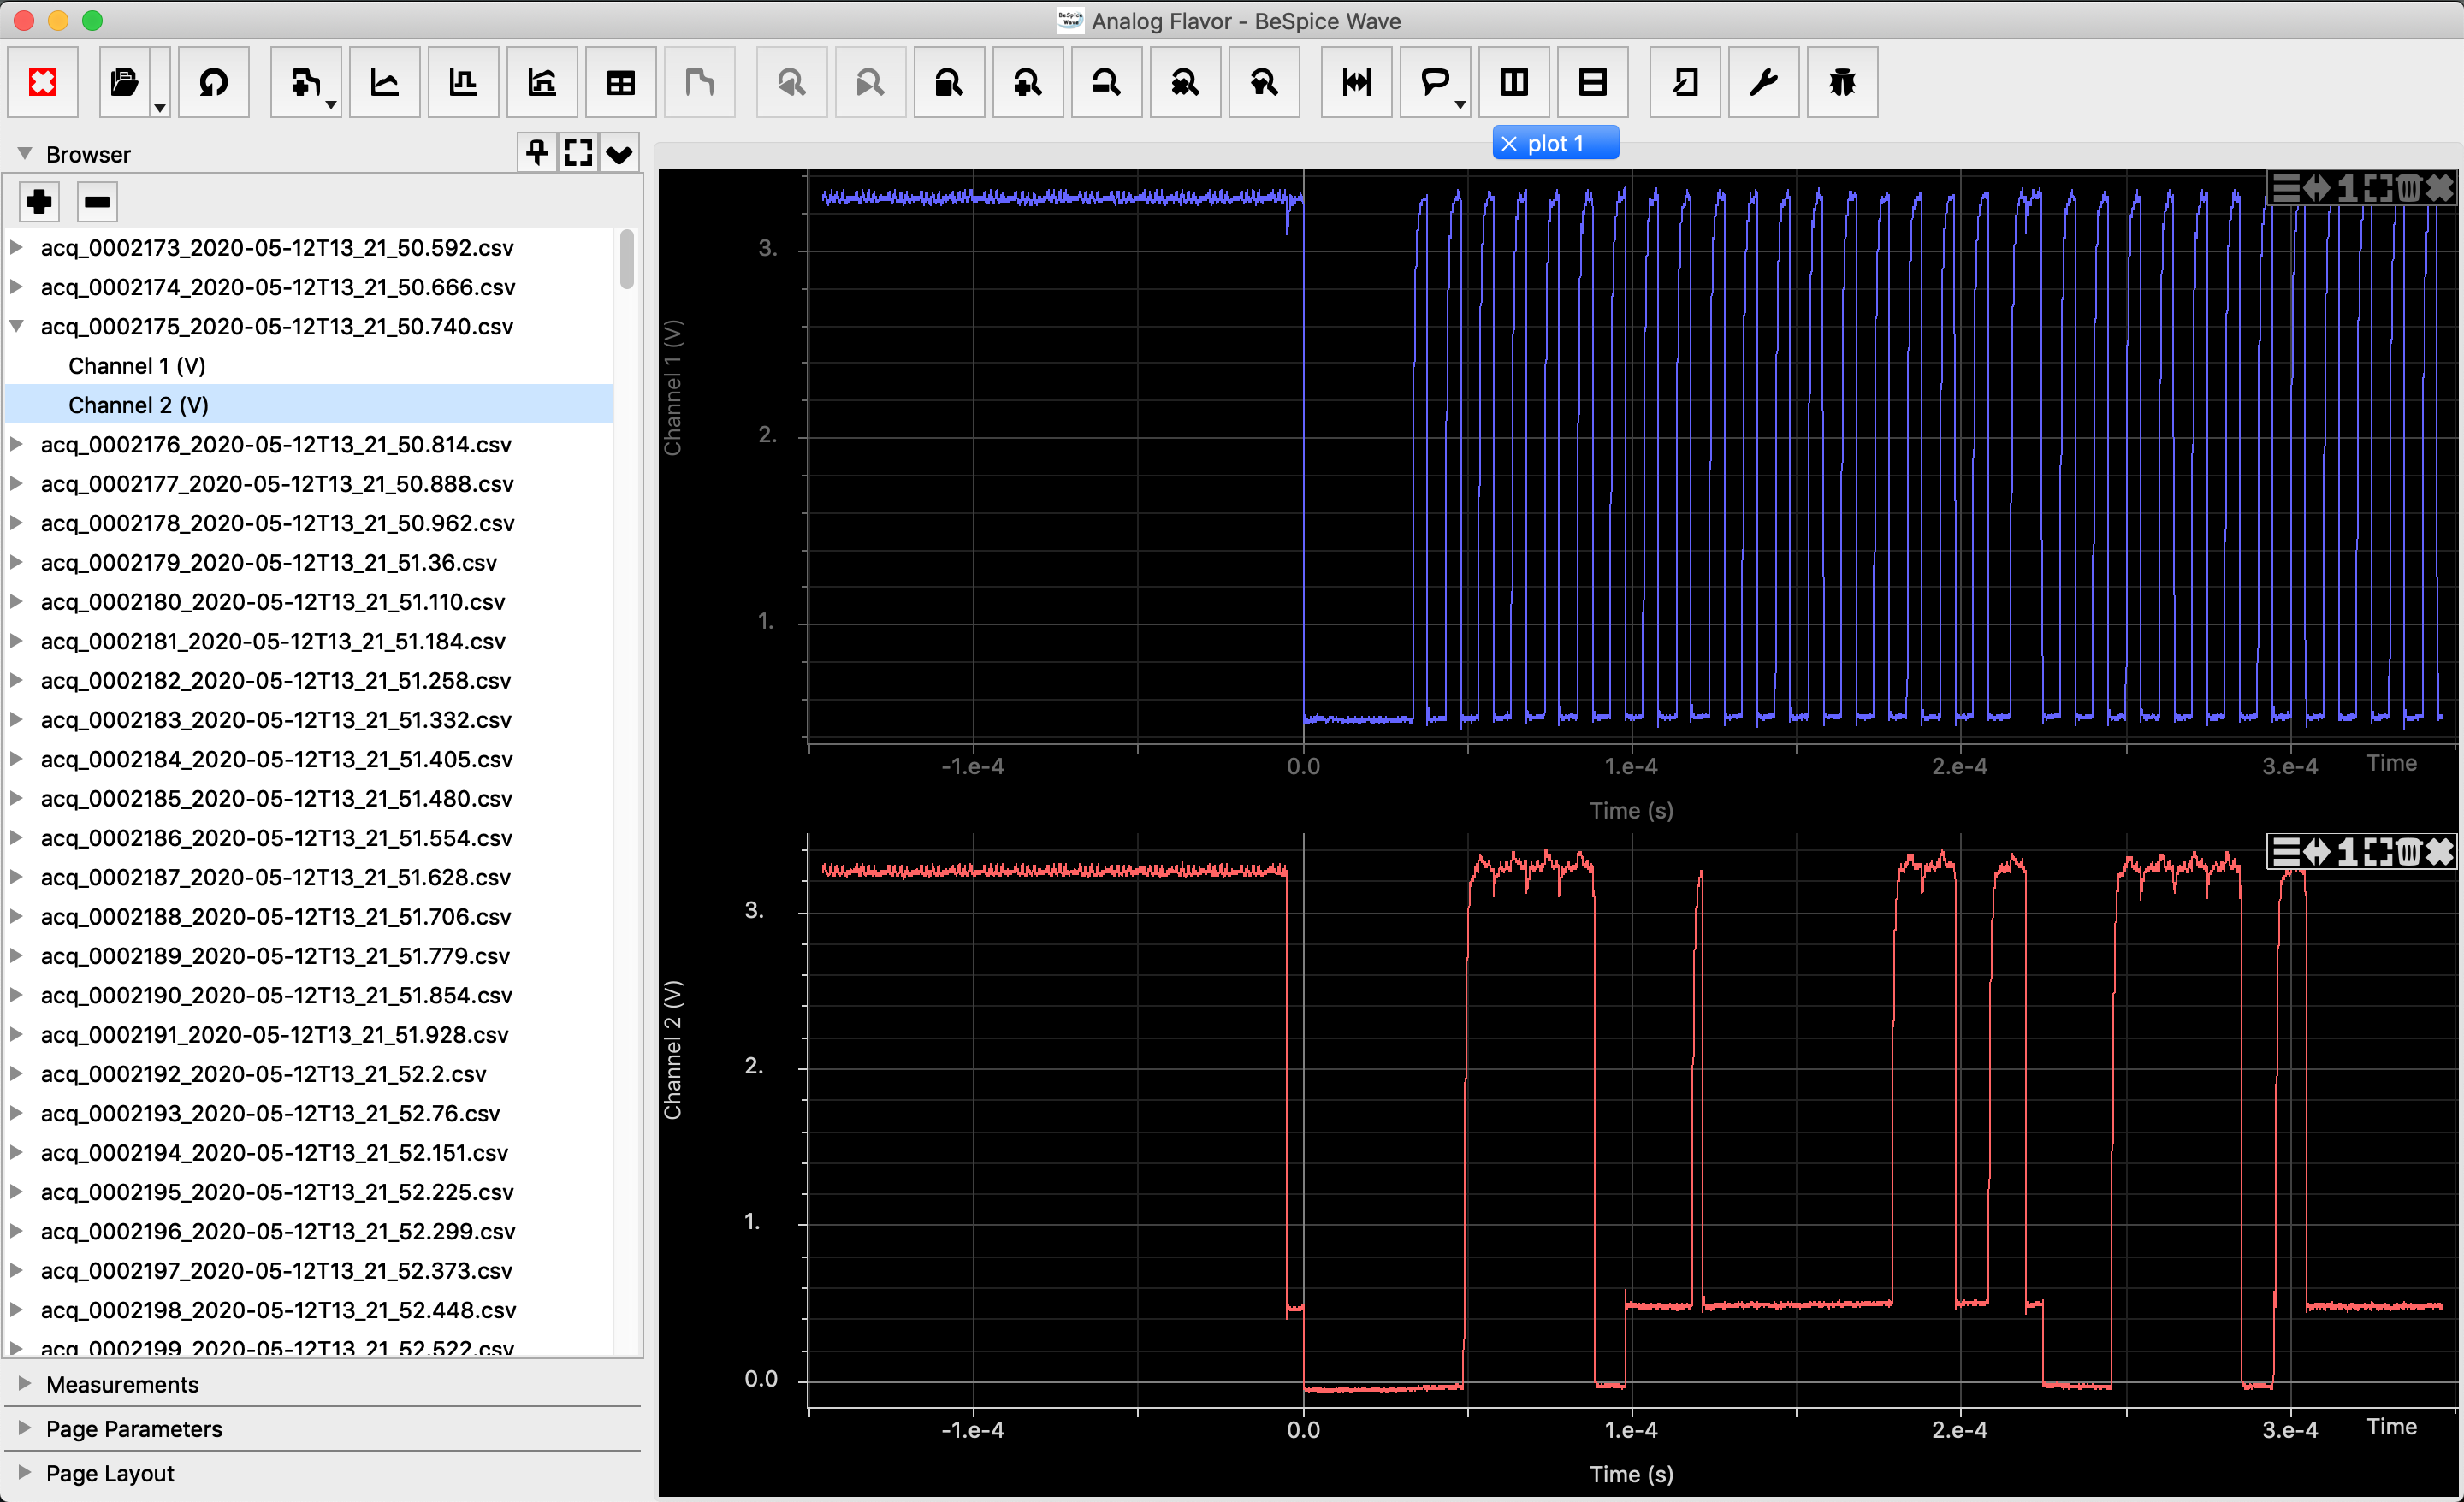
You can use whatever tool you like to analyze the csv files, but I recommend you to use the BeSpice Wave software.

Download and install the BeSpice Wave software on your PC.
Open the previously converted CSV files in BeSpice Wave
As a proof-of-concept I did some logging on an I2C port (SDA/SCL):

