Cyclical
![]()
![]()
Encode item list into "cyclical"
Installation
pip install cyclical

# or
git clone https://github.com/jojoee/cyclical
cd cyclical
python setup.py install
Usage
from cyclical import cyclical

n_rows = 1000
n_hrs = 24
hrs = [item % n_hrs for item in list(range(0, n_rows, 1))]
encoded_hrs = cyclical.encode(hrs, n_hrs)
print(encoded_hrs)

"""
([0.0, 0.25881904510252074, 0.49999999999999994, 0.7071067811865476, 0.8660254037844386,
0.9659258262890682, 1.0, 0.9659258262890683, 0.8660254037844387, 0.7071067811865476,
0.5000000000000003, 0.258819045102521, 1.2246467991473532e-16, -0.25881904510252035,
-0.4999999999999997, ...
"""
Real use case
TLTR: normalize cyclical data (e.g. month number [0-11], hour number [0, 23]) by mapping them into sin and cos of 1-radius-circle
2 years ago while I was doing the “ocean current prediction model”. From the background knowledge of its nature which the ocean current has a strong relation with wind speed and wind speed also based on the season. So, I try to give the model “month number” which starts with 0 and ends with 11.
With the deep learning model, I have to normalize data into [0, 1] which 1 refers to the maximum magnitude. There have many ways to normalize data such as min/max, mean/std, and other normalization but it can’t apply to this “month number” data.
“Month number” has a cyclical characteristic, so month-number-11 can’t be compared with month-number-0 as it showed, Thus I have to represent “month number” with other normalization method instead which is “cyclical” in this module.
import pandas as pd
from cyclical import cyclical
import math
import matplotlib.pyplot as plt
%matplotlib inline
n_rows = 1000
n_hrs = 24
hrs = [item % n_hrs for item in list(range(0, n_rows, 1))]
encoded_hrs = cyclical.encode(hrs, n_hrs)
# print(encoded_hrs)
n_months = 12
months = [item % n_months for item in list(range(0, n_rows, 1))]
encoded_months = cyclical.encode(months, n_months)
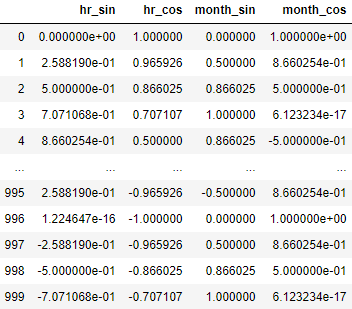
# datframe
df = pd.DataFrame({
# hr
'hr_sin': encoded_hrs[0],
'hr_cos': encoded_hrs[1],
# month
'month_sin': encoded_months[0],
'month_cos': encoded_months[1],
})
display(df)
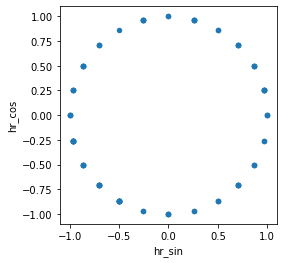
# plot
n_samples = math.floor(n_rows * 0.1)
df.sample(n_samples).plot.scatter('hr_sin', 'hr_cos').set_aspect('equal')
plt.show()
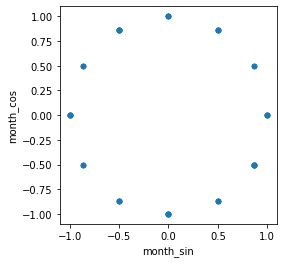
# plot
df.sample(n_samples).plot.scatter('month_sin', 'month_cos').set_aspect('equal')
plt.show()