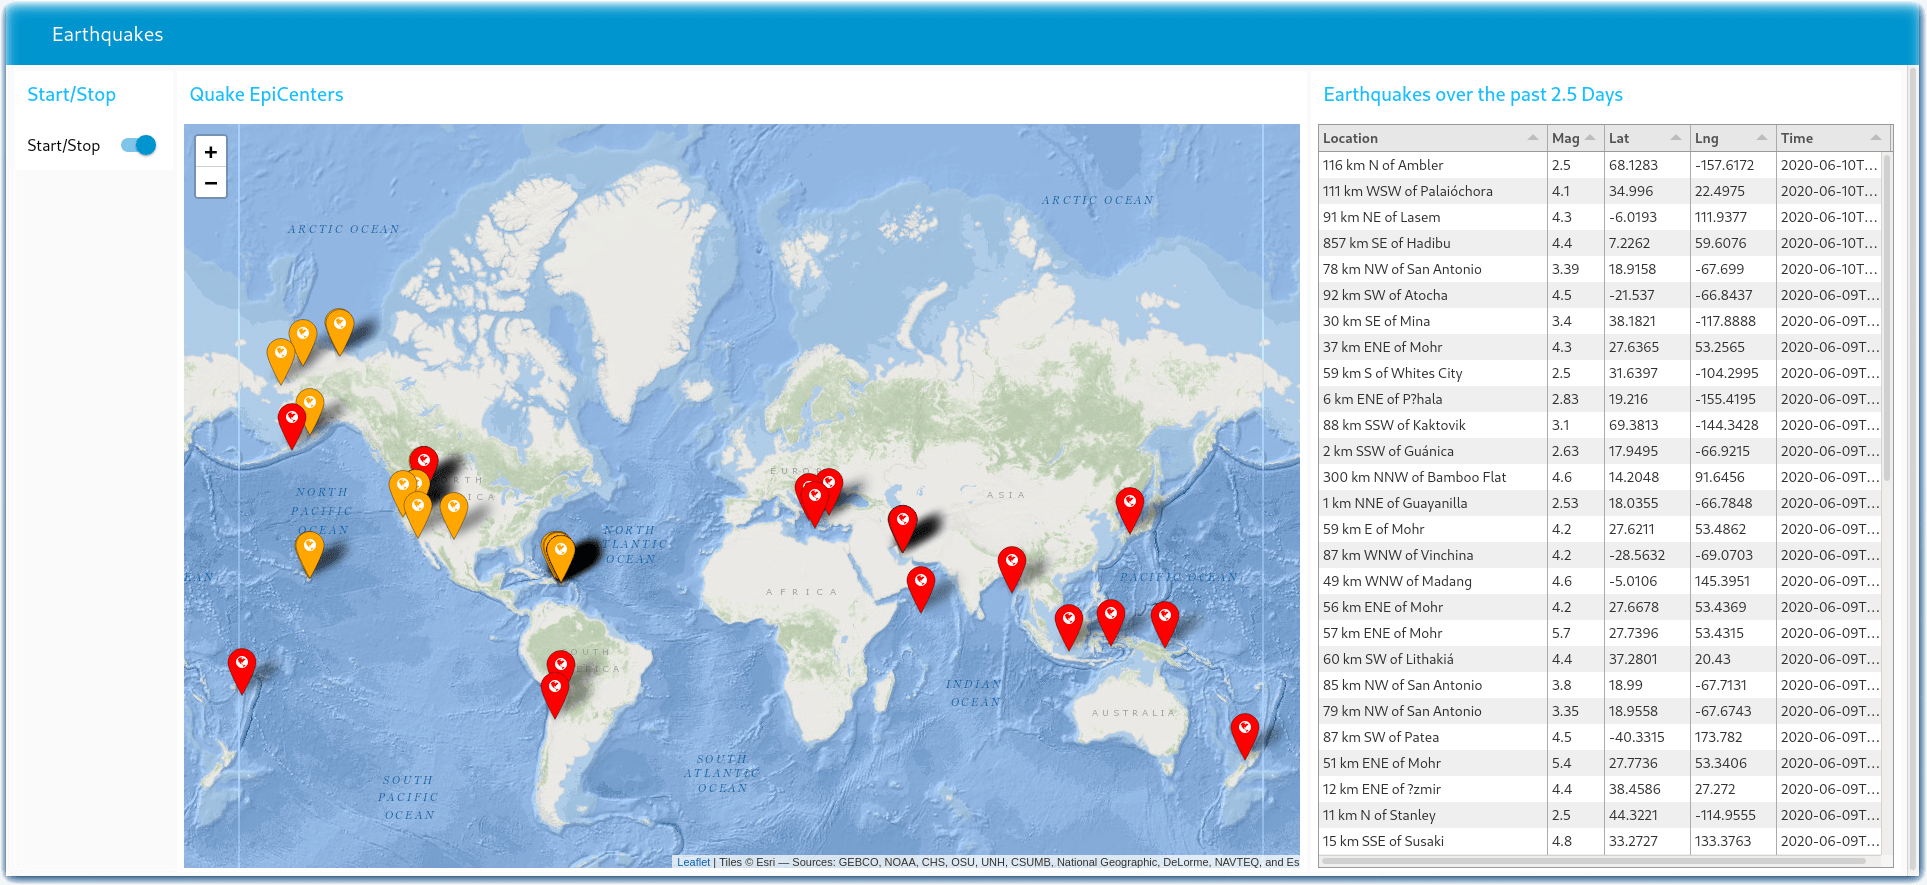
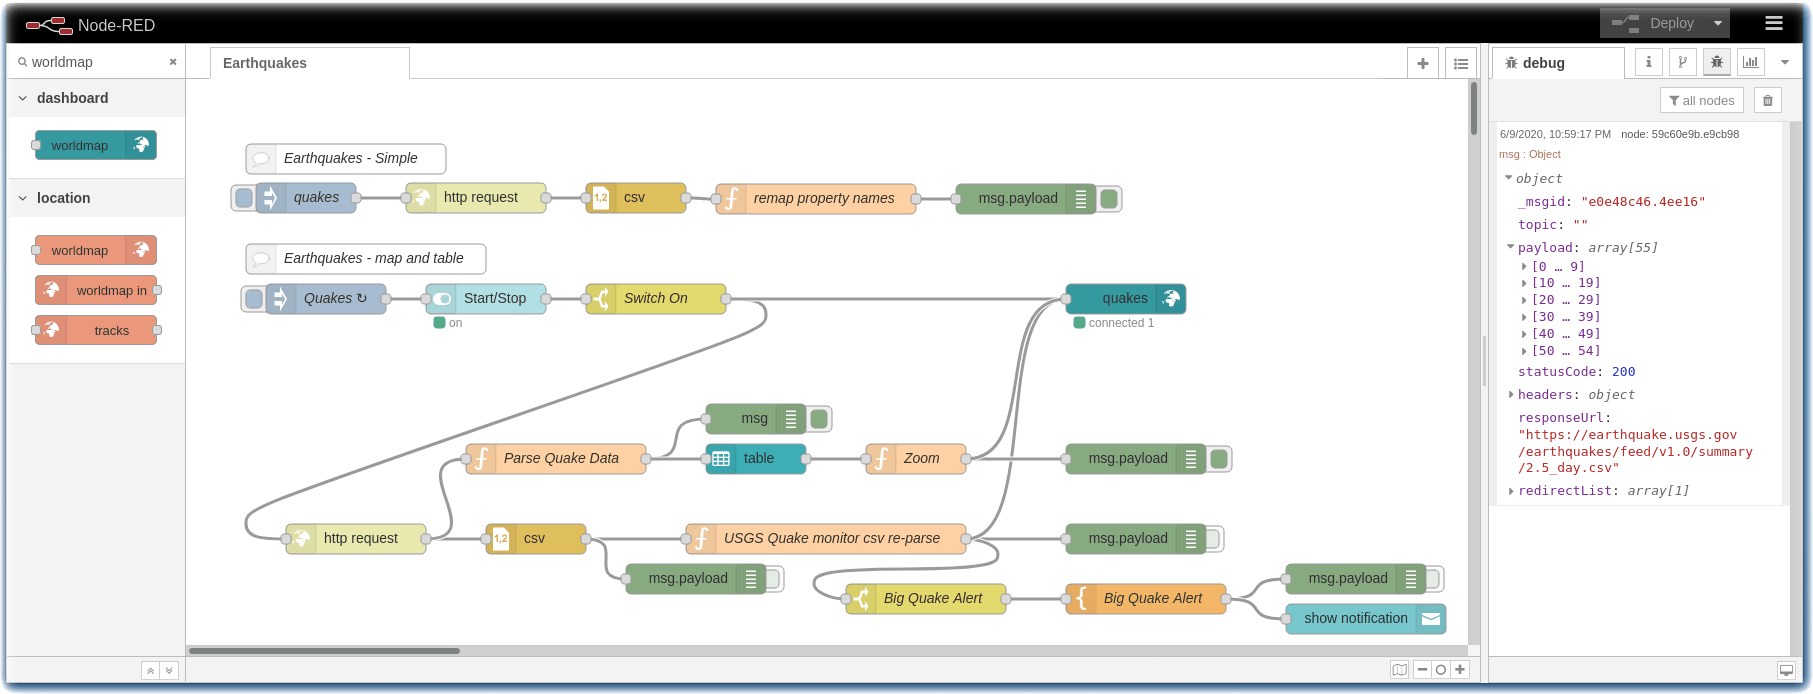
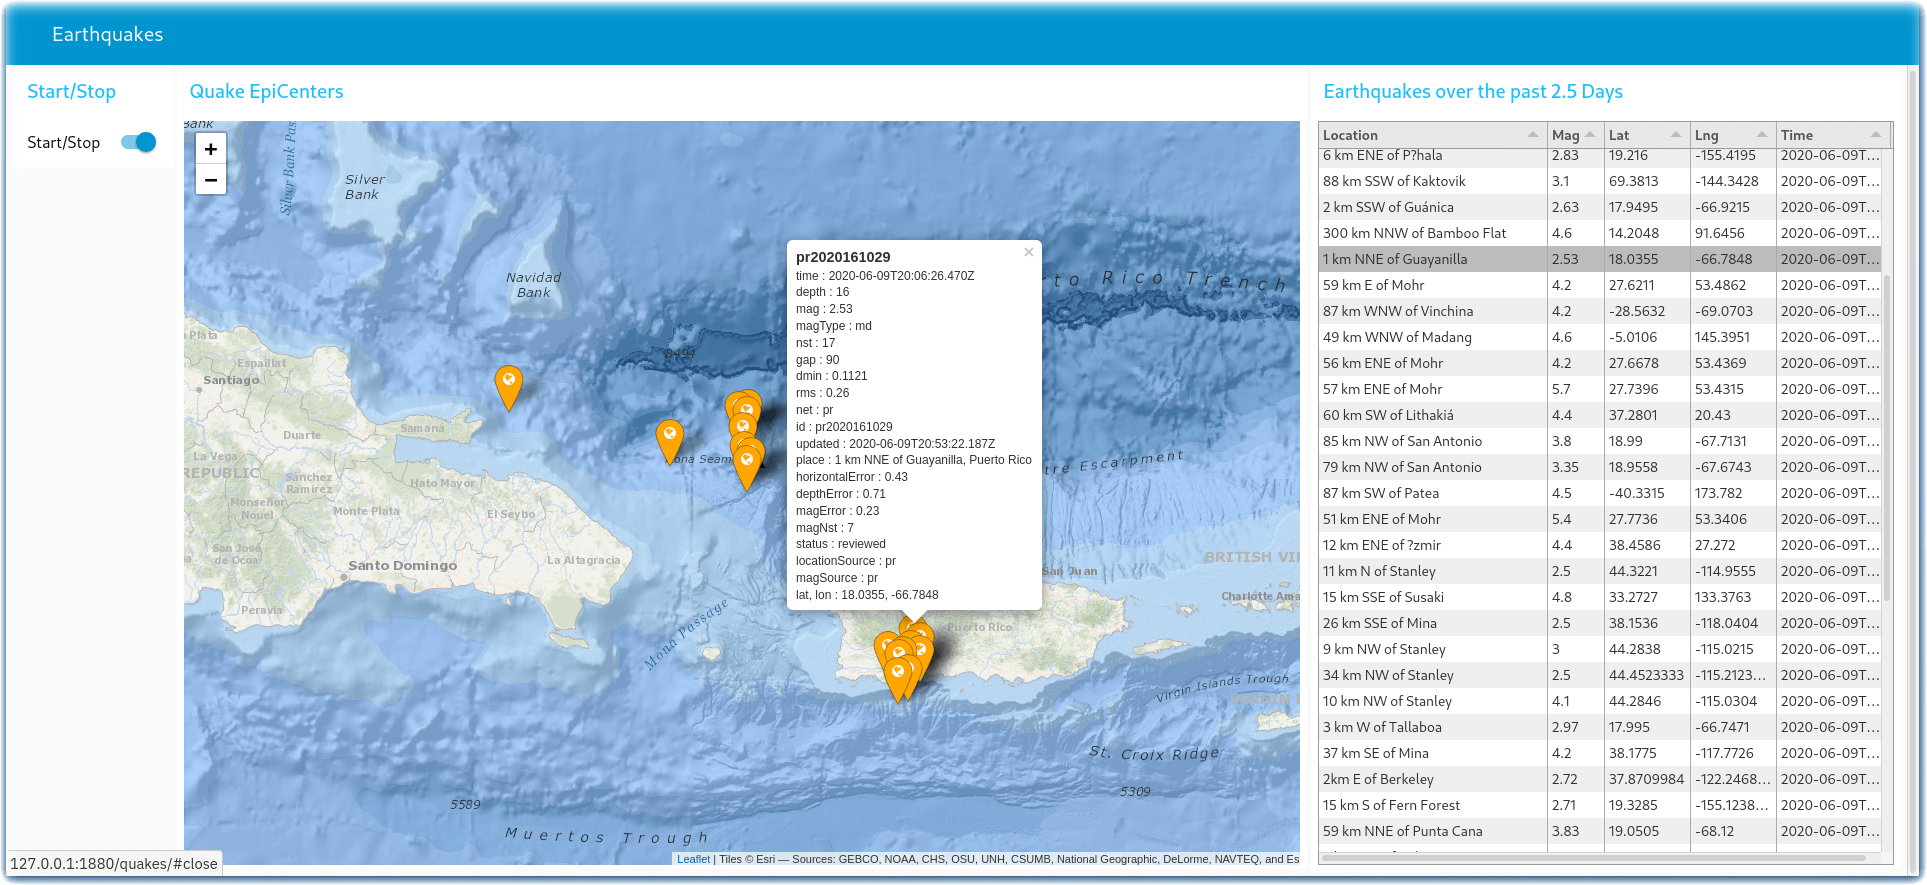
Plot Earthquake seismic activity on a Node-RED Map Dashboard and Table
Plot a list of earthquakes from the USGS earthquake public API on a Node-RED Dashboard
This example flow and Node-RED Dashboard might be useful as part of a Call for Code Natural Disaster solution.
For additional earthquake dashboards, learn about the OpenEEW Early Earthquake Warning Node-RED examples
- Install Node-RED on your system or in the cloud
- Add the following nodes to your Node-RED palette
- Import the earthquakes flow
- Display a Notification Alert if there is a Earthquake >= Magnitude 5
- Click on the red icon to zoom to that epicenter on the Earth.
Enjoy! Give us feedback if you have suggestions on how to improve this tutorial.
This tutorial is licensed under the Apache Software License, Version 2. Separate third party code objects invoked within this code pattern are licensed by their respective providers pursuant to their own separate licenses. Contributions are subject to the Developer Certificate of Origin, Version 1.1 (DCO) and the Apache Software License, Version 2.


