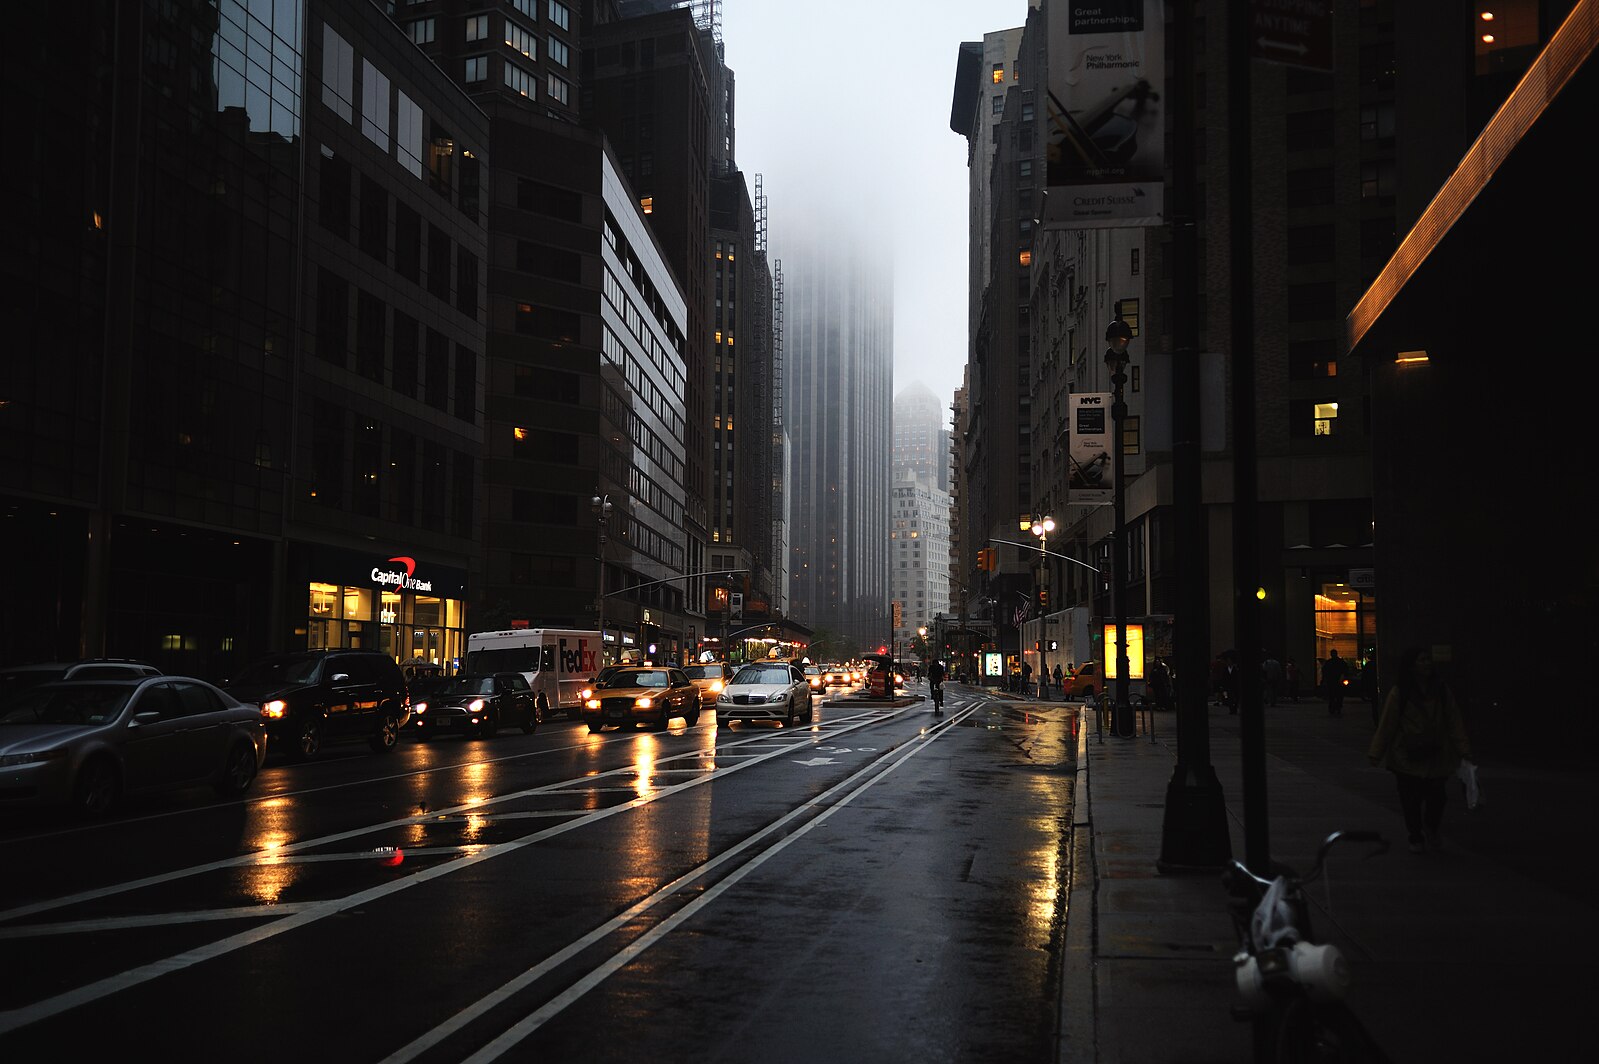
A rainy & foggy afternoon in NYC (src: Wikimedia Commons)
There are two whys and two answers.
- Why look at the rain data in the U.S.?
Answer: I am a rain-enjoyer: If I could choose exactly where to live, places with high rain and stormy weather would be at the top of my list. I like the sun under certain conditions, but rain, fog, thunder, and snow do not bring me down, rather, they are aesthetically fulfilling and give me energy to handle the day. I would like to know, if I want to enjoy some rainy weather, where I should go.
- Why not consult an existing list?
Answer: The internet is full of conflicting information on what the "rainiest places in the U.S." are. And behind all internet top-ten lists, there is a more complex, underlying reality to be understood. For instance, how do you quantify "raininess" and if a place is rainy, well, is the entire place that rainy? If one weather station in Seattle reports x number of rainy days per year, how much does that translate to somewhere, say, 40 minutes outside of Seattle? Also, quite a few lists seem to either not include small towns, or only selectively include them. Well I would like to know how small towns fare as well, because I know, just probability-wise, that it is unlikely that the rainiest place in any U.S. state is a bigger city. These are the things I aim to explore in this repository.
I am using Python 3.8.9 with a list of packages that can be found in requirements.txt. I also make heavy use of jupyter notebooks. All of the most important analysis is in the main notebook.
If you would like to run this project yourself, execute the following commands in your shell:
$ git clone https://github.com/johnmays/noaa-precipitation.git
$ cd noaa-precipitation
noaa-precipitation $ pip install virtualenv
noaa-precipitation $ virtualenv -p < optional path to python 3.8 > venv
noaa-precipitation $ source venv/bin/activate
(venv) noaa-precipitation $ pip install -r requirements.txtI am using publicly available NOAA data downloaded from nceii.noa.gov. This data is part of the global summary of the year (GSOY) dataset, which aggregates daily weather station data into yearly weather metrics like "annual days with any rainfall" and "total annual millimeters of snowfall". I wish there was a more efficient way to search for and access this data, but for now, I go to the search for a town/city I am curious about and look for suitable stations, then download their CSVs. I specifically look for stations that have a complete set of yearly data from 2012 to 2021.
An important note: GSOY data is not by county or by city, but rather, by weather station. Many cities have several weather stations and an airport, each with a long-running and complete dataset. However, many towns only have one weather station near them that reported data to this service, and only did it for a few years in the early 1900's. That is why some notoriously rainly towns, like Seaside, OR and even Providence, RI do not show up in my analysis, unfortunately.
- NOAA: National Oceanic and Atmospheric Administration; the US agecy responsible for for dealing with climate and the like
- NCEI: National Centers for Environmental Information; an entity under the NOAA that collects and distributes environmental data
- USGS: United States Geological Survey; the US agency responsible for monitoring landscape & natural resources
- CDO: Climate Data Online; a service that makes the NOAA's climate data accessible over the web
- Geospatial: Data that is associated with a location, e.g. height stored as a function of global coordinates
- GIS: Geographic Information Systems: Any software that has to do with geographic data
- OGC: Open Geospatial Consortium; a cooperative entity that creates standards for GIS data. Note: sometimes called OpenGIS as well
- WMS: Web Map Service; one of those OGC standardizations for an interface for requesting "map data" (images of geospatial data) from a server
- NBD: National Boundaries Dataset; the USGS's geospatial data, accessible online through a WMS, of global boundaries. There are boundaries for countries, US states, reservations, protected lands, you name it.
What is the rainiest city in the U.S.? Depending on the parameters of your argument and how you choose to quantify this, that question has a few answers. By the metric of days with rain per year, the top five cities (reasonably large ones) are:
Rainiest Cities by Days of Rainfall| City | Median no. of rainy days per year from 2012-2021 |
|---|---|
| Rochester, NY | 179.5 |
| Syracuse,NY | 174.5 |
| Seattle,WA | 168.5 |
| Buffalo, NY | 167.0 |
| Cleveland,OH | 163.0 |
But if you consider any size urban area (towns, cities, etc.), the list is completely different:
Rainiest Towns & Cities by Days of Rainfall| City | Median no. of rainy days per year from 2012-2021 |
|---|---|
| Hilo, HI | 270.5 |
| Annette, AK | 237.0 |
| Forks,WA | 224.5 |
| Raymond, WA | 220.0 |
| Quillayute, WA | 196.0 |
| Astoria, OR | 194.0 |
| Aberdeen, WA | 193.0 |
| Hoquiam, WA | 182.5 |
| Paradise, WA | 182.0 |
| Rochester, NY | 179.5 |
But what about other ways to quantify "rainiest"? Does the amount of rain count for nothing.
Rainiest Towns & Cities by Total Rainfall| City | Median mm of rain per year from 2012-2021 |
|---|---|
| Annette, AK | 3782.85 |
| Paradise, WA | 3275.50 |
| Quinault, WA | 3166.45 |
| Forks, WA | 3103.75 |
| Hilo, HI | 3007.15 |
| Quillayute, WA | 2733.55 |
| Aberdeen, WA | 2336.75 |
| Raymond, WA | 2326.75 |
| Tillamook, OR | 2032.15 |
| Brevard, NC | 1997.40 |
But what about the most total precipitation? If we include snow, looking at towns and cities:
Cities with the Most Total Precipitation| City | Median mm of total precipitation per year from 2012-2021 |
|---|---|
| Presque Isle, ME | 4444.65 |
| Syracuse, NY | 43962.00 |
| Annette, AK | 3782.85 |
| Driggs, ID | 3769.45 |
| Brassau Dam, ME | 3572.30 |
See more extensive tables in the main notebook.
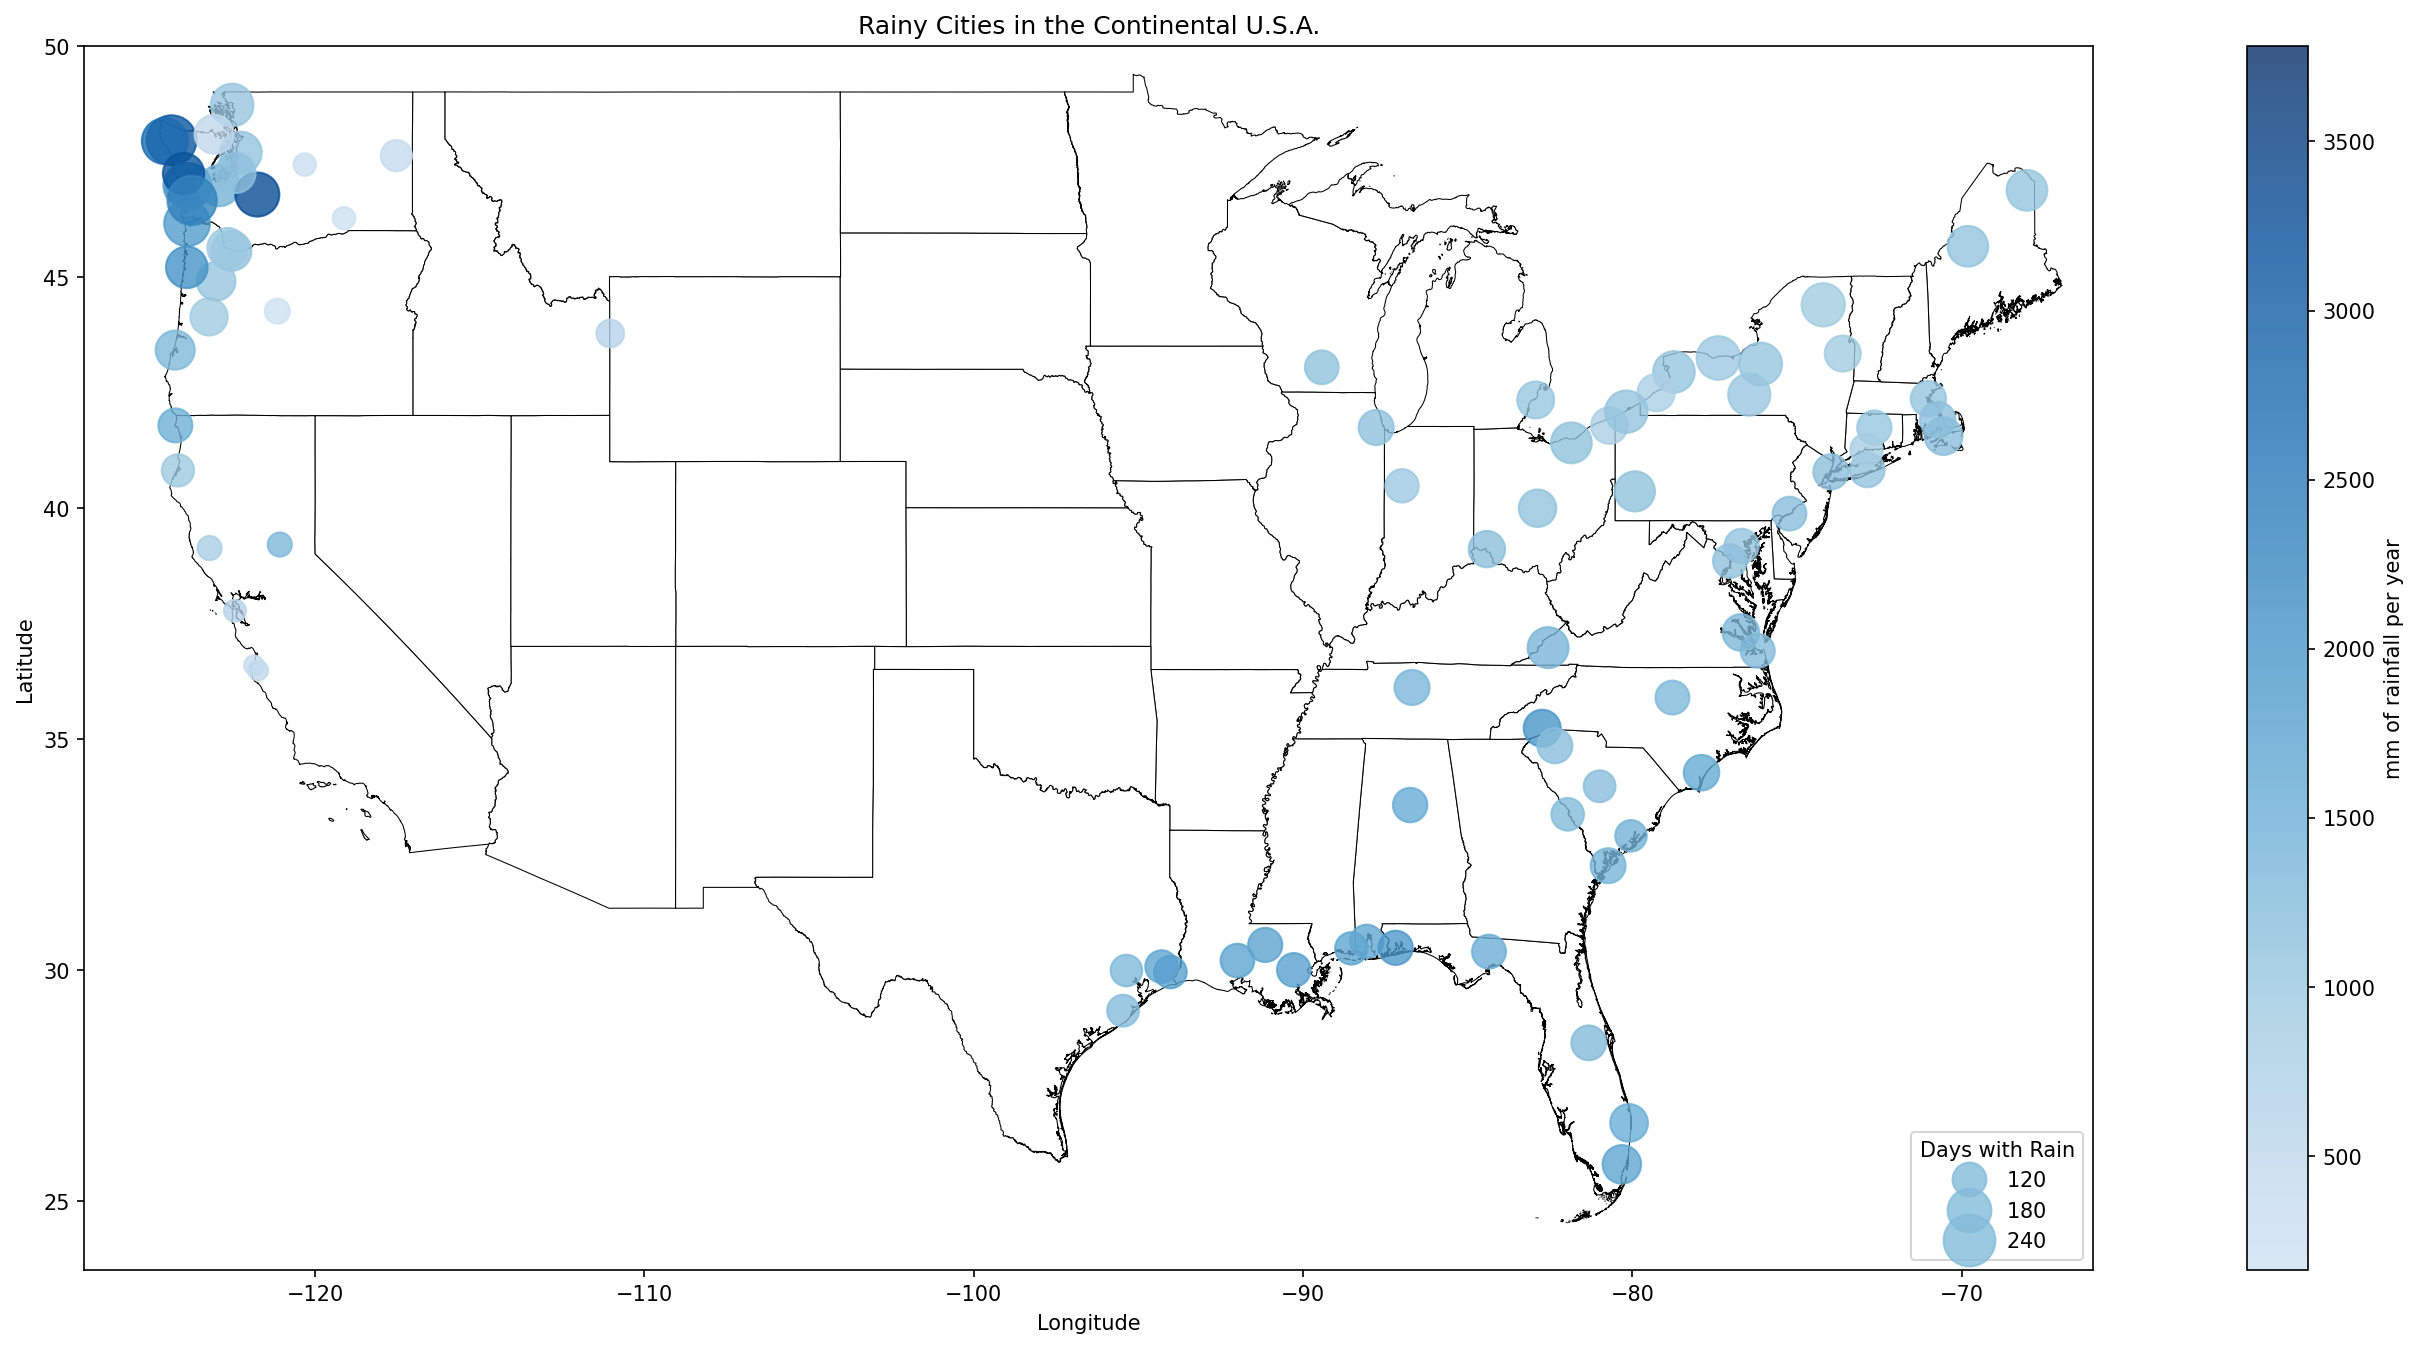
Here are all of the cities (without Annette, AK and Hilo, HI) on a U.S. Map:
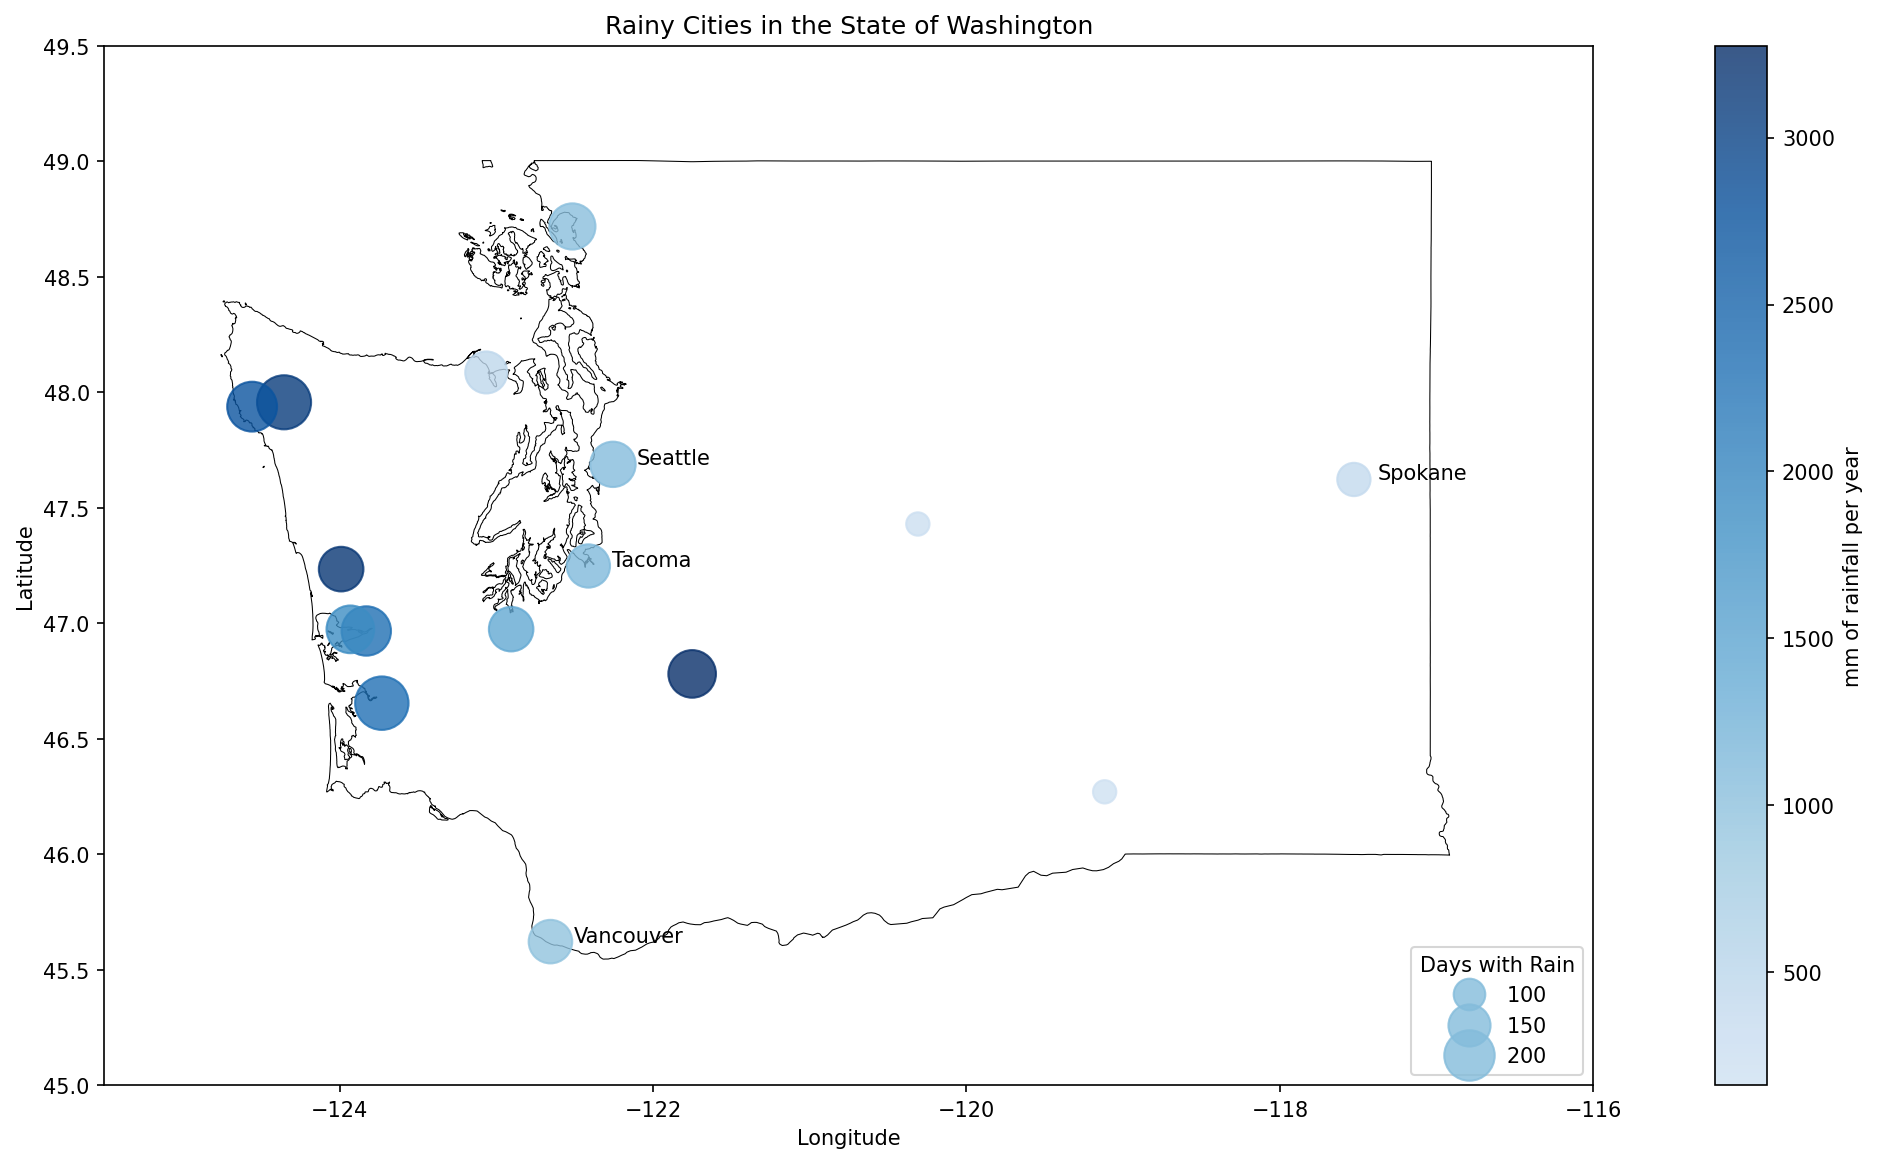
and Washington State as well:
- Precipitation Data Overview on the NOAA website
- Data Access Homepage on the NOAA website
- GSOY data search on the NOAA site
- GSOY data README on the NOAA site
- Weather Stations & their locations on the NOAA site
- Information on the WMS standart from the OGC
- WMS GetCapabilities request for the USGS NBD
- OWSLib Documentation (helpful python library)
1. Weather station may not be representative of entire city. Especially with measurements like days with fog, which is a spotty phenomenon, you could be living somewhere around a city, but just not close enough to the weather station to see what they report. For example, in Cleveland, if you live a few miles from Lake Erie, you will be much less likely to see fog than the weather station close to Lake Erie. - Sample size is small. I am only sampling 2012-2021 here, 10 years. I wish I could sample back into the 70's or so, but there are too many fragmented datasets to pick a larger range, so 11 years of data will have to do. If I am curious about comparing a few cities furthere, I may use Global Summary of the Month (GSOM) data to look further. Also, in an ideal project, I would be taking measurements from several weather stations and aggregate them somehow to be more representative of a general area. Although, since there are quite a few small towns with relatively sparse data available, that restriction would take most of them out of the dataset. - Because of the scope of this project, it is generally not correct to use these results to make comparative statements between these towns and the U.S. This dataset was hand-selected and is skewed towards notoriously rainy places, so it wouldn't really be honest to say "Lafayette gets low rain" because it is only being compared to the upper echelon of rainy places in the USA. There are so many towns that are left out, for various reasons, and we don't know how the addition of these towns would change the distribution.


