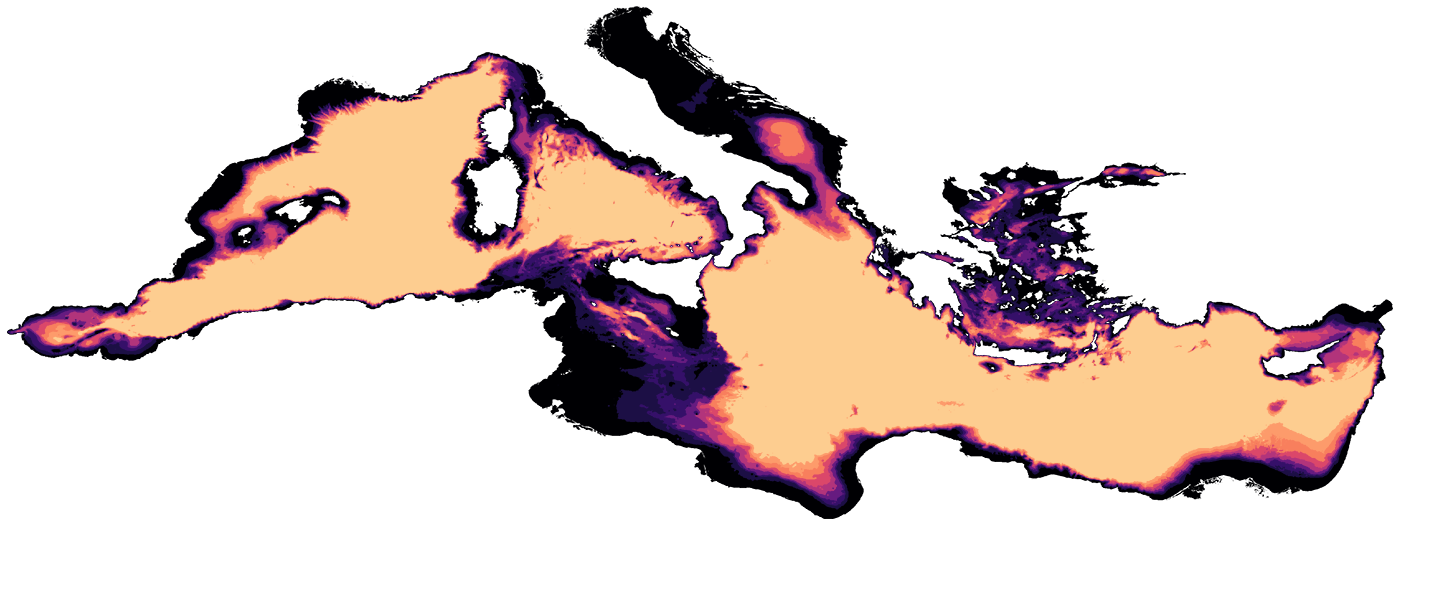
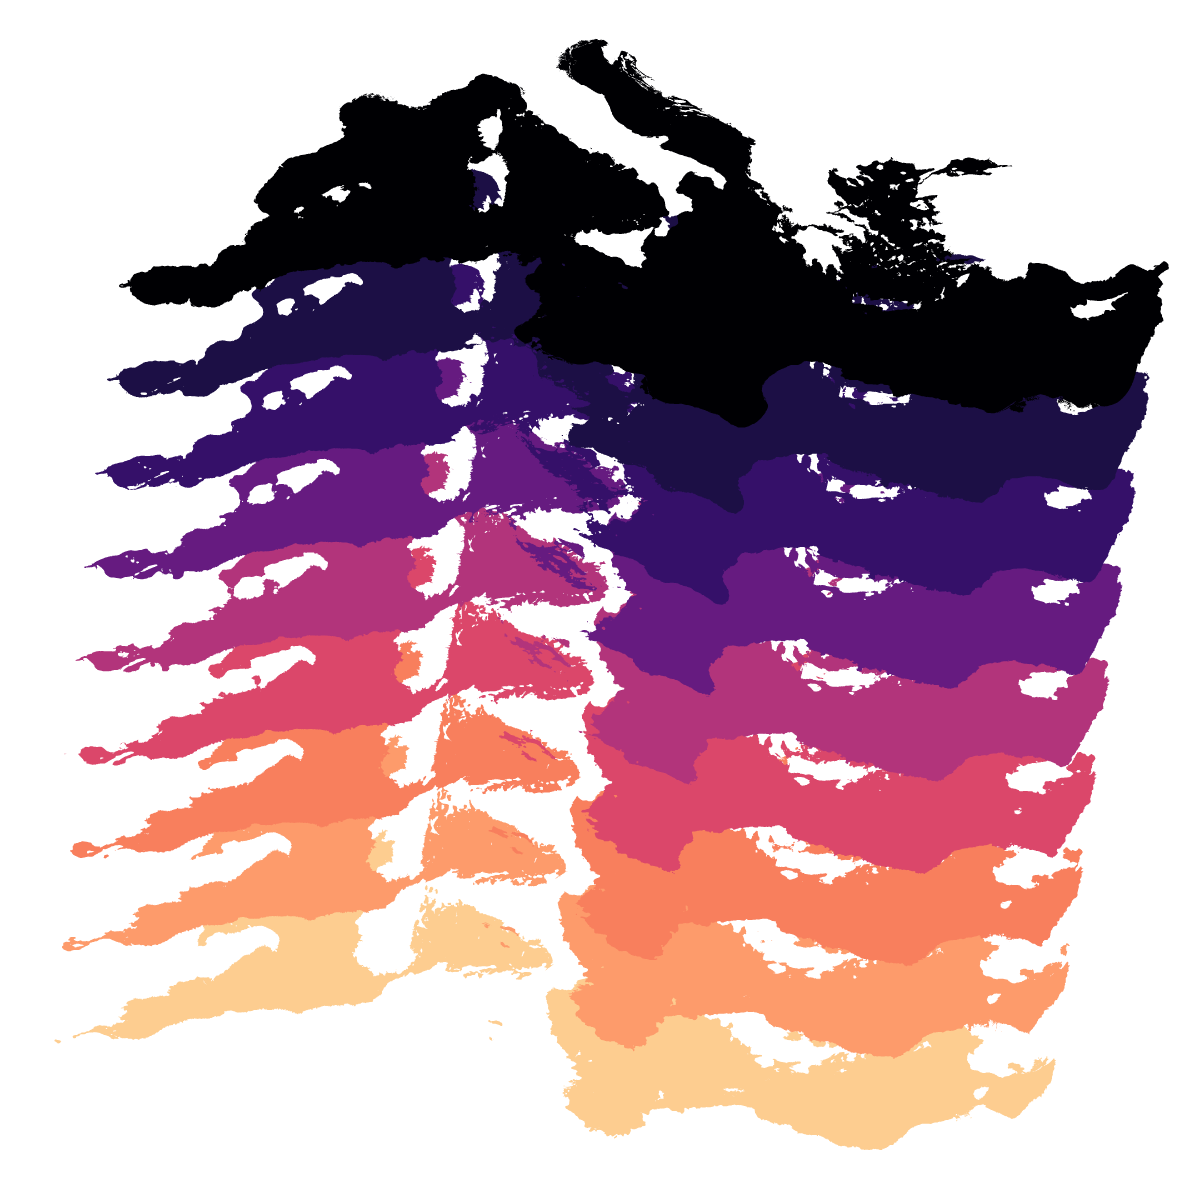
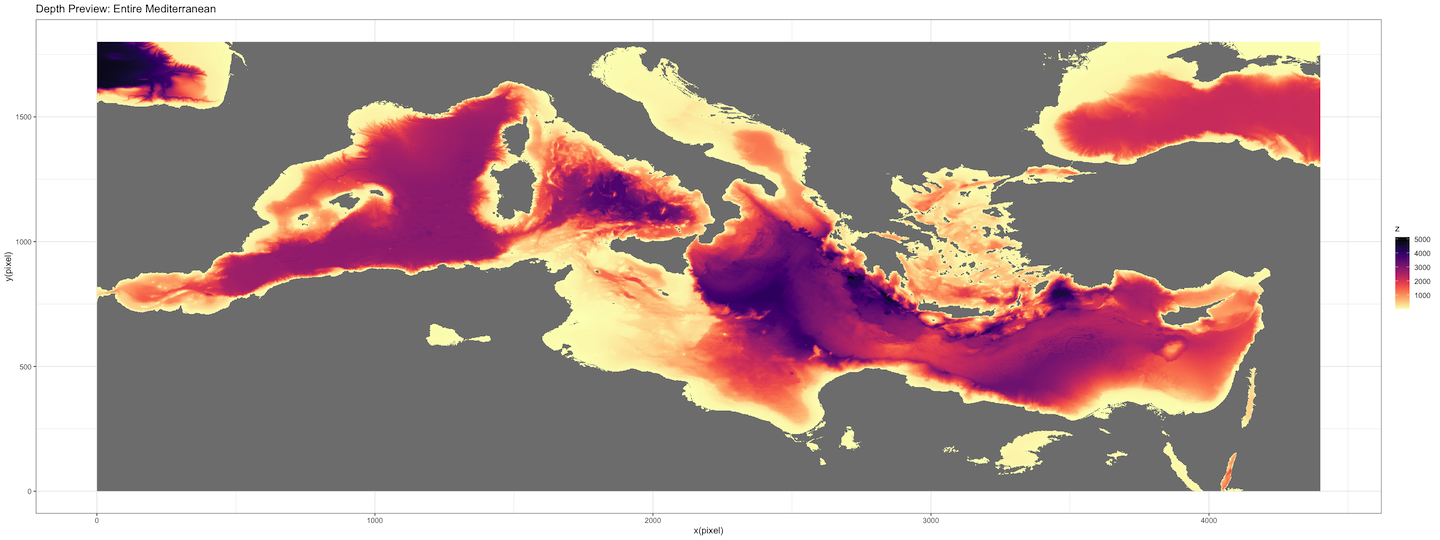
The code in this repo approximately maps how the Mediterranean Sea shrunk during the Messinian salinity crisis with modern bathymetric data. Also, if you're curious, "bathymetry" means "depth measurement", so it is sort of like topography for the bottom of the ocean.
I'd like to learn R, and to learn a bit more about geospatial data. If I'm a data scientist, it's about time I learn some R, and if I'd like to do work concerning the environment, then it's about time I learn how to work with geospatial data. I'd also like to have some high-resolution images of the Mediterranean sinking for the logo for another project (@Salinity-Crisis-Interactive).
The real work of this project exists in the notebook ./wcs_contour_functions.ipynb and ./contour_funnctions.r. Also, there are some post-processing functions in ./util/.
The rest of the scripts in ./r_tutorial/ and ./r_development/ were just used to explore tools and create some interesting figures.
- R
- Python
- Jupyter
I've included an R script, installs.r, which you may just run in your REPL with
source("installs.r")if you'd like to install the libraries required to run my code. Ι'm also working on publishing an R package with GitHub packages.
Bathymetric data collected by many organizations & provided over the web by the European Commission's European Marine Observation and Data Network (EMODnet).
Embarking on this project forced me to learn what a lot of this stuff is, and I don't want anyone to get confused, so here is my brief overview:
The European Commission (a governing body in the European Union) funds/organizes a network of different oceanographic entities called European Marine Observation and Data Network (EMODnet). EMODnet has central hub of web services, called the Online Web Services (OWS). It hosts all sorts of geospatial marine data, like Plankton density, bathymetry (sea basin topography), and geologic surveys, often in several different data formats and protocols.
The EMODnet OWS has quite a few different types of data download services available. This repository takes advantage of just two:
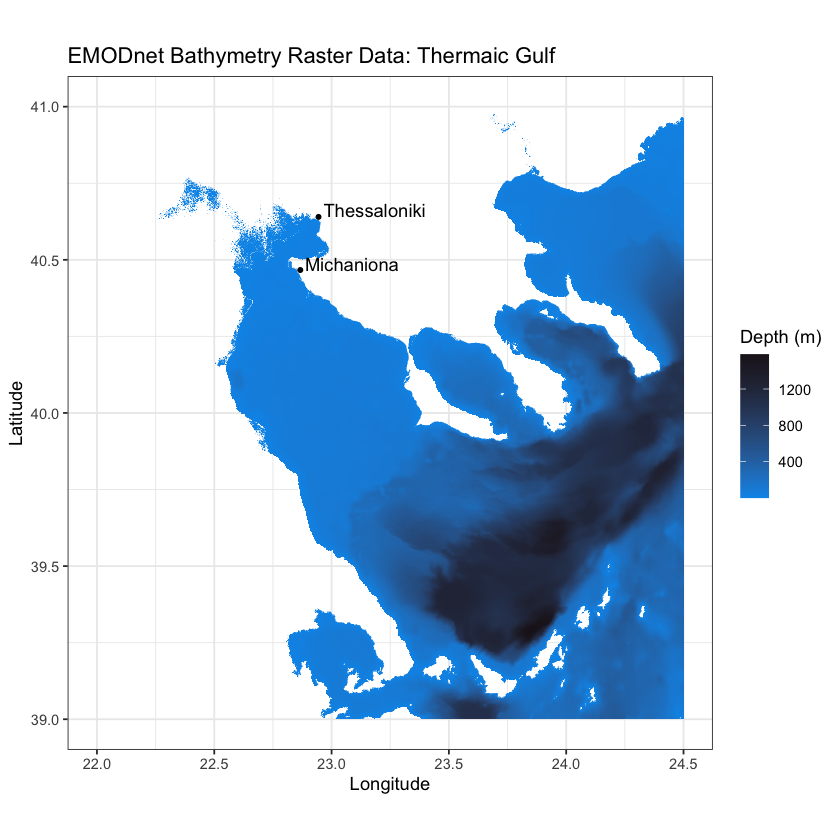
The **Web Coverage Service (WCS) is an implementation of data accessible over the internet. It is called WCS because it complies with the Open Geospatial Consortium (OGC)'s extremely complicated requirements to be a WCS. The OGC is some kind of cooperative entity that is supposed to create standards to make geospatial data more accessible. EMODnet has some data that is only available through their WCS, like raster data. See link.
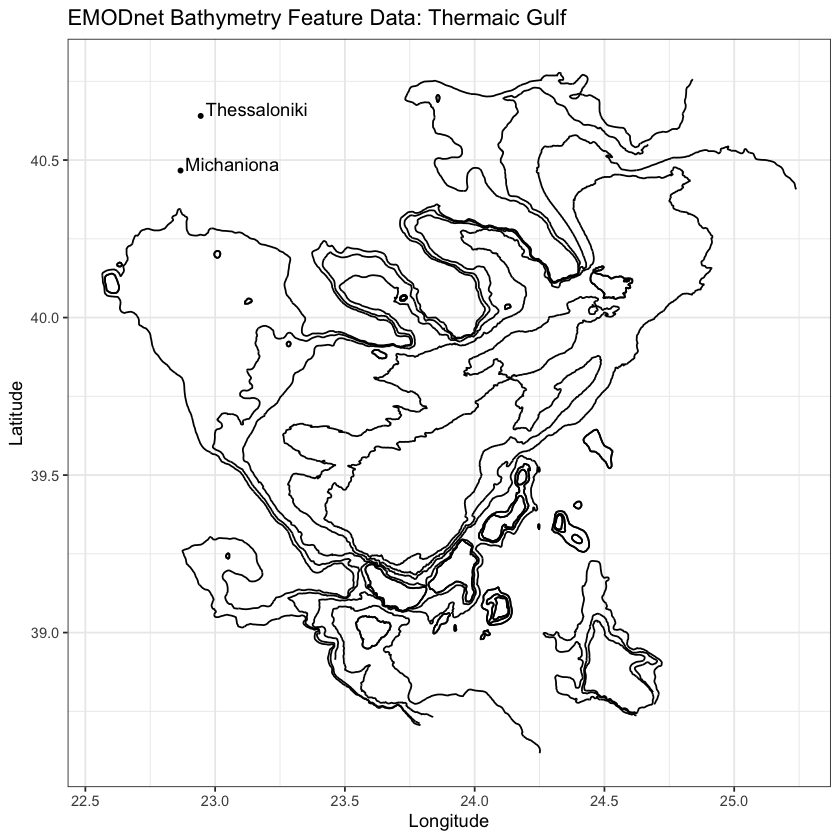
The **Web Feature Service (WFS) is different implementation of data accessible over the internet. It is called WFS because it complies with the OGC's extremely complicated requirements to be a WFS. Again, certain data is only accessible through the WFS, like features and vector data. See link.
Using WFS and WCS are very similar. You pass all of the input data to the service via a URL. This is data such as coordinates to specify the area you'd like the data for, resolution, service type, file format, etc. Here is an example WCS request:
A server on their end will do some work, and then you should have a JSON, or a TIFF, or some kind of file returned to you by that call.
On the OWS page I keep referencing, they list a bunch of calls you can make to the server to show capabilities in an XML metadata format for some reason. BUT, these example R notebooks that EMODnet compiled give a lot of guidance as well.
Several of the spatial data packages used in the EMODnet OWS tutorial, such as rgdal and maptools are out-of-maintenance or not on C.R.A.N. anymore. Some of their functionality has been absorbed into terra (kind of a master geospatial library) and sf. Most of the functionality seems to remain, but switching over from the methods they used is somewhat difficult because they just handle data with different R objects, etc. Just be warned that certain functions like rgdal::readOGR() are no longer maintained, and spiritually replaced by methods like terra::vect().
Stitched-together tiles of WCS bathymetry raster data:
Contours from sea-level to 1500m, colored accordingly, with non-Mediterranean bodies of water removed:
