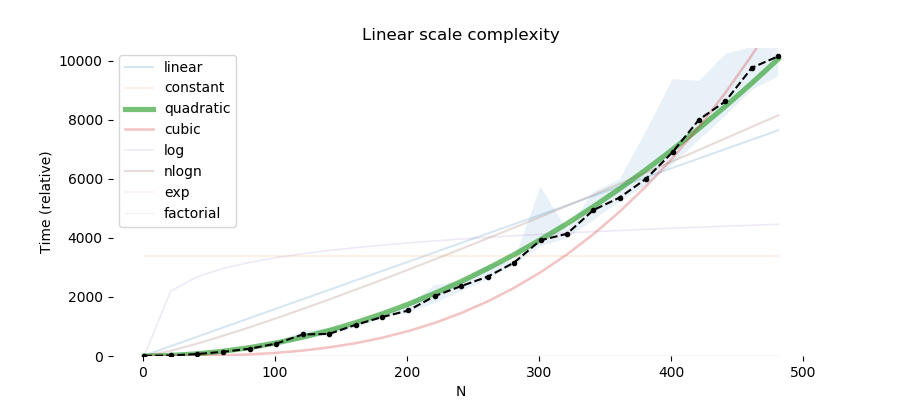
Simple plots of the time complexity of a function using timeit. Runs a function with one parameter n a number of times, and
plots the runtime as a function of n. Also fits various standard complexities, and gives a report on the most likely time complexity.
def quadratic_time(n):
    s = 0
    for i in range(n):
        for j in range(n):
            s = s + 1

complexity_graph(quadratic_time, ns=range(1, 500, 20), reps=12, number=6)Scores for quadratic_time
quadratic 42.7%
nlogn 17.5%
cubic 13.7%
linear 13.3%
log 5.4%
constant 4.5%
exp 2.9%
factorial 0.0%
complexity_graph(fn, ns, reps=20, number=1000, shuffle=True, setup="pass", extra_globals={})
This function calls time_complexity (to time the execution runs), then score_report (to fit each possible complexity curve) and plot_complexity (to plot the graph),
all in one go.
-
Parameters:
-
fn: function to run. This function must take one exactly one argumentn, which specifies the "size" of the problem. -
ns: The values for n to use, as a sequence. Usually something like range(1, 1000, 100) -
number: number of times to run each function inside the timeit loop -
reps: number of repetitions of the entire run to do. This is important to reduce
variance in the estimates -
shuffle: If True, the order of ns is shuffled before eachrep. This helps reduce correlated variations in the results and can result in lower noise -
setup: string, representing code to be executed at the start of each invocation of the fn loop (i.e. once pernumberloops). Defaults to "pass". -
extra_globals: any extra variables to be available to fn or setup during execution, as a dictionary.
-
Note that fn will be run number x len(ns) x reps times to compute the result. For example, with ns=[1, 2, 3] and number=3, reps=2, the following calls would be made:
# rep 1
fn(1)
fn(1)   # n = 1, 3 times
fn(1)

fn(2)
fn(2)   # n = 2, 3 times
fn(2)

fn(3)
fn(3)
fn(3)


# rep 2
fn(1)
fn(1)
fn(1)

fn(2)
fn(2)
fn(2)

fn(3)
fn(3)
fn(3)
If shuffle were True, then the order of [1,2,3] would be shuffled. Typically, number should be relatively large (>50) and reps should be moderate (5-50) but this does vary depending on the problem. With small number or reps variation in timing caused by background processes or hardware fluctuations (e.g. thermal throttling) will make it hard to reliably identify the complexity curves.
- It is hard to distinguish O(N) from O(N log N) without a very large range of
n. - For complexities of cubic and beyond, only very small
nare practical, for obvious reasons! - Be aware the real-world measurements are noisy, and reasonable settings for
numberandrepsare required to get stable results.
