WARNING: A work in progress!
ATTENTION
If you like this project, and you would like to have more plans and providers in the comparison, please take a look at this issue.
A comparison between some VPS providers that have data centers located in Europe.
Initially I’m comparing only entry plans, below 5$ monthly.
What I trying to show here it’s basically a lot of things that I would want to know before sign up with any of them. If I save you a few hours researching, like I spend, I’ll be glad!
| OVH | Linode | DigitalOcean | Scaleway | Vultr | |
|---|---|---|---|---|---|
| Foundation | 1999 | 2003 | 2011 | 2013 | 2014 |
| Headquarters | Roubaix (FR) | Galloway, NJ (US) | New York (US) | Paris (FR) | Matawan, NJ (US) |
| Market | 3° largest | 2° largest | |||
| Website | OVH | Linode | DigitalOcean | Scaleway | Vultr |
Notes:
- The companies are sorted by the year of foundation.
- Linode was spun-off from a company providing ColdFusion hosting (TheShore.net) that was founded in 1999.
- Scaleway is a cloud division of Online.net (1999), itself subsidiary of the Iliad group (1990) owner also of the famous French ISP Free.
- Vultr Holdings LLC is owned by Choopa LLC founded in 2000.
- The Market numbers are extracted from the Wikipedia an other sources
| OVH | Linode | DigitalOcean | Scaleway | Vultr | |
|---|---|---|---|---|---|
| Credit Card | Yes | Yes | Yes | Yes | Yes |
| PayPal | Yes | Yes | Yes | No | Yes |
| Bitcoin | No | No | No | No | Yes |
| Affiliate/Referral | Yes | Yes | Yes | No | Yes |
| Coupon Codes | Yes | Yes | Yes | Yes | Yes |
Note:
- Linode needs a credit card associated with the account first to be able to pay with PayPal later.
| OVH | Linode | DigitalOcean | Scaleway | Vultr | |
|---|---|---|---|---|---|
| European data centers | 3 | 2 | 3 | 2 | 4 |
| Documentation | Docs | Docs | Docs | Docs | Docs |
| Doc. subjective valuation | 6/10 | 9/10 | 9/10 | 6/10 | 8/10 |
| Uptime guaranteed (SLA) | 99,95% | 99,9% | 99,99% | 99,9% | 100% |
| Outage refund/credit (SLA) | Yes | Yes | Yes | No | Yes |
| API | Yes | Yes | Yes | Yes | Yes |
| API Docs | API Docs | API Docs | API Docs | API Docs | API Docs |
| Services status page | Status | Status | Status | Status | Status |
| Support Quality | |||||
| Account Limits | 10 instances | Limited instances (e.g. 50 VC1S ) | 10 instances | ||
| Legal/ToS | ToS | ToS | ToS | ToS | ToS |
Note:
- Scaleway has four grades of SLA, the first basic is for free but if you want something better, you have to pay a monthly fee.
- One of the reasons why the Linode’s documentation is so good and detailed is that they pay you 250$ for write a guide for them if it’s good enough to publish. They are a small team (about 70 people), so it makes sense.
- The Linode API is not a RESTful API yet, but they are working in an upcoming one.
- The default limits usually can be increased by asking support, but not in Scaleway, where you would have to pay fo a higher level of support. Those limits are set by default by the providers to stop abusing the accounts.
- Scaleway also imposes a lot more of limits that can be looked up in the account settings (e.g. 100 images or 25 snapshots).
- Vultr also impose a limit of a maximum instance cost of 150$ per month and requires a deposit when charges exceed 50$.
- OVH: Gravelines (FR), Roubaix (FR), Strasbourg (FR). It has also a data center in Paris (FR), but is not available for these plans.
- Linode: Frankfurt (DE), London (GB)
- DigitalOcean: Amsterdam (NL), Frankfurt (DE), London (GB)
- Scaleway: Amsterdam (NL), Paris (FR)
- Vultr: Amsterdam (NL), Frankfurt (DE), London (GB), Paris (FR)
| OVH | Linode | DigitalOcean | Scaleway | Vultr | |
|---|---|---|---|---|---|
| Subjective control panel evaluation | 5/10 | 6/10 | 8/10 | 5/10 | 9/10 |
| Graphs | Traffic, CPU, RAM | CPU, Traffic, Disk IO | CPU, RAM, Disk IO, Disk usage, Bandwith, Top | No | Monthly Bandwith, CPU, Disk, Network |
| Subjective graphs valuation | 5/10 | 8/10 | 9/10 | 0/10 | 8/10 |
| Monthly usage per instance | No | Yes | No | No | Bandwith, Credits |
| KVM Console | Yes | Yes (Glish) | Yes (VNC) | Yes | Yes |
| Power management | Yes | Yes | Yes | Yes | Yes |
| Reset root password | Yes | Yes | Yes | No | No |
| Reinstall instance | Yes | Yes | Yes | No | Yes |
| First provision time | Several hours | <1 min | <1 min | some minutes | some minutes |
| Median reinstall time | ~12,5 min | ~50 s | ~35 s | N/A | ~2,1 min |
| Upgrade instance | Yes | Yes | Yes | No | Yes |
| Change Linux Kernel | No | Yes | CentOS | Yes | No |
| Recovery mode | No | Yes | Yes | Yes | Boot with custom ISO |
| Tag instances | No | Yes | Yes | Yes | Yes |
| Responsive design (mobile UI) | No | No | No | No | Yes |
| Android App | Only in France | Yes | Unofficial | No | Unofficial |
| iOS App | Yes | Yes | Unofficial | No | Unofficial |
Notes:
- The OVH panel has a very old interface, effective but antique and cumbersome.
- Linode also has an old interface, too much powerful, but not friendly. But in the coming months they are going to deliver a new control panel in Beta.
- Linode let you choose the Linux Kernel version in the profile of your instance.
- To reset the root password from the control panel is not a good security measure IMHO, it’s useful, but you already have the KVM console for that.
- In Vultr you can copy/see the masked default root password, but not reset it. This is necessary because the password is never sent by email.
- You can reinstall the instances using the same SO/App or choosing another one.
- Linode reinstall time (they call it rebuild) does not include the boot time, the instance is not started automatically.
- In Vultr can use a custom ISO or choose one from the library like SystemRescueCD or Trinity Rescue Kit to boot your instance and perform recovery tasks.
- Linode has an additional console (Lish) that allows you to control your instance even when is inaccessible by ssh and perform rescue or management tasks.
- In Scaleway you have to set a root password first to get access to the KVM console.
- The Scaleway’s control panel in the basic account/SLA level is very limited and counter-intuitive, I don’t know if this improves with superior levels.
- In Scaleway happened to me once that the provision time exceed more than 45 min that I have to cancel the operation (that it was not easy, though).
- In OVH the first provision of a VPS server it’s a manual process and you have to pass a weird identification protocol on the way, including an incoming phone call in my case.
| OVH | Linode | DigitalOcean | Scaleway | Vultr | |
|---|---|---|---|---|---|
| Linux | Arch Linux, CentOS, Debian, Ubuntu | Arch, CentOS, Debian, Fedora, Gentoo, OpenSUSE, Slackware, Ubuntu | CentOS, Debian, Fedora, Ubuntu | Alpine, CentOS, Debian, Gentoo, Ubuntu | CentOS, Debian, Fedora, Ubuntu |
| BSD | No | No | FreeBSD | No | FreeBSD, OpenBSD |
| Windows | No | No | No | No | Windows 2012 R2 (16$) or Windows 2016 (16$) |
| Other OS | No | No | CoreOS | No | CoreOS |
Note:
- OVH also offers Linux two desktop distributions: Kubuntu and OVH Release 3.
| OVH | Linode | DigitalOcean | Scaleway | Vultr | |
|---|---|---|---|---|---|
| Docker | Yes | No | Yes | Yes | Yes |
| Stacks | LAMP | No | LAMP, LEMP, ELK, MEAN | LEMP, ELK | LAMP, LEMP |
| Drupal | Yes | No | Yes | Yes | Yes |
| WordPress | Yes | No | Yes | No | Yes |
| Joomla | Yes | No | No | No | Yes |
| Django | No | No | Yes | No | No |
| RoR | No | No | Yes | No | No |
| GitLab | No | No | Yes | Yes | Yes |
| Node.js | No | No | Yes | Yes | No |
| E-Commerce | PrestaShop | No | Magento | PrestaShop | Magento, PrestaShop |
| Personal cloud | Cozy | No | NextCloud, ownCloud | OwnCloud, Cozy | NextCloud, ownCloud |
| Panels | Plesk, cPanel | No | No | Webmin | cPanel (15$), Webmin |
Notes:
- Some providers offer more one-click Apps that I do not include here to save space.
- Some of this apps in some providers require a bigger and more expensive plan that the entry ones below 5$ that I analyze here.
- Linode does not offers you any one-click app. Linode is old-school, you can do it yourself, and also Linode gives you plenty of detailed documentation to do it that way.
- OVH uses Ubuntu, Debian or CentOS as SO for its apps.
- Digital Ocean uses Ubuntu as SO for all of its apps.
- Vultr uses CentOS as SO for all of its apps.
- OVH Also offers Dokku on Ubuntu.
- Do you really need a Panel (like cPanel)? They usually are a considerable security risk with several vulnerabilities and admin rights.
| OVH | Linode | DigitalOcean | Scaleway | Vultr | |
|---|---|---|---|---|---|
| ISO images library | No | No | No | No | Yes |
| Custom ISO image | No | Yes | No | Yes | Yes |
| Install scripts | No | StackScripts | Cloud-init | No | iPXE |
| Preloaded SSH keys | Yes | No | Yes | Yes | Yes |
Notes:
- Linode lets you install virtually any SO in your instance in the old-school way, almost as if you’d have to deal with the bare metal. Even when the instance does not boot itself at the end, you have to boot it yourself from the control panel.
- The Vultr’s ISO image library include several ISOs like Alpine, Arch, Finnix, FreePBX, pfSense, Rancher Os, SystemRescueCD, and Trinity Rescue Kit.
- The Vultr’s “Custom ISO image” feature allows you to install virtually any SO supported by KVM and the server architecture.
- Linode does not preload your ssh keys into the instance automatically, but it’s trivial to do it manually anyway (ssh-copy-id).
- Scaleway has a curious way to provide custom images, a service called Image Builder. You have to create an instance with the Image Builder and from there you are able to create you own ISO image using a Docker builder system that create images that can run on real hardware.
| OVH | Linode | DigitalOcean | Scaleway | Vultr | |
|---|---|---|---|---|---|
| 2FA | Yes | Yes | Yes | Yes | Yes |
| Restrict access IPs | Yes | Yes | No | No | No |
| Account Login Logs | No | Partial | Yes | No | No |
| SSL Quality | A- | A+ | A+ | A | A |
| DNS SPY Report | B | B | B | B | C |
| HTTP Security headers | F | E | C | F | D |
| Send root password by email | Yes | No | No | No | No |
| Account password recovery | Link | Link | Link | Link | Link |
Notes:
- Send plain text passwords by email is a very bad practice in terms of security.
- OVH sends you the root password optionally if you use SSH keys, always in plain text if not.
- Linode never sends you the root password because you are the one that sets it (even boot the instance for first time).
- DigitalOcean sends you the passwords only if you don’t use SSH keys, in plain text.
- Vultr never sends you the root password, only the needed ones for one-click apps.
- Linode only register the last login time for each user, and does not register the IP.
- The account password recovery should be always through a reset link by email, and never get you current password back (and in plain text), but you never know… and if you find a provider doing that, you don’t need to know anymore, get out of there as soon as possible and never reuse that password (any password).
- DNS Spy Report is very useful to those that are going to use the provider to manage their domains.
| OVH | Linode | DigitalOcean | Scaleway | Vultr | Vultr | |
|---|---|---|---|---|---|---|
| Name | VPS SSD 1 | Linode 1024 | 5bucks | VC1S | 20GB SSD | 25GB SSD |
| Monthly Price | 3,62€ | 5$ | 5$ | 2,99€ | 2,5$ | 5$ |
| CPU / Threads | 1/1 | 1/1 | 1/1 | 1/2 | 1/1 | 1/1 |
| CPU model | Xeon E5v3 2.4GHz | Xeon E5-2680 v3 2.5GHz | Xeon E5-2650L v3 1.80 GHz | Atom C2750 2.4 GHz | Intel Xeon 2.4 GHz | Intel Xeon 2.4 GHz |
| RAM | 2 GB | 1 GB | 512 MB | 2 GB | 512 MB | 1 GB |
| SSD Storage | 10 GB | 20 GB | 20 GB | 50 GB | 20 GB | 25 GB |
| Traffic | ∞ | 1 TB | 1 TB | ∞ | 500 GB | 1 TB |
| Bandwidth (In / Out) | 100/100 Mbps | 40/1 Gbps | 1/10 Gbps | 200/200 Mbps | 1/10 Gbps | 1/10 Gbps |
| Virtualization | KVM | KVM (Qemu) | KVM | KVM (Qemu) | KVM (Qemu) | KVM (Qemu) |
| Anti-DDoS Protection | Yes | No | No | No | 10$ | 10$ |
| Backups | No | 2$ | 1$ | No | 0,5 $ | 1$ |
| Snapshots | 2,99$ | Free (up to 3) | 0,05$ per GB | 0,02 € per GB | Free (Beta) | Free (Beta) |
| IPv6 | Yes | Yes | Optional | Optional | Optional | Optional |
| Additional public IP | 2$ (up to 16) | Yes | Floating IPs (0,006$ hour if inactive) | 0,9€ (up to 10) | 2$ (up to 2) / 3$ floating IPs | 2$ (up to 2) / 3$ floating IPs |
| Private Network | No | Optional | Optional | No (dynamic IPs) | Optional | Optional |
| Firewall | Yes (by IP) | No | Yes (by group) | Yes (by group) | Yes (by group) | Yes (by group) |
| Block Storage | From 5€ - 50GB | No | From 10$ - 100GB | From 1€ - 50GB | From 1$ - 10GB | From 1$ - 10GB |
| Monitoring | Yes (SLA) | Yes (metrics, SLA) | Beta (metrics, performance, SLA) | No | No | No |
| Load Balancer | 13$ | 20$ | 20$ | No | High availability (floating IPs & BGP) | High availability (floating IPs & BGP) |
| DNS Zone | Yes | Yes | Yes | No | Yes | Yes |
| Reverse DNS | Yes | Yes | Yes | Yes | Yes | Yes |
Note:
- OVH hides its real CPU, but what they claim in their web matches with the hardware information reported in the tests (an E5-2620 v3 or E5-2630 v3).
- Vultr also hides the real CPU, but it could be a Xeon E5-2620/2630 v3 for the 20GB SSD plan and probably a v4 for the 25GB SSD one.
- Vultr $2.50/month plan is only currently available in Miami, FL and New York, NJ.
- OVH throttle network speed to 1 Mbps after excess monthly 10 TB traffic
- The prices for DigitalOcean and Vultr do not include taxes (VAT) for European countries.
- Linode allows you to have free additional public IPs but you have to request them to support and justify that you need them.
- Linode Longview’s monitoring system is free up to 10 clients, but also has a professional version that starts at 20$/mo for three client.
- Linode don’t support currently block storage, but they are working on it to offer the service in the upcoming months.
- Linode snapshots (called Images) are limited to 2GB per Image, with a total of 10GB total Image storage and 3 Images per account. Disks of recently rebuilt instances are automatically stored as Images.
- Scaleway also offers for the same price a BareMetal plan (with 4 ARM Cores), but as it is a dedicated server, I do not include it here.
- Scaleway does not offers Anti-DDoS protection but they maintain that they use the Online.net’s standard one.
- Scaleway uses dynamic IPs by default as private IPs and you only can opt to use static IPs if you remove the Public IP from the instance.
- Scaleway uses dynamic IPv6, meaning that IPv6 will change if you stop your server. You can’t even opt to reserve IPv6.
All the numbers showed here can be founded in the /logs folder in this
repository, keep in mind that usually I show averages of several iterations of
the same test.
The graphs are generated with gnuplot directly from the tables of this
README.org org-mode file. The tables are also automatically generated with a
python script (/ansible/roles/common/files/gather_data.py) gathering the data
contained in the log files. To be able to add more tests without touching the
script, the criteria to gather the data and generate the tables are stored in a
separate json file (/ansible/roles/common/files/criteria.json). The output of
that script is a /logs/tables.org file that contain tables likes this:
|-
| | Do-5Bucks-Ubuntu | Linode-Linode1024-Ubuntu | Ovh-Vpsssd1-Ubuntu | Scaleway-Vc1S-Ubuntu | Vultr-20Gbssd-Ubuntu | Vultr-25Gbssd-Ubuntu
|-
| Lynis (hardening index) |59 | 67 | 62 | 64 | 60 | 60
| Lynis (tests performed) |220 | 220 | 220 | 225 | 230 | 231
|-
That does not seems like a table, but thanks to the awesome org-mode table
manipulation features, only by using the Ctrl-C Ctrl-C key combination that
becomes this:
|-------------------------+------------------+--------------------------+--------------------+----------------------+----------------------+----------------------|
|                         | Do-5Bucks-Ubuntu | Linode-Linode1024-Ubuntu | Ovh-Vpsssd1-Ubuntu | Scaleway-Vc1S-Ubuntu | Vultr-20Gbssd-Ubuntu | Vultr-25Gbssd-Ubuntu |
|-------------------------+------------------+--------------------------+--------------------+----------------------+----------------------+----------------------|
| Lynis (hardening index) |               59 |                       67 |                 62 |                   64 |                   60 |                   60 |
| Lynis (tests performed) |              220 |                      220 |                220 |                  225 |                  230 |                  231 |
|-------------------------+------------------+--------------------------+--------------------+----------------------+----------------------+----------------------|
And finally using also a little magic from org-mode, org-plot and gnuplot, that
table would generate automatically a graph like the ones showed here with only a
few lines of text (see this file in raw mode to see how) and the Ctrl-c " g
key combination over those lines. Thus, the only manual step is to copy/paste
those tables from that file into this one, and with only two key combinations
for table/graph the job is almost done (you can move/add/delete columns very
easily with org-mode).
There is another python script (/ansible~/roles/common/files/clean_ips.py)
that automatically removes any public IPv4/IPv6 from the log files (only on
those that is needed).
Performance tests can be affected by locations, data centers and VPS host neighbors. This is inherent to the same nature of the VPS service and can vary very significantly between instances of the same plan. For example, in the tests performed to realize this comparison I had found that in a plan (not included here, becasuse is more than $5/mo) a new instance that usually would give a UnixBench index about ~1700 only achieved an UnixBench index of 629,8. That’s a considerable amount of lost performance in a VPS server… by the same price! Also the performance can vary over time, due to the VPS host neighbors. Because of this I discarded any instance that would report a poor performance and only show “typical” values for a given plan.
I have chosen Ansible to automate the tests to recollect information from the VPS servers because once that the roles are write down it’s pretty easy to anyone to replicate them and get its own results with a little effort.
The first thing that you have to do is to edit the /ansible/hosts file to
use your own servers. In the template provided there are not real IPs
present, but serves you as a guide of how to manage them. For example in this
server:
[digitalocean]
do-5bucks-ubuntu          ansible_host=X.X.X.X   ansible_python_interpreter=/usr/bin/python3
You should have to put your own server IP. The interpreter path is only needed when there is not a Python 2 interpreter available by default (like in Ubuntu). Also I’m using the variables per group to declare the default user of a server, and I’m grouping servers by provider. So, a complete example for a new provider using a new instance running Ubuntu should be like this:
[new_provider]
new_provider-plan_name-ubuntu   ansible_host=X.X.X.X   ansible_python_interpreter=/usr/bin/python3

[new_provider:vars]
ansible_user=root
And you can add as many servers/providers as you want. If you are already
familiar with Ansible, you can suit the inventory file (/ansible/hosts) as
you need.
Then, you can start to tests the servers/providers using Ansible by running
the playbook, but should be a good idea to test the access first with a ping
(from the /ansible folder):
$ ansible all -m pingIf it’s the first time that you are SSHing to a server, you are probably
going to be asked to add it to the ~/.ssh/known_hosts file.
Then you can easily execute all the tasks in a server by:
$ ansible-playbook site.yml -f 6With the -f 6 option you can specify how many forks you want to create to
execute the tasks in parallel, the default is 5 but as I use here 6 VPS plans
I use also 6 forks.
You can also run only selected tasks/roles by using tags. You can list all the available tasks:
$ ansible-playbook site.yml --list-tasksAnd run only the tags that you want:
$ ansible-playbook site.yml -t benchmarkAll the roles are set to store the logs of the tests in the /logs/ folder
using the /logs/server_name folder structure.
WARNING:
All the tests that I include here are as “atomic” as possible, that is that in
every one of them I try to leave the server in a state as close as it was
before perform it, with the exception that I keep the logs. By the way, the
logs are stored in the /tmp folder intentionally because they will disappear
when you reboot the instance. There are three main reasons why I try to make
the tests as atomic as possible and do not take advantage of some common tasks
and perform them only once:
- Some plans have so little disk space available that if I do not erase auxiliary files and packages between tests, they run out of space soon, and worse, some of them until the point of make them unavailable to SSH connections (e.g. OVH), making necessary manual intervention in the control panel and ruining the advantage of the automation that Ansible give us.
- I want as little interference as possible between tests, and try to perform them always in a state close to the default one of the instance. Some of them (e.g. lynis, ports) change their results significantly if they are performed after some of the package/configuration changes that other tests do.
- In this way, and with a clever use of the Ansible tags, you can perform individual tests without the need of execute the entire Ansible playbook.
Perhaps the only major drawback of this approach is that it consumes more time globally when you perform all the tests together.
All the instances were allocated in London (GB), except for OVH VPS SSD 1 in Gravelines (FR) and Scaleway VC1S in Paris (FR).
All the instances were running on Ubuntu 16.04 LTS
Currently the Vultr’s 20GB SSD plan is sold out and is unavailable temporarily, thus I only performed some tests (and some in a previous version) in an instance that I deleted before new ones become unavailable. I have the intention to retake the test as soon as the plan is available again.
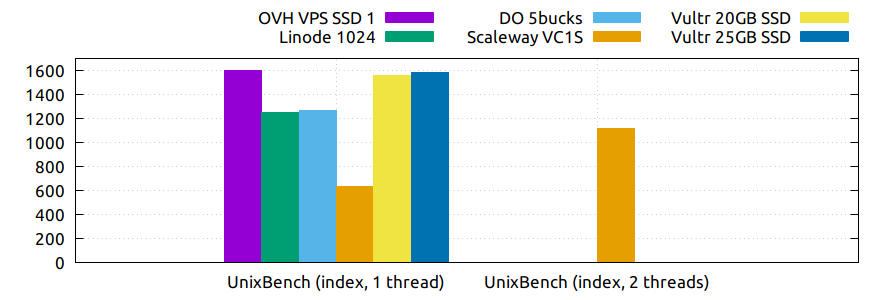
UnixBench as is described in its page:
The purpose of UnixBench is to provide a basic indicator of the performance of a Unix-like system; hence, multiple tests are used to test various aspects of the system’s performance. These test results are then compared to the scores from a baseline system to produce an index value, which is generally easier to handle than the raw scores. The entire set of index values is then combined to make an overall index for the system.
Keep in mind, that this index is very influenced by the CPU raw power, and does not reflect very well another aspects like disk performance. In this index, more is better.
I only execute this test once because it takes some time -about 30-45 minutes depending of the server- and the variations between several runs are almost never significant.
| Plan | OVH VPS SSD 1 | Linode 1024 | DO 5bucks | Scaleway VC1S | Vultr 20GB SSD | Vultr 25GB SSD |
|---|---|---|---|---|---|---|
| UnixBench (index, 1 thread) | 1598.1 | 1248.6 | 1264.6 | 629.8 | 1555.1 | 1579.9 |
| UnixBench (index, 2 threads) | 1115.1 |
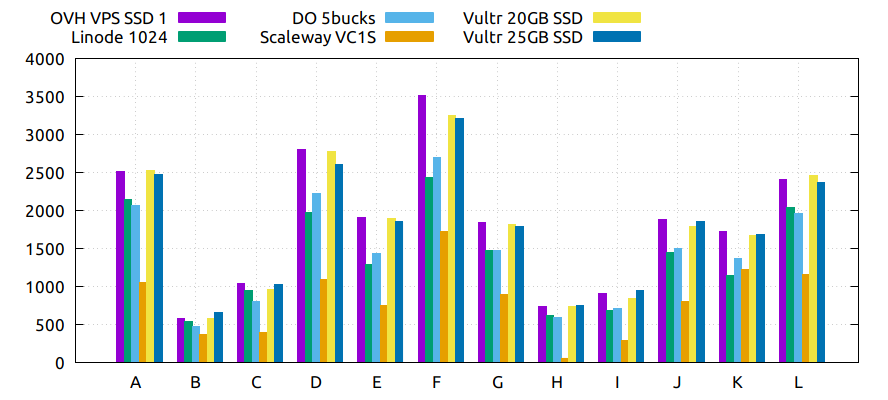
In this table I show the individual tests results that compose the UnixBench benchmark index.
| Plan | OVH VPS SSD 1 | Linode 1024 | DO 5bucks | Scaleway VC1S | Vultr 20GB SSD | Vultr 25GB SSD | |
|---|---|---|---|---|---|---|---|
| Dhrystone 2 using register variables | A | 2510.2 | 2150.0 | 2061.0 | 1057.9 | 2530.5 | 2474.5 |
| Double-Precision Whetstone | B | 583.6 | 539.7 | 474.6 | 367.5 | 578.2 | 656.9 |
| Execl Throughput | C | 1038.9 | 941.8 | 799.5 | 400.0 | 963.8 | 1027.8 |
| File Copy 1024 bufsize 2000 maxblocks | D | 2799.5 | 1972.7 | 2222.5 | 1094.4 | 2775.3 | 2608.8 |
| File Copy 256 bufsize 500 maxblocks | E | 1908.7 | 1286.2 | 1440.1 | 752.6 | 1888.8 | 1851.4 |
| File Copy 4096 bufsize 8000 maxblocks | F | 3507.1 | 2435.6 | 2692.6 | 1729.9 | 3248.4 | 3212.1 |
| Pipe Throughput | G | 1846.5 | 1472.1 | 1468.7 | 894.0 | 1813.6 | 1789.6 |
| Pipe-based Context Switching | H | 744.0 | 623.2 | 597.2 | 60.3 | 739.0 | 746.3 |
| Process Creation | I | 904.5 | 690.5 | 706.8 | 288.2 | 848.1 | 949.9 |
| Shell Scripts (1 concurrent) | J | 1883.2 | 1442.0 | 1501.9 | 801.9 | 1787.8 | 1851.2 |
| Shell Scripts (8 concurrent) | K | 1725.0 | 1144.4 | 1362.7 | 1221.8 | 1665.9 | 1679.1 |
| System Call Overhead | L | 2410.1 | 2034.4 | 1955.6 | 1154.7 | 2461.0 | 2366.4 |
Notes:
- Scaleway VC1S is the only plan that offers two CPU threads, so in the table and the graph I only show the single thread numbers for a more fair comparison.
Notes:
- I’m only using one thread here for Scaleway’s plan, to a more fair comparison.
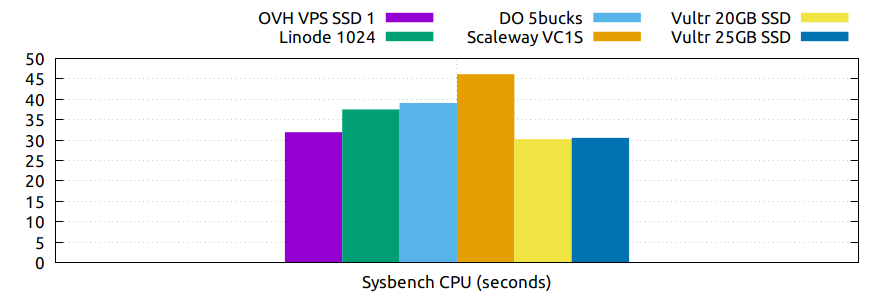
Sysbench is a popular benchmarking tool that can test CPU, file I/O, memory, threads, mutex and MySQL performance. One of the key features is that is scriptable and can perform complex tests, but I rely here on several well-known standard tests, basically to compare them easily to others that you can find across the web.
In this test the cpu would verify a given primer number, by a brute force algorithm that calculates all the divisions between this one and all the numbers prior the square root of it from 2. It’s a classic cpu stress test and usually a more powerful cpu would employ less time in this test, thus less is better.
| Plan | OVH VPS SSD 1 | Linode 1024 | DO 5bucks | Scaleway VC1S | Vultr 20GB SSD | Vultr 25GB SSD |
|---|---|---|---|---|---|---|
| Sysbench CPU (seconds) | 31.922 | 37.502 | 39.080 | 46.130 | 30.222 | 30.544 |
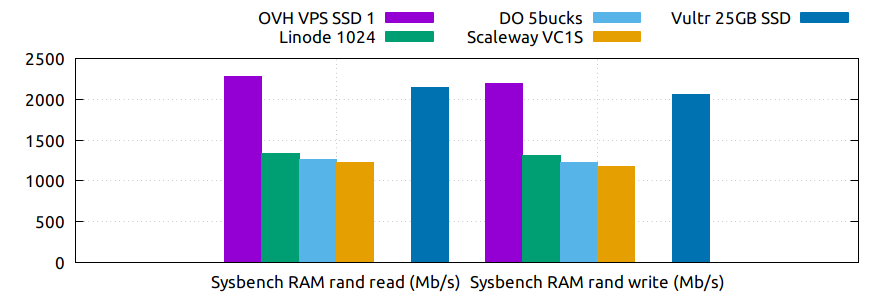
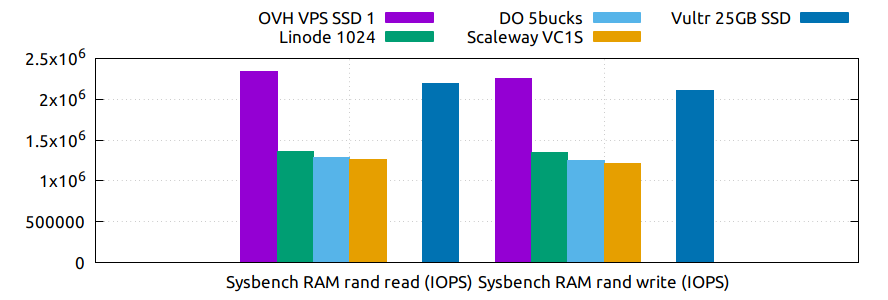
This test measures the memory performance, it allocates a memory buffer and reads/writes from it randomly until all the buffer is done. In this test, more is better.
| Plan | OVH VPS SSD 1 | Linode 1024 | DO 5bucks | Scaleway VC1S | Vultr 20GB SSD | Vultr 25GB SSD |
|---|---|---|---|---|---|---|
| Sysbench RAM rand read (Mb/s) | 2279.750 | 1334.162 | 1262.542 | 1228.898 | 2146.132 | |
| Sysbench RAM rand write (Mb/s) | 2196.174 | 1310.624 | 1221.276 | 1181.516 | 2062.046 |
| Plan | OVH VPS SSD 1 | Linode 1024 | DO 5bucks | Scaleway VC1S | Vultr 20GB SSD | Vultr 25GB SSD |
|---|---|---|---|---|---|---|
| Sysbench RAM rand read (IOPS) | 2334463 | 1366183 | 1292842 | 1258393 | 2197641 | |
| Sysbench RAM rand write (IOPS) | 2248883 | 1342079 | 1250589 | 1209873 | 2111535 |
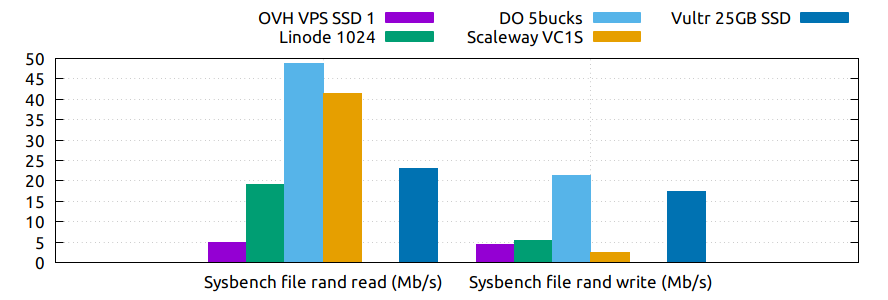
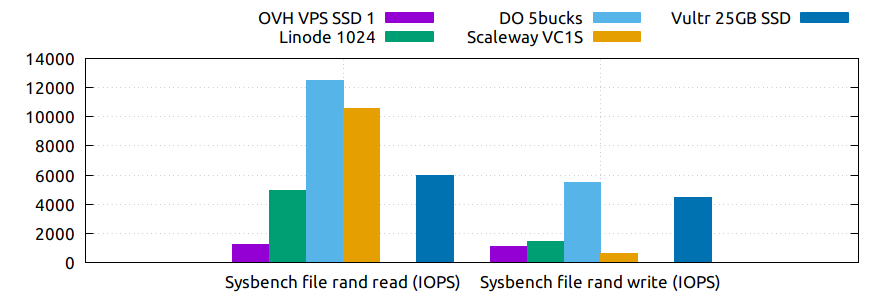
Here is the file system what is put to test. It measures the disk input/output operations with random reads and writes. The numbers are more reliable when the total file size is more greater than the amount of memory available, but due to the limitations that some plans have in disk space I had to restrain that to only 8GB. In this test, more is better.
Notes:
- It’s very clear that something is going on with OVH in this plan, in all the tests like this that I did the numbers were always close to or even exactly 1000 IOPS and around to 4 MB/s. The only explanation to those numbers that occurs to me is that they are limited on purpose. Seems that other clients with this plan does not have this problem, while others complain about the same results I have.
| Plan | OVH VPS SSD 1 | Linode 1024 | DO 5bucks | Scaleway VC1S | Vultr 20GB SSD | Vultr 25GB SSD |
|---|---|---|---|---|---|---|
| Sysbench file rand read (Mb/s) | 4.813 | 19.240 | 48.807 | 41.353 | Temp. unavailable | 23.022 |
| Sysbench file rand write (Mb/s) | 4.315 | 5.529 | 21.400 | 2.482 | Temp. unavailable | 17.510 |
| Plan | OVH VPS SSD 1 | Linode 1024 | DO 5bucks | Scaleway VC1S | Vultr 20GB SSD | Vultr 25GB SSD |
|---|---|---|---|---|---|---|
| Sysbench file rand read (IOPS) | 1232 | 4925 | 12495 | 10586 | Temp. unavailable | 5984 |
| Sysbench file rand write (IOPS) | 1105 | 1415 | 5478 | 635 | Temp. unavailable | 4482 |
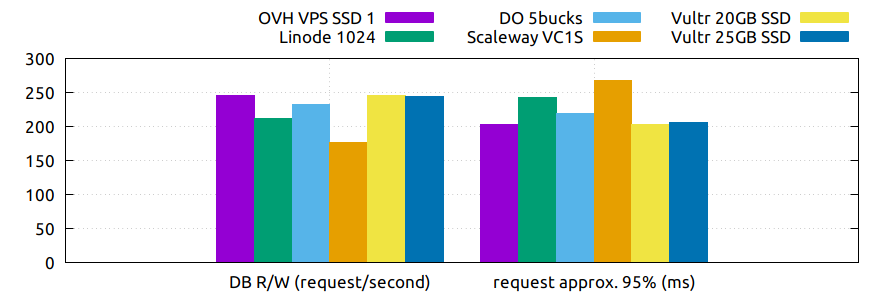
Here the test measures the database performance. I used the MySQL database for this tests, but the results could be applied also to the MariaDB database. More requests per second is better but less 95% percentile is better.
| Plan | OVH VPS SSD 1 | Linode 1024 | DO 5bucks | Scaleway VC1S | Vultr 20GB SSD | Vultr 25GB SSD |
|---|---|---|---|---|---|---|
| DB R/W (request/second) | 245.590 | 212.42 | 232.266 | 176.700 | 245.127 | 243.832 |
| request approx. 95% (ms) | 203.210 | 242.100 | 218.490 | 268.086 | 203.410 | 205.786 |
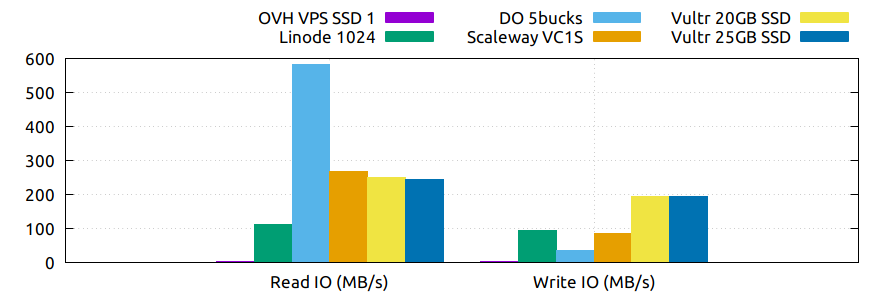
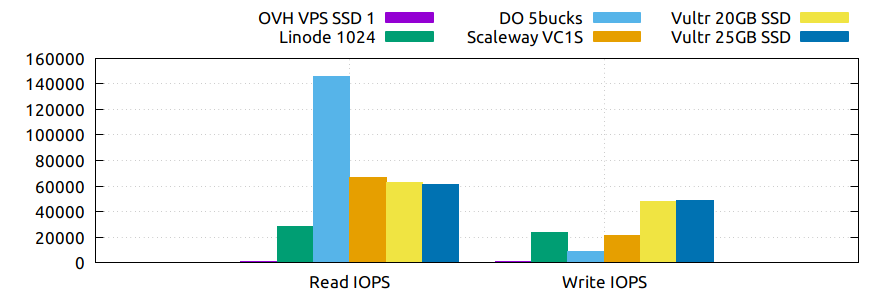
fio is a benchmarking tool used to measure I/O operations performance, usually oriented to disk workloads, but you could use it to measure network, cpu and memory I/O as well. It’s scriptable and can simulate complex workloads, but I use it here in a simple way to measure the disk performance. In this test, more is better.
| Plan | OVH VPS SSD 1 | Linode 1024 | DO 5bucks | Scaleway VC1S | Vultr 20GB SSD | Vultr 25GB SSD |
|---|---|---|---|---|---|---|
| Read IO (MB/s) | 3.999 | 111.622 | 581.851 | 266.779 | 249.672 | 244.385 |
| Write IO (MB/s) | 3.991 | 93.6 | 35.317 | 84.684 | 192.748 | 194.879 |
| Plan | OVH VPS SSD 1 | Linode 1024 | DO 5bucks | Scaleway VC1S | Vultr 20GB SSD | Vultr 25GB SSD |
|---|---|---|---|---|---|---|
| Read IOPS | 999 | 27905 | 145487 | 66694 | 62417 | 60913 |
| Write IOPS | 997 | 23399 | 8828 | 21170 | 48186 | 48719 |
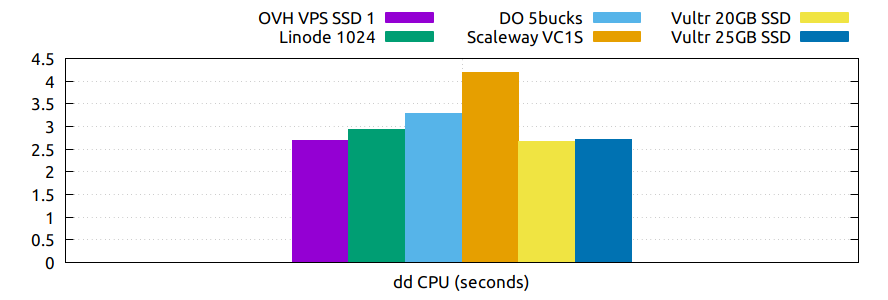
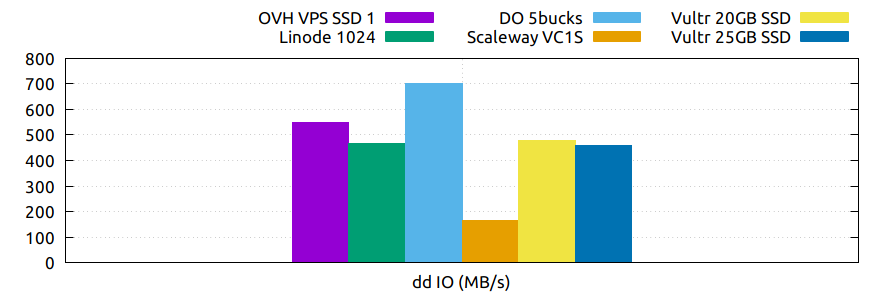
A classic, the ubiquitous dd tool that is being used forever for tons of
sysadmins for diverse purposes. I use here a pair of well-known fast tests
to measure the CPU and disk performance. Not very reliable (e.g. the disk is
only a sequential operation) but they are good enough to get an idea, and I
include them here because many people use them. In the CPU test less is
better and the opposite in the disk test.
| Plan | OVH VPS SSD 1 | Linode 1024 | DO 5bucks | Scaleway VC1S | Vultr 20GB SSD | Vultr 25GB SSD |
|---|---|---|---|---|---|---|
| dd CPU (seconds) | 2.684 | 2.935 | 3.292 | 4.199 | 2.667 | 2.715 |
| Plan | OVH VPS SSD 1 | Linode 1024 | DO 5bucks | Scaleway VC1S | Vultr 20GB SSD | Vultr 25GB SSD |
|---|---|---|---|---|---|---|
| dd IO (MB/s) | 550 | 467.4 | 702.6 | 163.6 | 477 | 458.2 |
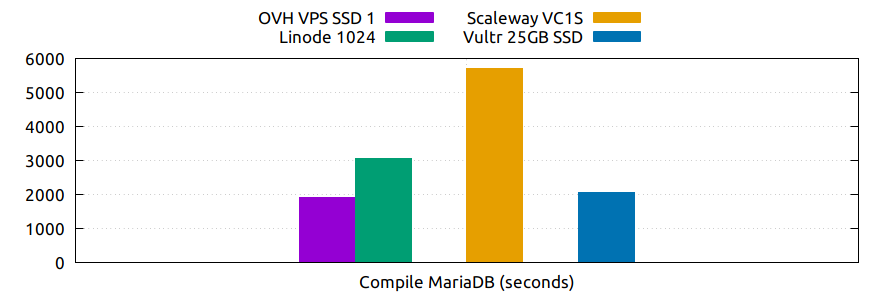
This test measures the time in seconds that a server takes to compile the MariaDB server. This is not a synthetic test and gives you a more realistic workload to compare them. Also helps to reveal the flaws that some plans have due their limitations (e.g. cpu power in Scaleway and memory available in DO). In this test, less is better.
| Plan | OVH VPS SSD 1 | Linode 1024 | DO 5bucks | Scaleway VC1S | Vultr 20GB SSD | Vultr 25GB SSD |
|---|---|---|---|---|---|---|
| Compile MariaDB (seconds) | 1904.7 | 3070.2 | out of memory | 5692.7 | Temp. unavailable | 2069.3 |
Notes:
- The compilation in DO fails at 65% after about 35min, the process it’s killed when gets out of memory.
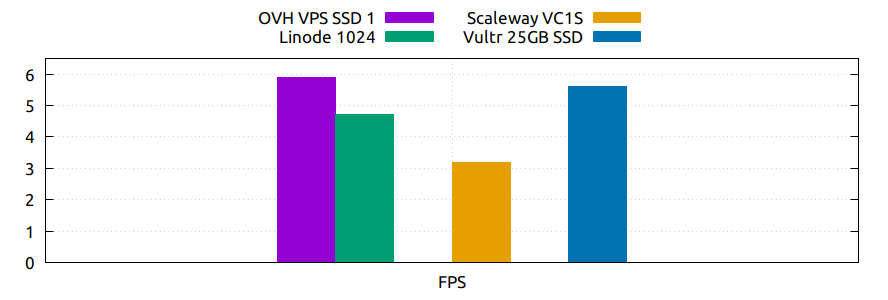
In this test the measure is the frames per second achieved to transcode a
video with ffmpeg (or avconv in Debian). This is also a more realistic
approach to compare them, because is a more real workload (even when is not
usually performed in VPS servers) and stress heavily the CPU, but making
also a good use of the disk and memory. In this test, more is better.
| Plan | OVH VPS SSD 1 | Linode 1024 | DO 5bucks | Scaleway VC1S | Vultr 20GB SSD | Vultr 25GB SSD |
|---|---|---|---|---|---|---|
| FPS | 5.9 | 4.7 | out of memory | 3.2 | Temp. unavailable | 5.6 |
Note:
- In DO the process is killed when ran out of memory.
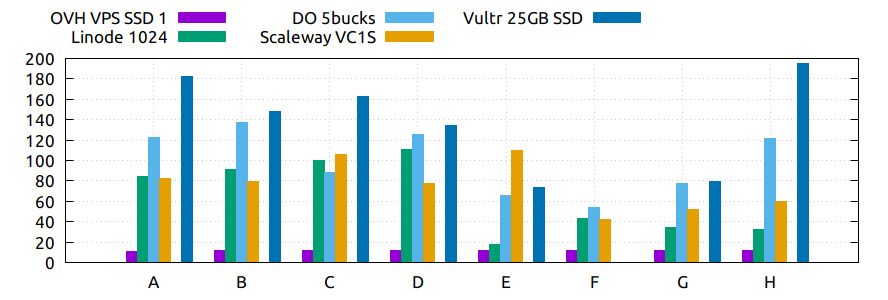
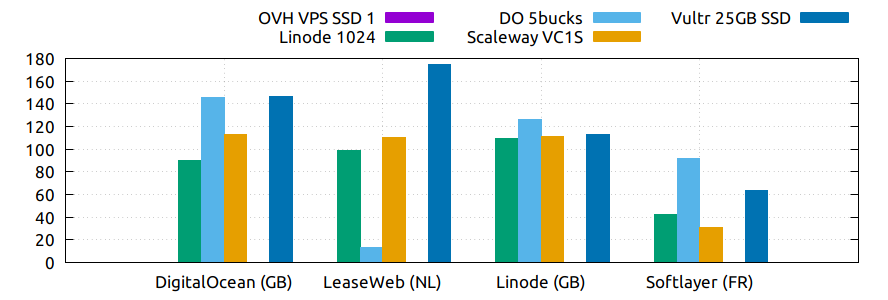
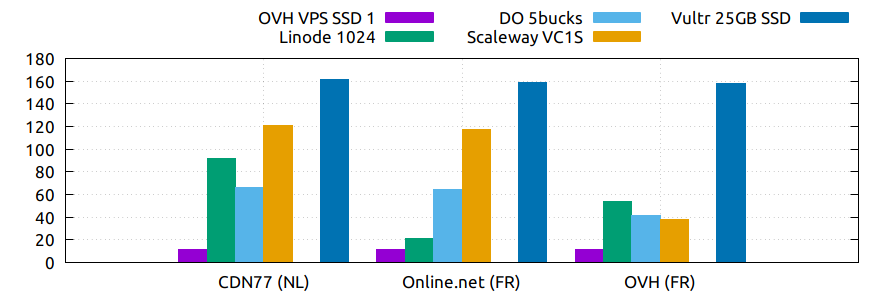
This test try to measure the average network speed downloading a 100mbit file and the average sustained speed downloading a 10gb file from various locations. I include some files that are in the same provider network as the plans that I compare here to see how much influence this factor has (remember that Scaleway belongs to Online.net). In the bash script used there are more files and locations, but I only use some of them to limit the monthly bandwidth usage of the plan. In this test, more is better.
| Plan | OVH VPS SSD 1 | Linode 1024 | DO 5bucks | Scaleway VC1S | Vultr 20GB SSD | Vultr 25GB SSD | |
|---|---|---|---|---|---|---|---|
| Cachefly CDN | A | 11.033 | 84.367 | 123 | 82.567 | Temp. unavailable | 182.333 |
| DigitalOcean (GB) | B | 11.9 | 90.767 | 137 | 79.633 | 148.333 | |
| LeaseWeb (NL) | C | 11.9 | 100.067 | 87.867 | 105.667 | 162.333 | |
| Linode (GB) | D | 11.9 | 110.667 | 125.333 | 77.233 | 134.667 | |
| Online.net (FR) | E | 11.9 | 17.90 | 66.200 | 110.3 | 73.267 | |
| OVH (FR) | F | 12 | 43.10 | 53.9 | 41.8 | ||
| Softlayer (FR) | G | 11.8 | 34.067 | 77.267 | 52.1 | 79.533 | |
| Vultr (GB) | H | 11.9 | 32.867 | 121.667 | 60.2 | 195 |
| Plan | OVH VPS SSD 1 | Linode 1024 | DO 5bucks | Scaleway VC1S | Vultr 20GB SSD | Vultr 25GB SSD |
|---|---|---|---|---|---|---|
| DigitalOcean (GB) | 89.7 | 145.667 | 113 | Temp. unavailable | 146 | |
| LeaseWeb (NL) | 98.7 | 13.6 | 109.967 | 174.333 | ||
| Linode (GB) | 109.667 | 126.333 | 111.333 | 113.333 | ||
| Softlayer (FR) | 42.223 | 91.567 | 31.233 | 63.633 |
| Plan | OVH VPS SSD 1 | Linode 1024 | DO 5bucks | Scaleway VC1S | Vultr 20GB SSD | Vultr 25GB SSD |
|---|---|---|---|---|---|---|
| CDN77 (NL) | 11.967 | 91.6 | 65.9 | 120.667 | Temp. unavailable | 161.667 |
| Online.net (FR) | 11.933 | 21.467 | 64.333 | 117.333 | 158.333 | |
| OVH (FR) | 11.967 | 54.2 | 41.15 | 37.867 | 158 |
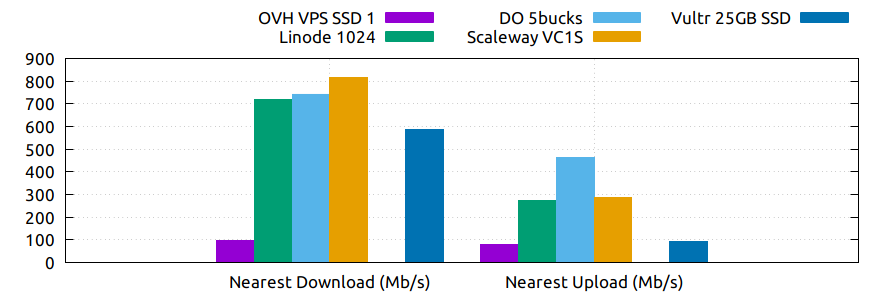
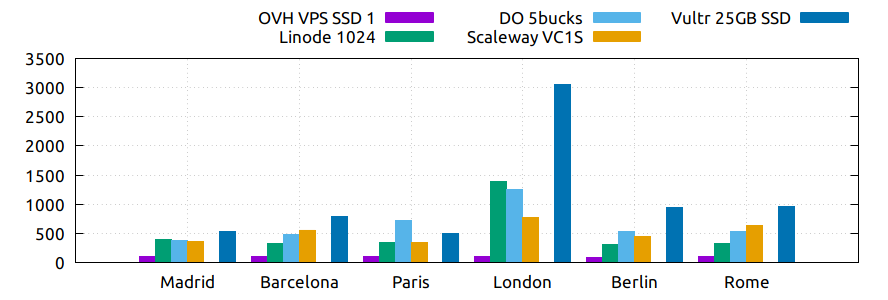
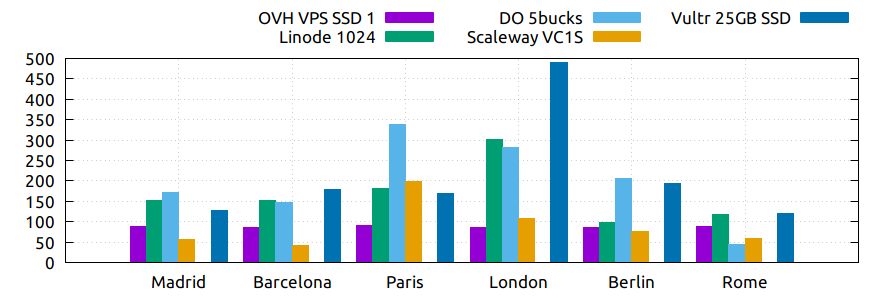
This test uses speedtest.net service to measure the average download/upload network speed from the VPS server. To do that I use the awesome speedtest-cli python script to be able to do it from the command line.
Keep in mind that this test is not very reliable because depends a lot of the network capabilities and status of the speedtest’s nodes (I try to choose always the fastest node in each city). But it gives you an idea of the network interconnections of each provider.
In those tests more is better.
| Plan | OVH VPS SSD 1 | Linode 1024 | DO 5bucks | Scaleway VC1S | Vultr 20GB SSD | Vultr 25GB SSD |
|---|---|---|---|---|---|---|
| Nearest Download (Mb/s) | 99.487 | 719.030 | 743.270 | 815.250 | Temp. unavailable | 584.740 |
| Nearest Upload (Mb/s) | 80.552 | 273.677 | 464.403 | 288.130 | 94.037 |
| Plan | OVH VPS SSD 1 | Linode 1024 | DO 5bucks | Scaleway VC1S | Vultr 20GB SSD | Vultr 25GB SSD |
|---|---|---|---|---|---|---|
| Madrid | 98.940 | 390.947 | 376.187 | 367.177 | Temp. unavailable | 535.477 |
| Barcelona | 98.550 | 319.777 | 489.210 | 558.573 | 796.617 | |
| Paris | 96.237 | 343.067 | 720.700 | 339.76 | 493.723 | |
| London | 98.897 | 1395.290 | 1260.607 | 766.277 | 3050.463 | |
| Berlin | 94.233 | 309.860 | 525.137 | 453.267 | 943.980 | |
| Rome | 98.910 | 321.69 | 527.560 | 636.857 | 964.350 |
| Plan | OVH VPS SSD 1 | Linode 1024 | DO 5bucks | Scaleway VC1S | Vultr 20GB SSD | Vultr 25GB SSD |
|---|---|---|---|---|---|---|
| Madrid | 87.937 | 151.977 | 172.437 | 57.333 | Temp. unavailable | 128.560 |
| Barcelona | 85.670 | 152.757 | 148.080 | 41.480 | 177.963 | |
| Paris | 91.173 | 182.267 | 337.737 | 199.737 | 169.450 | |
| London | 86.360 | 302.350 | 282.380 | 107.260 | 489.013 | |
| Berlin | 86.353 | 99.223 | 206.170 | 75.100 | 194.157 | |
| Rome | 87.387 | 116.90 | 44.350 | 59.053 | 121.390 |
I’m going to use two popular blog platforms to benchmark the web performance in each instance: WordPress and Ghost. In order to minimize the hassle and avoid any controversies (Apache vs Nginx, which DB, wich PHP, what cache to use, etc) and also make all the process easier I’m going to use the Bitnami stacks to install both programs. Even when I’m not specially fond of Bitnami stacks (I would use other components), being self-contained helps a lot to make easier the task as atomic and revert the server at the end to the previous state. To use two real products, even with dummy blog pages, makes a great difference from using only a “Hello world!” HTML page, specially with WordPress that also stresses heavily the database.
The Bitnami’s Wordpress stack uses Apache 2.4, MySQL 5.7, PHP 7, Varnish 4.1, and Wordpress 4.7
The Ghost stack uses Apache 2.4, Node.js 6.10, SQlite 3.7, Python 2.7 y Ghost 0.11
To perform the tests I’m going to use also another two popular tools: ApacheBench (aka ab) and wrk. In order to do the tests properly, you have to perform the tests from another machine, and even when I could use a new instance to test all the other instances, I think that the local computer is enough to test all of this plans. But there is a drawback, you need a good internet connection, preferably with a small latency and a great bandwidth, because all the tests are going to be performed in parallel. I’m using a symmetric fiber optic internet access with enough bandwidth, thus I did not had any constrain in my side. But with bigger plans, and specially with wrk and testing with more simultaneous connections it would be eventually a problem, in that case a good VPS server to perform the tests would be probably a better solution. I cold use an online service but that would make more difficult and costly the reproducibility of these tests by anyone by their own. Also I could use another tools (Locust, Gatling, etc), but they have more requirements and would cause more trouble sooner in the local machine. Also wrk is enough in their own to saturate almost any VPS web server with very small requirements in the local machine, and faster.
To avoid install or compile any software in the local machine, specially wrk that is not present in all the distributions, I’m going to use two Docker images (williamyeh/wrk and jordi/ab) to perform the tests. In the circumstances of these tests, using Docker almost does not cause any performance loss on the local machine, is more than enough. But if we want to test bigger plans with more stress, then it would be wiser to install locally both tools and perform the tests from them.
Anyway, there is a moment, no matter with software I use to perform the tests (but specially with wrk), that when testing WordPress the requests are so much that the system runs out of memory and the MySQL database is killed and eventually the Apache server is killed too if the test persists enough, until that the server would be unavailable for a few minutes (some times never recover on its own and I had to restart it from the control panel). After all, is a kind of mini DDoS attack what are performing here. This can be improved a lot with other stack components and a careful configuration. The thing here is that all of the instances are tested with the same configuration. Thus, I do not try here to test the maximum capacity of a server as much as I try to compare them under the same circumstances. To avoid lost the SSH connection (and have to perform a manual intervention) with the servers, I limit the connections until a certain point, pause the playbook five minutes and then restart the stack before perform the next test.
In the servers where the memory available is less than 1GB, to be able to install the stacks, I set a swap cache file of 512GB. But to perform the tests I deactivate that cache memory to compare all of them in the default offered conditions.
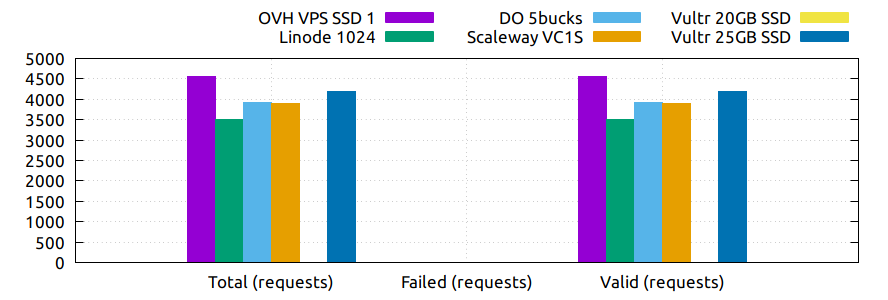
This graph show the number of requests achieved with several concurrent connections in 3 minutes, more valid requests is better.
| Plan | OVH VPS SSD 1 | Linode 1024 | DO 5bucks | Scaleway VC1S | Vultr 20GB SSD | Vultr 25GB SSD |
|---|---|---|---|---|---|---|
| Total (requests) | 4562 | 3496 | 3921 | 3901 | 4180 | |
| Failed (requests) | 0 | 0 | 0 | 0 | 0 | |
| Valid (requests) | 4562 | 3496 | 3921 | 3901 | 0 | 4180 |
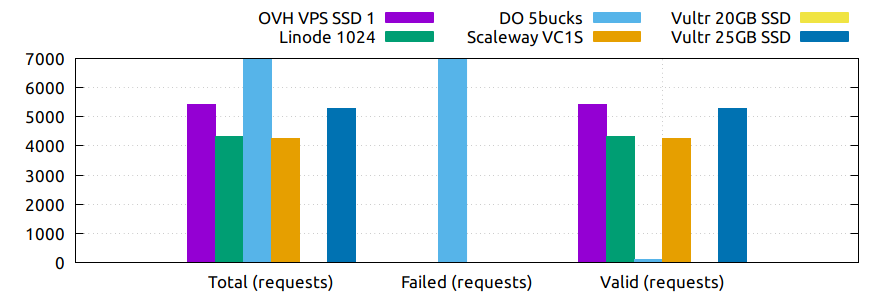
I truncate the graph by the top here because of the excess of invalid requests from DO misrepresents the most important value, the successful requests.
| Plan | OVH VPS SSD 1 | Linode 1024 | DO 5bucks | Scaleway VC1S | Vultr 20GB SSD | Vultr 25GB SSD |
|---|---|---|---|---|---|---|
| Total (requests) | 5412 | 4310 | 18653 | 4248 | 5293 | |
| Failed (requests) | 0 | 0 | 18542 | 0 | 0 | |
| Valid (requests) | 5412 | 4310 | 111 | 4248 | 0 | 5293 |
I truncate the graph by the top here because of the excess of invalid requests from DO misrepresents the most important value, the successful requests.
| Plan | OVH VPS SSD 1 | Linode 1024 | DO 5bucks | Scaleway VC1S | Vultr 20GB SSD | Vultr 25GB SSD |
|---|---|---|---|---|---|---|
| Total (requests) | 5597 | 3976 | 30283 | 3900 | 5267 | |
| Failed (requests) | 0 | 0 | 30201 | 0 | 0 | |
| Valid (requests) | 5597 | 3976 | 82 | 3900 | 0 | 5267 |
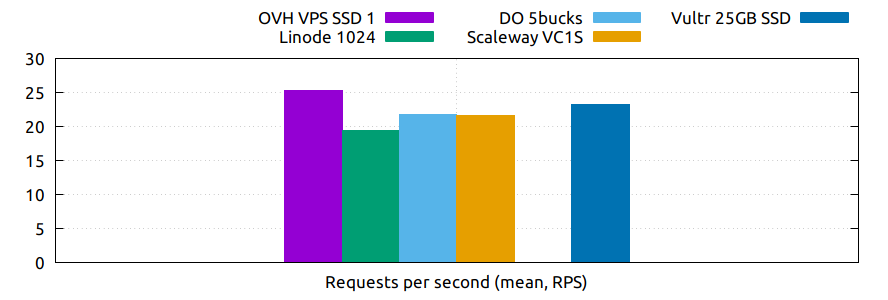
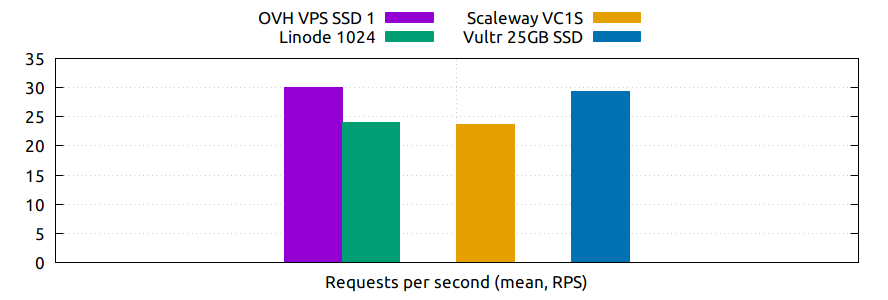
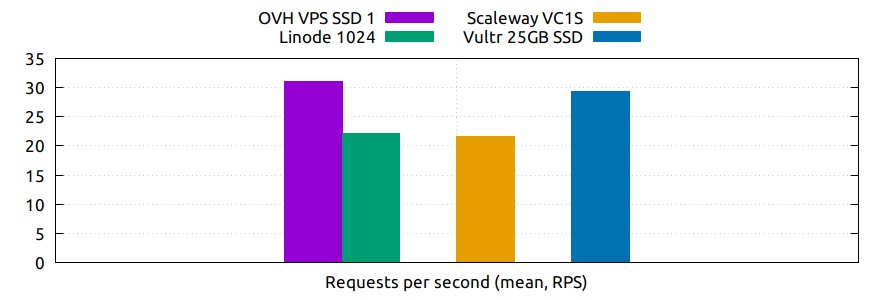
This graph show the requests per second achieved with several concurrent connections in 3 minutes, more is better.
| Plan | OVH VPS SSD 1 | Linode 1024 | DO 5bucks | Scaleway VC1S | Vultr 20GB SSD | Vultr 25GB SSD |
|---|---|---|---|---|---|---|
| Requests per second (mean, RPS) | 25.34 | 19.40 | 21.78 | 21.66 | 23.22 |
| Plan | OVH VPS SSD 1 | Linode 1024 | DO 5bucks | Scaleway VC1S | Vultr 20GB SSD | Vultr 25GB SSD |
|---|---|---|---|---|---|---|
| Requests per second (mean, RPS) | 30.06 | 23.93 | 23.60 | 29.40 |
Note:
- The requests per second in DO is not a valid number because ab makes no distinction between valid and failed requests.
| Plan | OVH VPS SSD 1 | Linode 1024 | DO 5bucks | Scaleway VC1S | Vultr 20GB SSD | Vultr 25GB SSD |
|---|---|---|---|---|---|---|
| Requests per second (mean, RPS) | 31.09 | 22.09 | 21.67 | 29.26 |
Note:
- The requests per second in DO is not a valid number because ab makes no distinction between valid and failed requests.
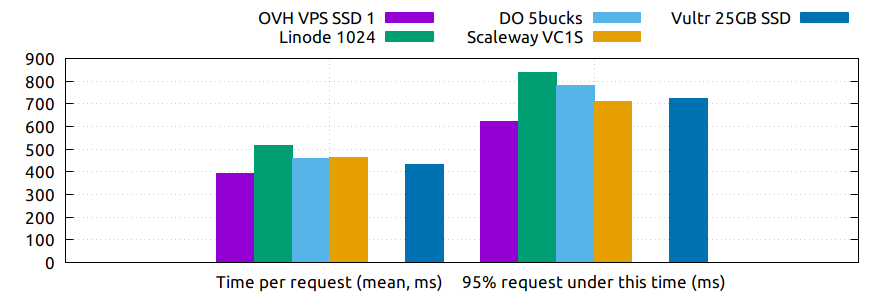
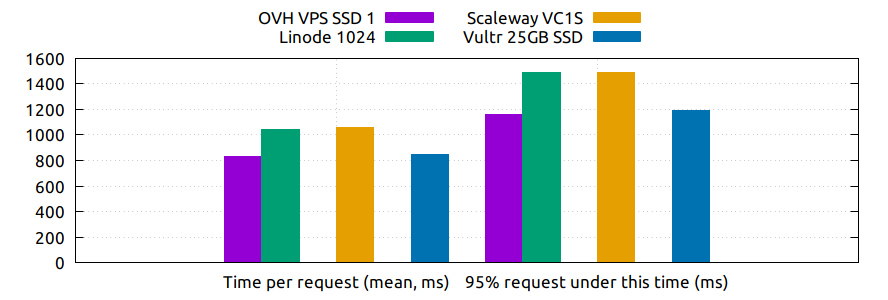
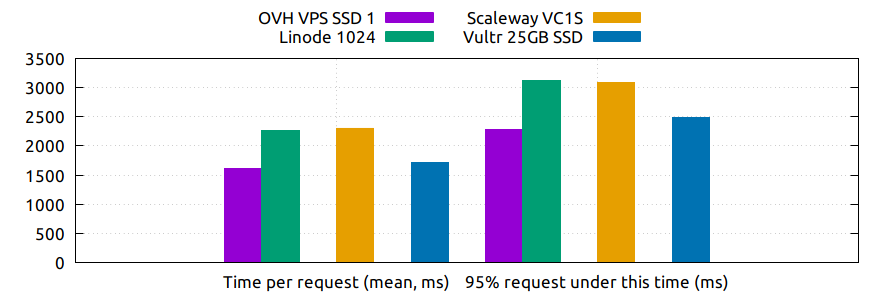
This other chart shows the mean time per request and under what time are served the 95% of all requests. Less is better.
| Plan | OVH VPS SSD 1 | Linode 1024 | DO 5bucks | Scaleway VC1S | Vultr 20GB SSD | Vultr 25GB SSD |
|---|---|---|---|---|---|---|
| Time per request (mean, ms) | 394.565 | 515.481 | 459.156 | 461.720 | 430.655 | |
| 95% request under this time (ms) | 624 | 840 | 779 | 711 | 725 |
| Plan | OVH VPS SSD 1 | Linode 1024 | DO 5bucks | Scaleway VC1S | Vultr 20GB SSD | Vultr 25GB SSD |
|---|---|---|---|---|---|---|
| Time per request (mean, ms) | 831.539 | 1044.750 | 1059.526 | 850.458 | ||
| 95% request under this time (ms) | 1157 | 1492 | 1486 | 1195 |
Note:
- The times in DO are not a valid numbers because ab makes no distinction between valid and failed requests.
| Plan | OVH VPS SSD 1 | Linode 1024 | DO 5bucks | Scaleway VC1S | Vultr 20GB SSD | Vultr 25GB SSD |
|---|---|---|---|---|---|---|
| Time per request (mean, ms) | 1608.017 | 2263.603 | 2307.753 | 1708.784 | ||
| 95% request under this time (ms) | 2289 | 3122 | 3082 | 2489 |
Note:
- The times in DO are not a valid numbers because ab makes no distinction between valid and failed requests.
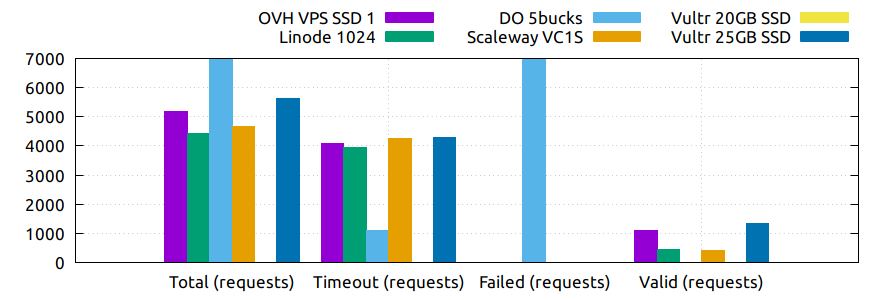
With those tests, using the wrk capacity to saturate almost any server, I increment the connections in three steps (100, 150, 200) under a 3 minutes load to be how the performance of each server is degrading. I could use a linear plot, but that would make me to change the gather python script and I think that’s clear enough in this way.
Of course, the key here is the amount of memory, the plans that support more load are also the ones that have more memory.
More valid requests is better.
I truncate the graph by the top here because of the excess of invalid requests (the database is killed to soon) from Vultr misrepresents the most important value, the successful requests.
| Plan | OVH VPS SSD 1 | Linode 1024 | DO 5bucks | Scaleway VC1S | Vultr 20GB SSD | Vultr 25GB SSD |
|---|---|---|---|---|---|---|
| Total (requests) | 5190 | 4411 | 14872 | 4670 | 5644 | |
| Timeout (requests) | 4088 | 3956 | 1106 | 4257 | 4297 | |
| Failed (requests) | 14773 | |||||
| Valid (requests) | 1102 | 455 | -1007 | 413 | 0 | 1347 |
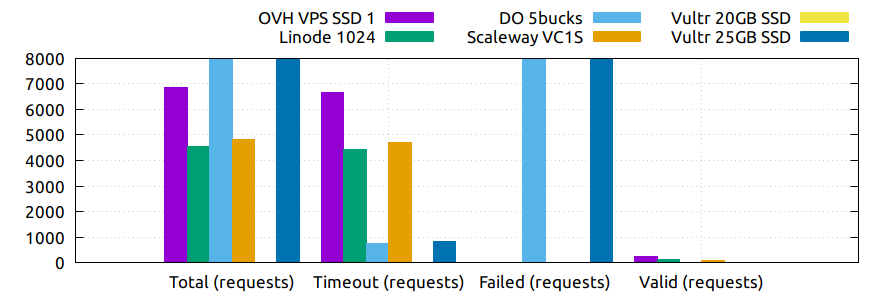
I truncate the graph by the top here because of the excess of invalid requests (the database is killed to soon) from Vultr & DO misrepresents the most important value, the successful requests.
| Plan | OVH VPS SSD 1 | Linode 1024 | DO 5bucks | Scaleway VC1S | Vultr 20GB SSD | Vultr 25GB SSD |
|---|---|---|---|---|---|---|
| Total (requests) | 6870 | 4554 | 32561 | 4809 | 94838 | |
| Timeout (requests) | 6647 | 4434 | 752 | 4709 | 824 | |
| Failed (requests) | 32464 | 94154 | ||||
| Valid (requests) | 223 | 120 | -655 | 100 | 0 | -140 |
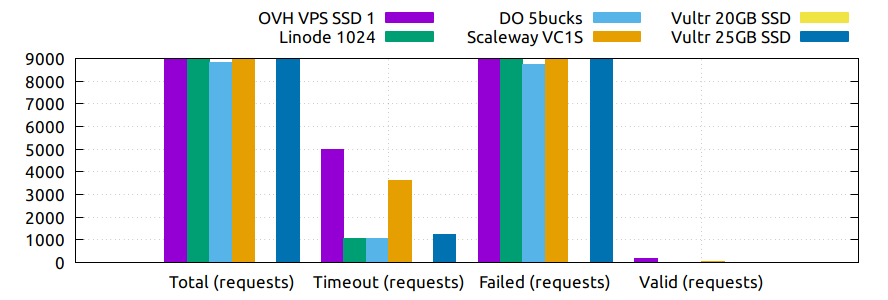
I truncate the graph by the top here because of the excess of invalid requests (the database is killed to soon) from several plans misrepresents the most important value, the successful requests.
| Plan | OVH VPS SSD 1 | Linode 1024 | DO 5bucks | Scaleway VC1S | Vultr 20GB SSD | Vultr 25GB SSD |
|---|---|---|---|---|---|---|
| Total (requests) | 27967 | 44710 | 8817 | 22691 | 53795 | |
| Timeout (requests) | 5003 | 1071 | 1040 | 3630 | 1216 | |
| Failed (requests) | 22774 | 43837 | 8740 | 18996 | 53088 | |
| Valid (requests) | 190 | -198 | -963 | 65 | 0 | -509 |
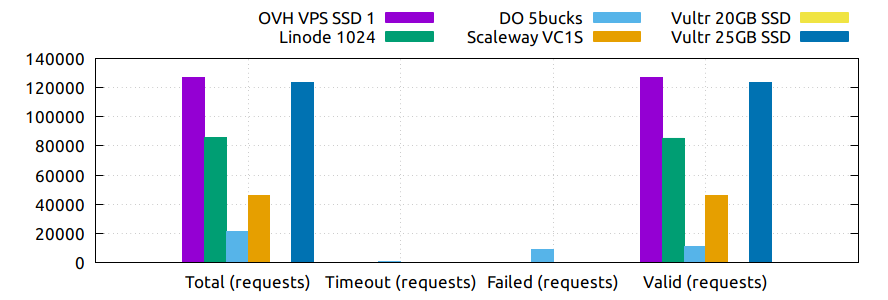
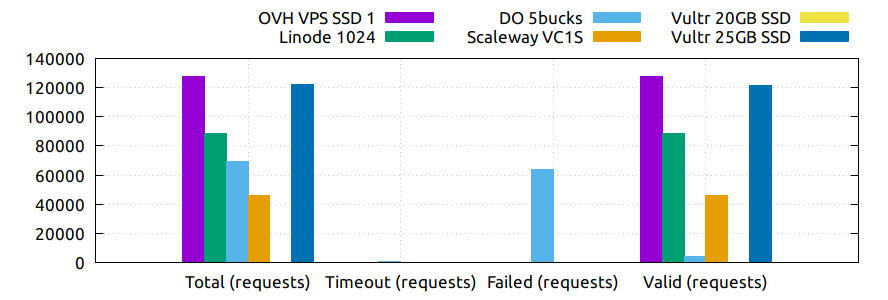
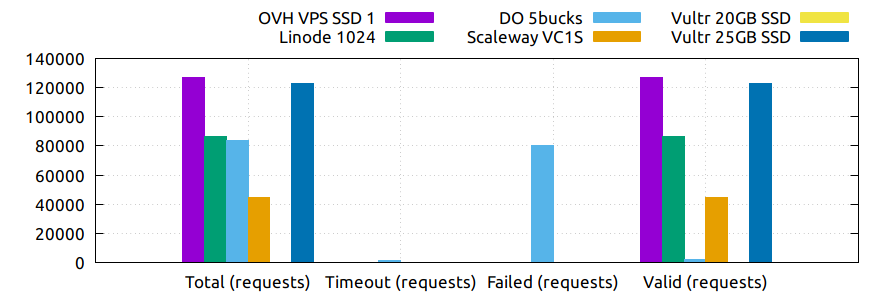
The same tests with wrk as above but in Ghost, a faster and more efficient blog than wordpress. More valid request is better.
| Plan | OVH VPS SSD 1 | Linode 1024 | DO 5bucks | Scaleway VC1S | Vultr 20GB SSD | Vultr 25GB SSD |
|---|---|---|---|---|---|---|
| Total (requests) | 126831 | 85527 | 21247 | 45912 | 123244 | |
| Timeout (requests) | 96 | 95 | 925 | 93 | 92 | |
| Failed (requests) | 9065 | |||||
| Valid (requests) | 126735 | 85432 | 11257 | 45819 | 0 | 123152 |
| Plan | OVH VPS SSD 1 | Linode 1024 | DO 5bucks | Scaleway VC1S | Vultr 20GB SSD | Vultr 25GB SSD |
|---|---|---|---|---|---|---|
| Total (requests) | 127445 | 88424 | 69010 | 45924 | 121817 | |
| Timeout (requests) | 157 | 147 | 864 | 156 | 156 | |
| Failed (requests) | 63794 | |||||
| Valid (requests) | 127288 | 88277 | 4352 | 45768 | 0 | 121661 |
| Plan | OVH VPS SSD 1 | Linode 1024 | DO 5bucks | Scaleway VC1S | Vultr 20GB SSD | Vultr 25GB SSD |
|---|---|---|---|---|---|---|
| Total (requests) | 126968 | 86381 | 83685 | 44906 | 122767 | |
| Timeout (requests) | 236 | 229 | 1182 | 238 | 230 | |
| Failed (requests) | 80257 | |||||
| Valid (requests) | 126732 | 86152 | 2246 | 44668 | 0 | 122537 |
Warning: Security in a VPS is your responsibility, nobody else. But taking a look to the default security applied in the default instances of a provider could give you a reference of the care that they take in this matter. And maybe it could give you also a good reference of how they care about their own systems security.
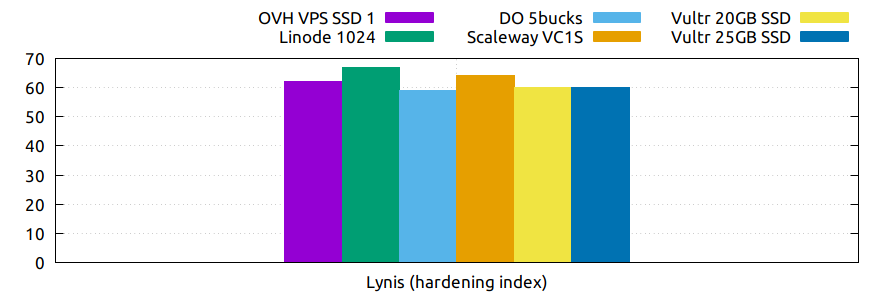
Lynis is a security audit tool that helps you to harden and test compliance on your computers, among other things. As part of that is has an index that values how secure is your server. This index should be take with caution, it’s not an absolute value, only a reference. It not covers yet all the security measures of a machine and could be not well balanced to do a effective comparison. In this test, more is better, but take into account that the number of tests performed had also an impact on the index (the number of test executed is a dynamic value that depends on the system features detected).
| Plan | OVH VPS SSD 1 | Linode 1024 | DO 5bucks | Scaleway VC1S | Vultr 20GB SSD | Vultr 25GB SSD |
|---|---|---|---|---|---|---|
| Lynis (hardening index) | 62 (220) | 67 (220) | 59 (220) | 64 (225) | 60 (230) | 60 (231) |
Notes:
- The number between round brackets are the number of tests performed in every server.
This tests uses nmap (also netstat to double check) to see the network ports and protocols that are open by default in each instance.
| Plan | OVH VPS SSD 1 | Linode 1024 | DO 5bucks | Scaleway VC1S | Vultr 20GB SSD | Vultr 25GB SSD |
|---|---|---|---|---|---|---|
| Open TCP ports | 22 (ssh) | 22 (ssh) | 22 (ssh) | 22 (ssh) | 22 (ssh) | |
| Open UDP ports | 68 (dhcpc) | 68 (dhcpc), 123 (ntp) | 68 (dhcpc), 123 (ntp) |
| Plan | OVH VPS SSD 1 | Linode 1024 | DO 5bucks | Scaleway VC1S | Vultr 20GB SSD | Vultr 25GB SSD |
|---|---|---|---|---|---|---|
| Open TCP ports | 22 (ssh) | 22 (ssh) | 22 (ssh) | |||
| Open UDP ports | 22 (ssh) | 22 (ssh) | 22 (ssh) |
| Plan | OVH VPS SSD 1 | Linode 1024 | DO 5bucks | Scaleway VC1S | Vultr 20GB SSD | Vultr 25GB SSD |
|---|---|---|---|---|---|---|
| Open protocols IPv4 | 1 (icmp), 2 (igmp), 6 (tcp), 17 (udp), 103 (pim), 136 (udplite), 255 (unknown) | 1 (icmp), 2 (igmp), 4 (ipv4), 6 (tcp), 17 (udp), 41 (ipv6), 47 (gre), 50 (esp), 51 (ah), 64 (sat), 103 (pim), 108 (ipcomp), 132 (sctp), 136 (udplite), 242 (unknown), 255 (unknown) | 1 (icmp), 2 (igmp), 6 (tcp), 17 (udp), 103 (pim), 136 (udplite), 255 (unknown) | 1 (icmp), 2 (igmp), 6 (tcp), 17 (udp), 136 (udplite), 255 (unknown) | 1 (icmp), 2 (igmp), 6 (tcp), 17 (udp), 103 (pim), 136 (udplite), 196 (unknown), 255 (unknown) | |
| Open protocols IPv6 | 0 (hopopt), 4 (ipv4), 6 (tcp), 17 (udp), 41 (ipv6), 43 (ipv6-route), 44 (ipv6-frag), 47 (gre), 50 (esp), 51 (ah), 58 (ipv6-icmp), 59 (ipv6-nonxt), 60 (ipv6-opts), 108 (ipcomp), 132 (sctp), 136 (udplite), 255 (unknown) | 0 (hopopt), 6 (tcp), 17 (udp), 43 (ipv6-route), 44 (ipv6-frag), 58 (ipv6-icmp), 59 (ipv6-nonxt), 60 (ipv6-opts), 136 (udplite), 255 (unknown) | 0 (hopopt), 6 (tcp), 17 (udp), 43 (ipv6-route), 44 (ipv6-frag), 58 (ipv6-icmp), 59 (ipv6-nonxt), 60 (ipv6-opts), 103 (pim), 136 (udplite), 255 (unknown) |
| OVH | Linode | DigitalOcean | Scaleway | Vultr | |
|---|---|---|---|---|---|
| Distro install in instance | Partial | Partial | Yes | Yes | Yes |
TODO. Pending to automate also this.
Notes:
- To test the “Distro install in instance” I use a installation script to install Arch Linux from an official Debian instance. The purpose is to test if you are restricted in any way to use a different SO than the ones officially supported.
- The “Distro install” script fails partially in OVH and Linode, requires your manual intervention, that does not mean that you are not able to do it, only that you’ll probably need more work to do it.
