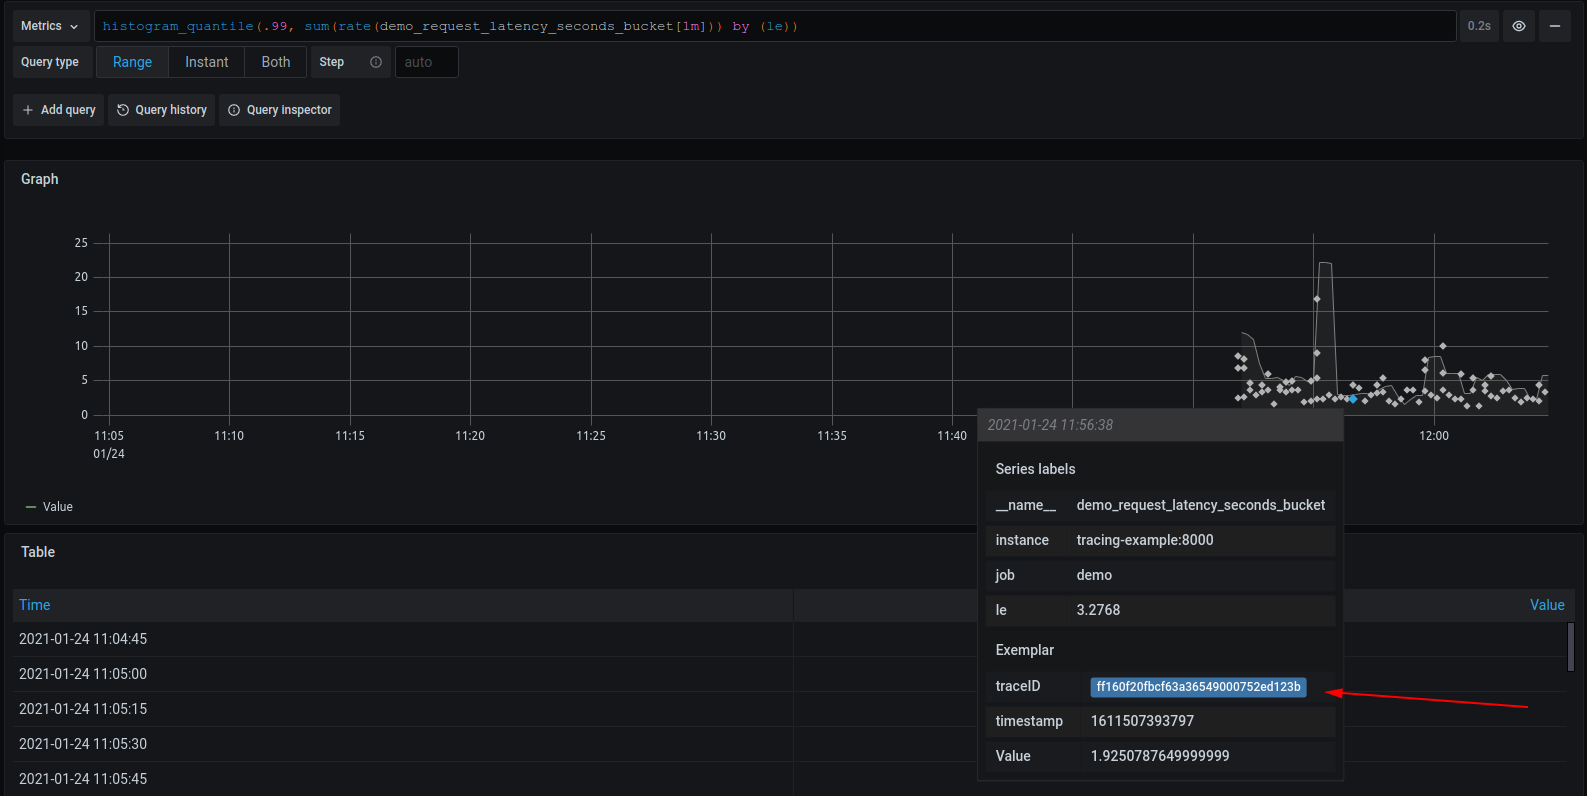
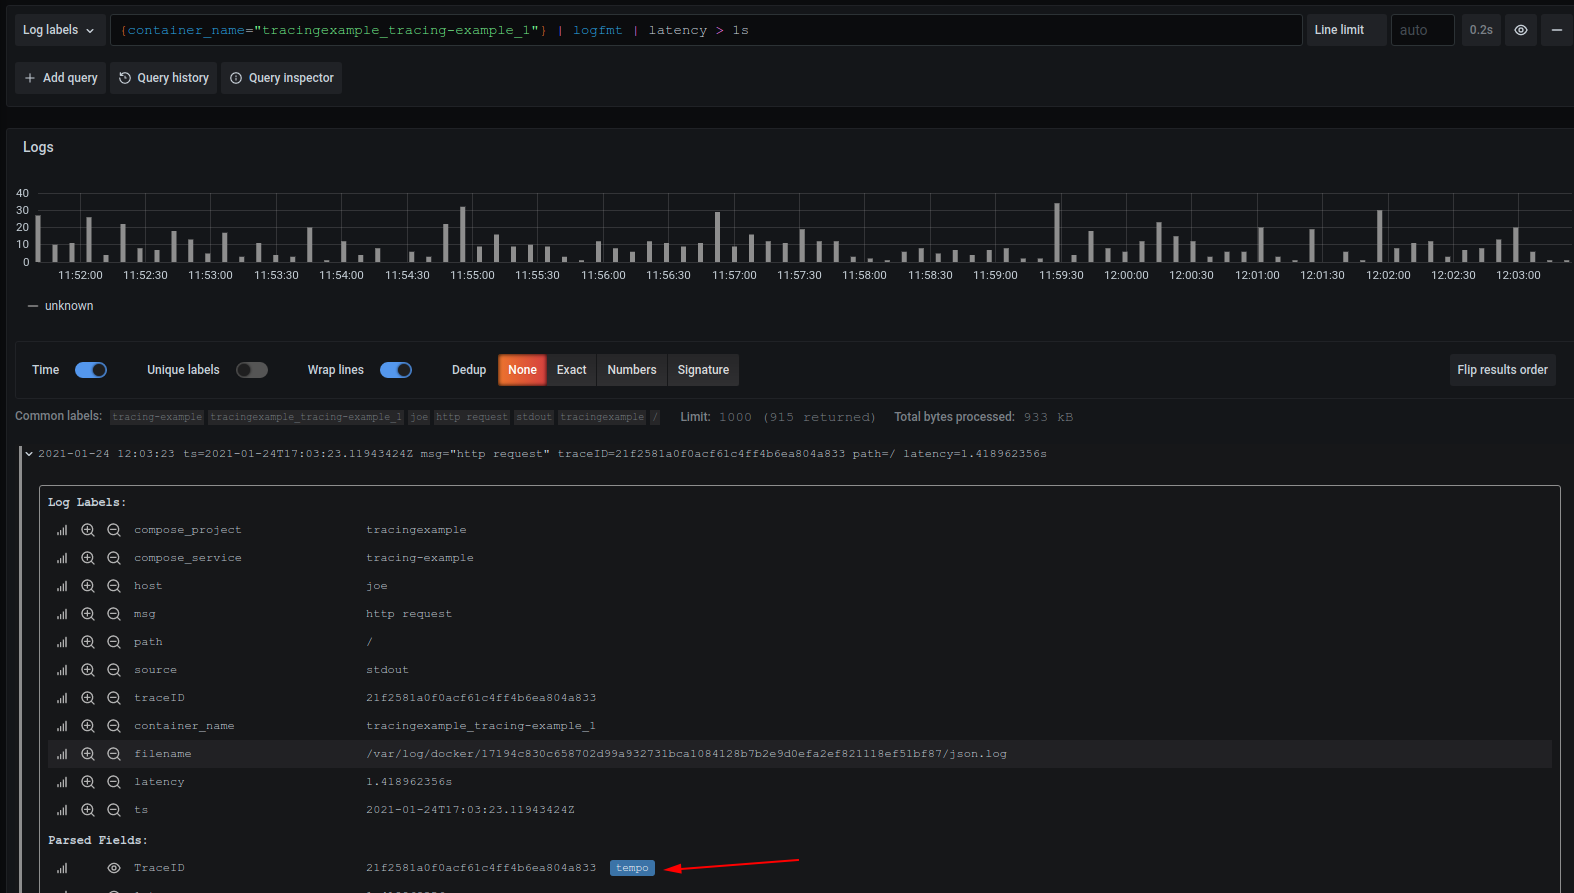
This example shows a mixture of otel and prometheus instrumentation in go. It includes trace discovery through logs and exemplars.
- Install Loki Docker Driver
docker plugin install grafana/loki-docker-driver:latest --alias loki --grant-all-permissions
- Build the application and start everything up.
./build.sh
- Exercise the application.
curl http://localhost:8000/
- (Optional) See OpenMetrics Exemplars.
curl -H 'Accept: application/openmetrics-text' http://localhost:8000/metrics | less
- Discover Traces
- Navigate to http://localhost:3000/explore
- Go to the explore page
- Choose the prometheus datasource and execute
histogram_quantile(.99, sum(rate(demo_request_latency_seconds_bucket[1m])) by (le))
- Choose the Loki datasource and execute
{container_name="tracingexample_tracing-example_1"} | logfmt | latency > 1s

