Tired of agonizing over color choices for your data visualizations? Let DOYPAColors do the heavy lifting for you! Our R package offers a delightful array of color palettes, each meticulously crafted and ready to breathe life into your plots. We'll even surprise you with a palette choice, so you can focus on what matters most—telling your data's unique story. Say goodbye to color selection headaches and hello to vibrant, eye-catching visuals with DOYPAColors 🎨!
You can install DOYPAColors from CRAN by:
install.packages("DOYPAColors")
library(DOYPAColors)
or you can install the development version from this GitHub repository:
if (!require("devtools"))
  install.packages("devtools")

devtools::install_github("jmestret/DOYPAColors")
library(DOYPAColors)
You can easily access and utilize the DOYPAColors palettes in your R plots with the following steps:
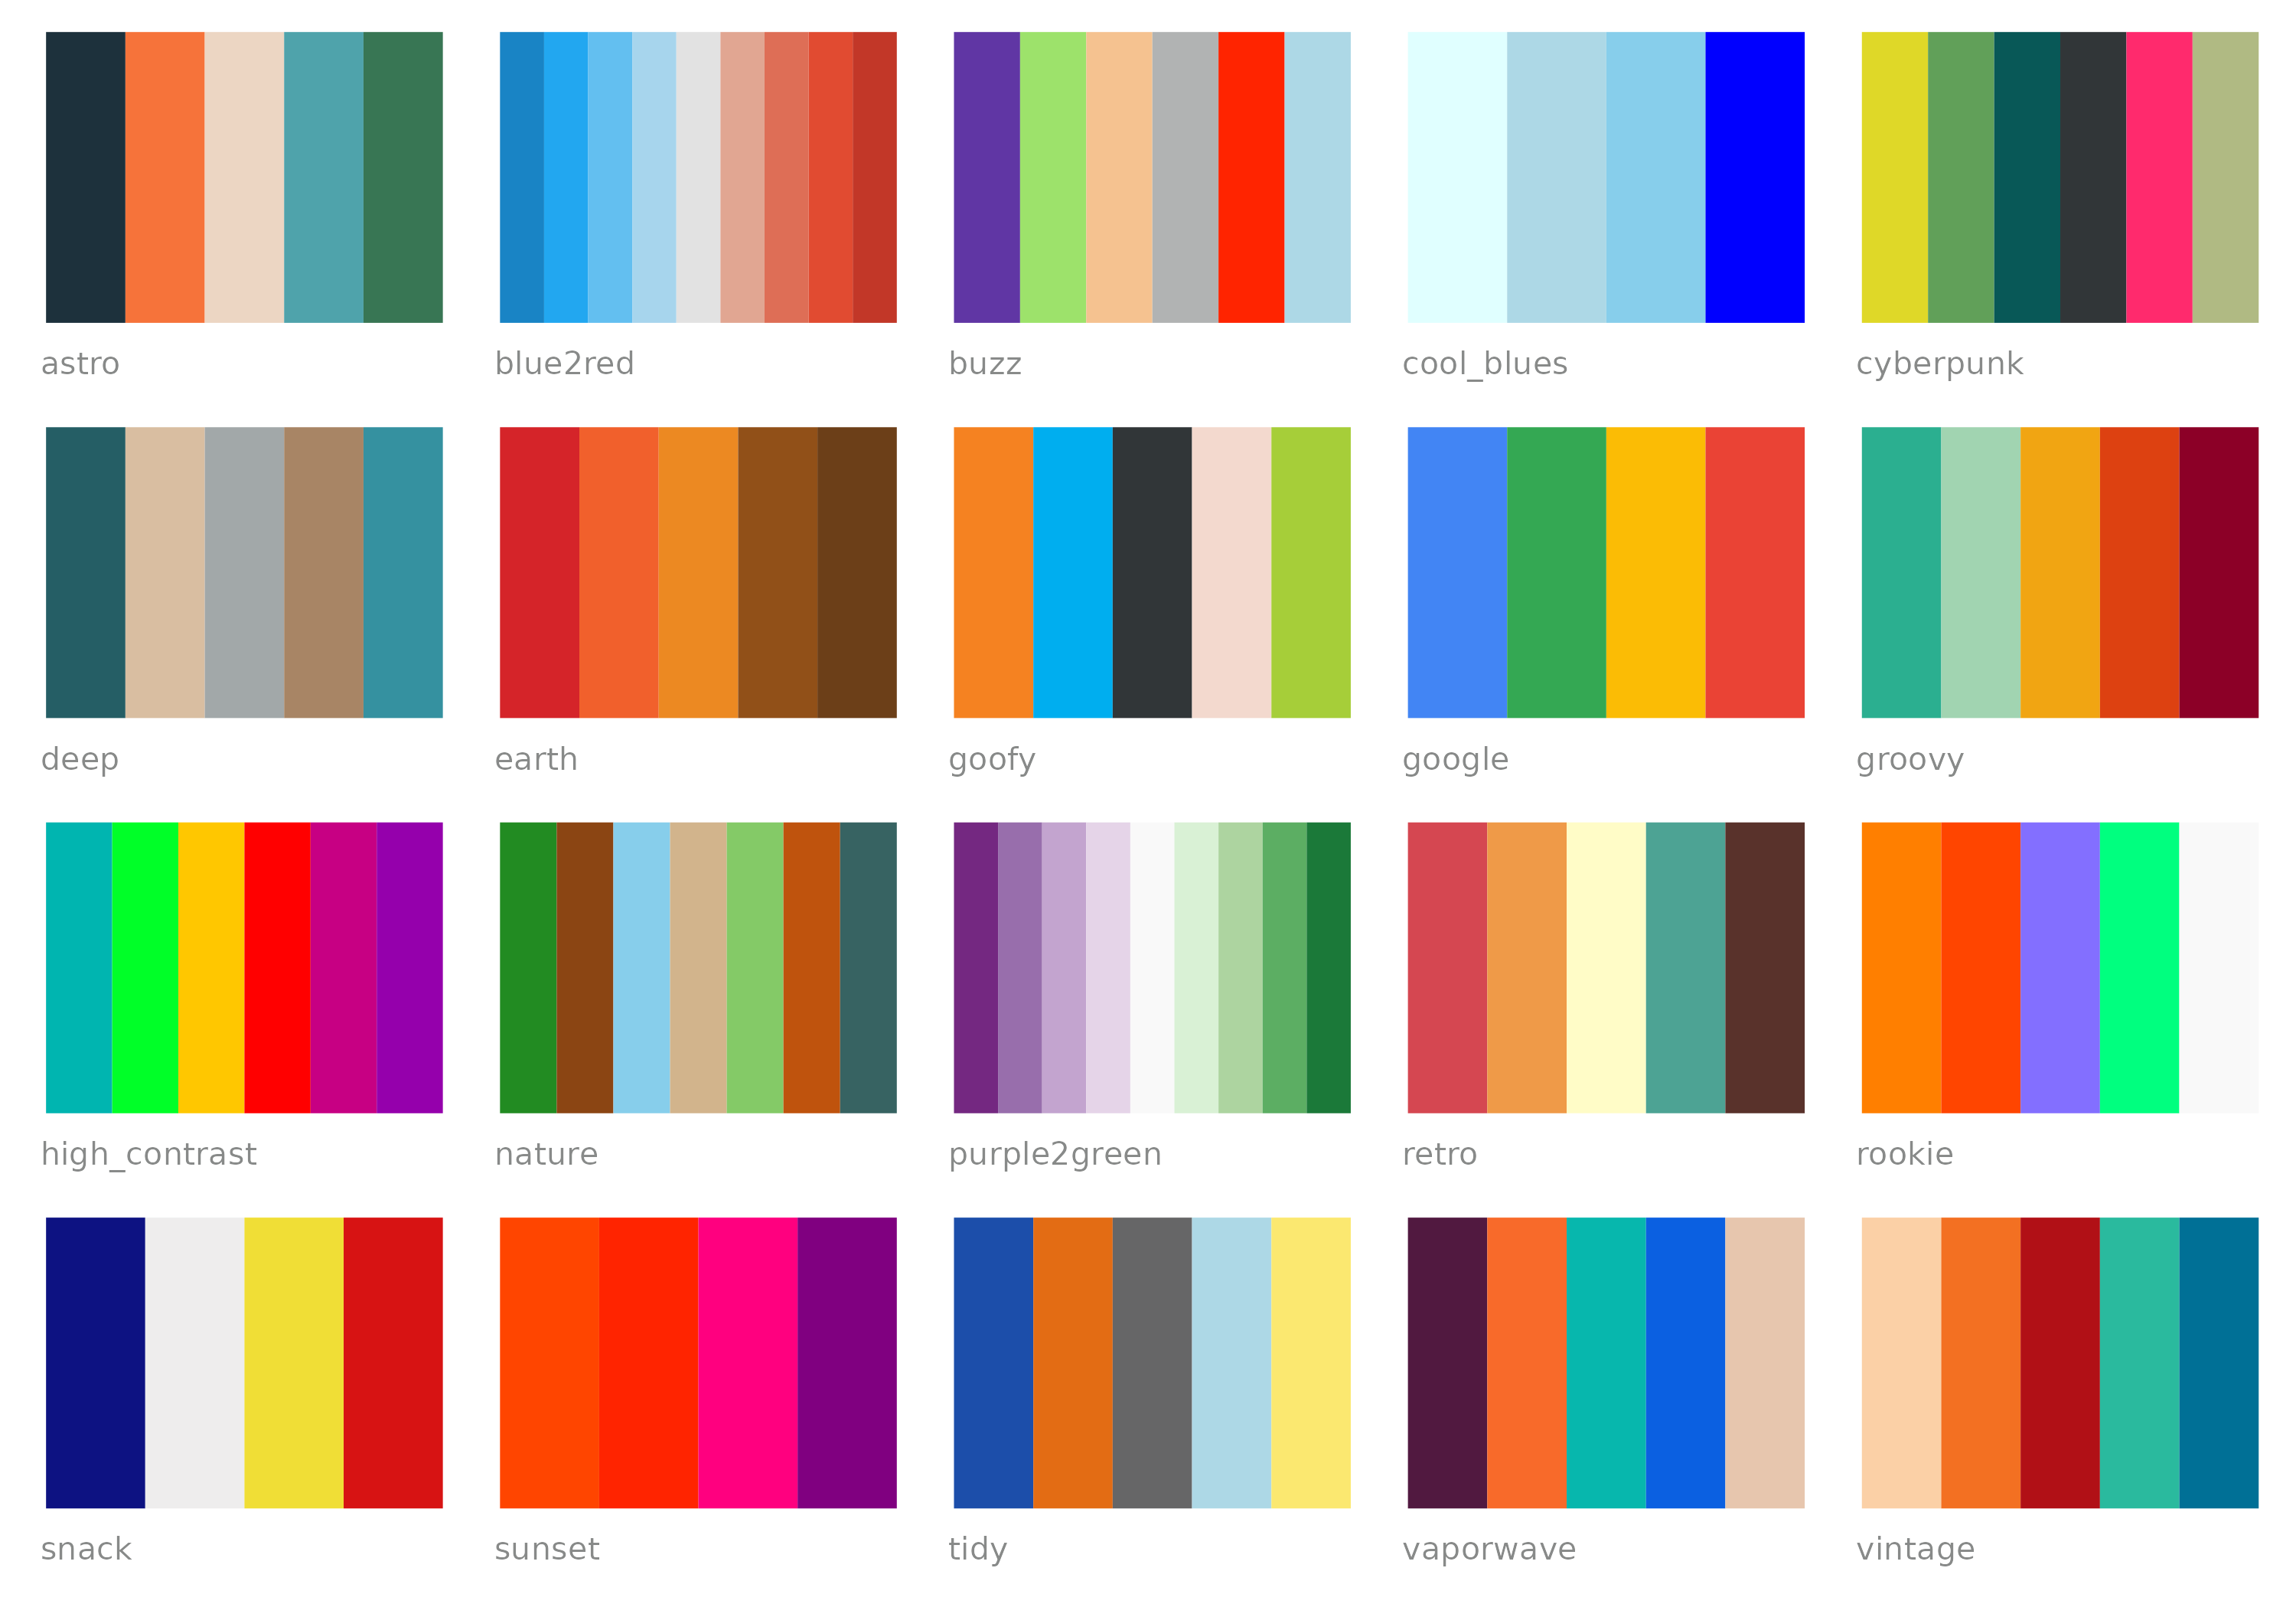
To get a sneak peek at the available color palettes, you can use the preview_doypa_pals() function:
preview_doypa_pals()
Additionally, you can simply list the names of the available palettes by running:
list_doypa_pals()
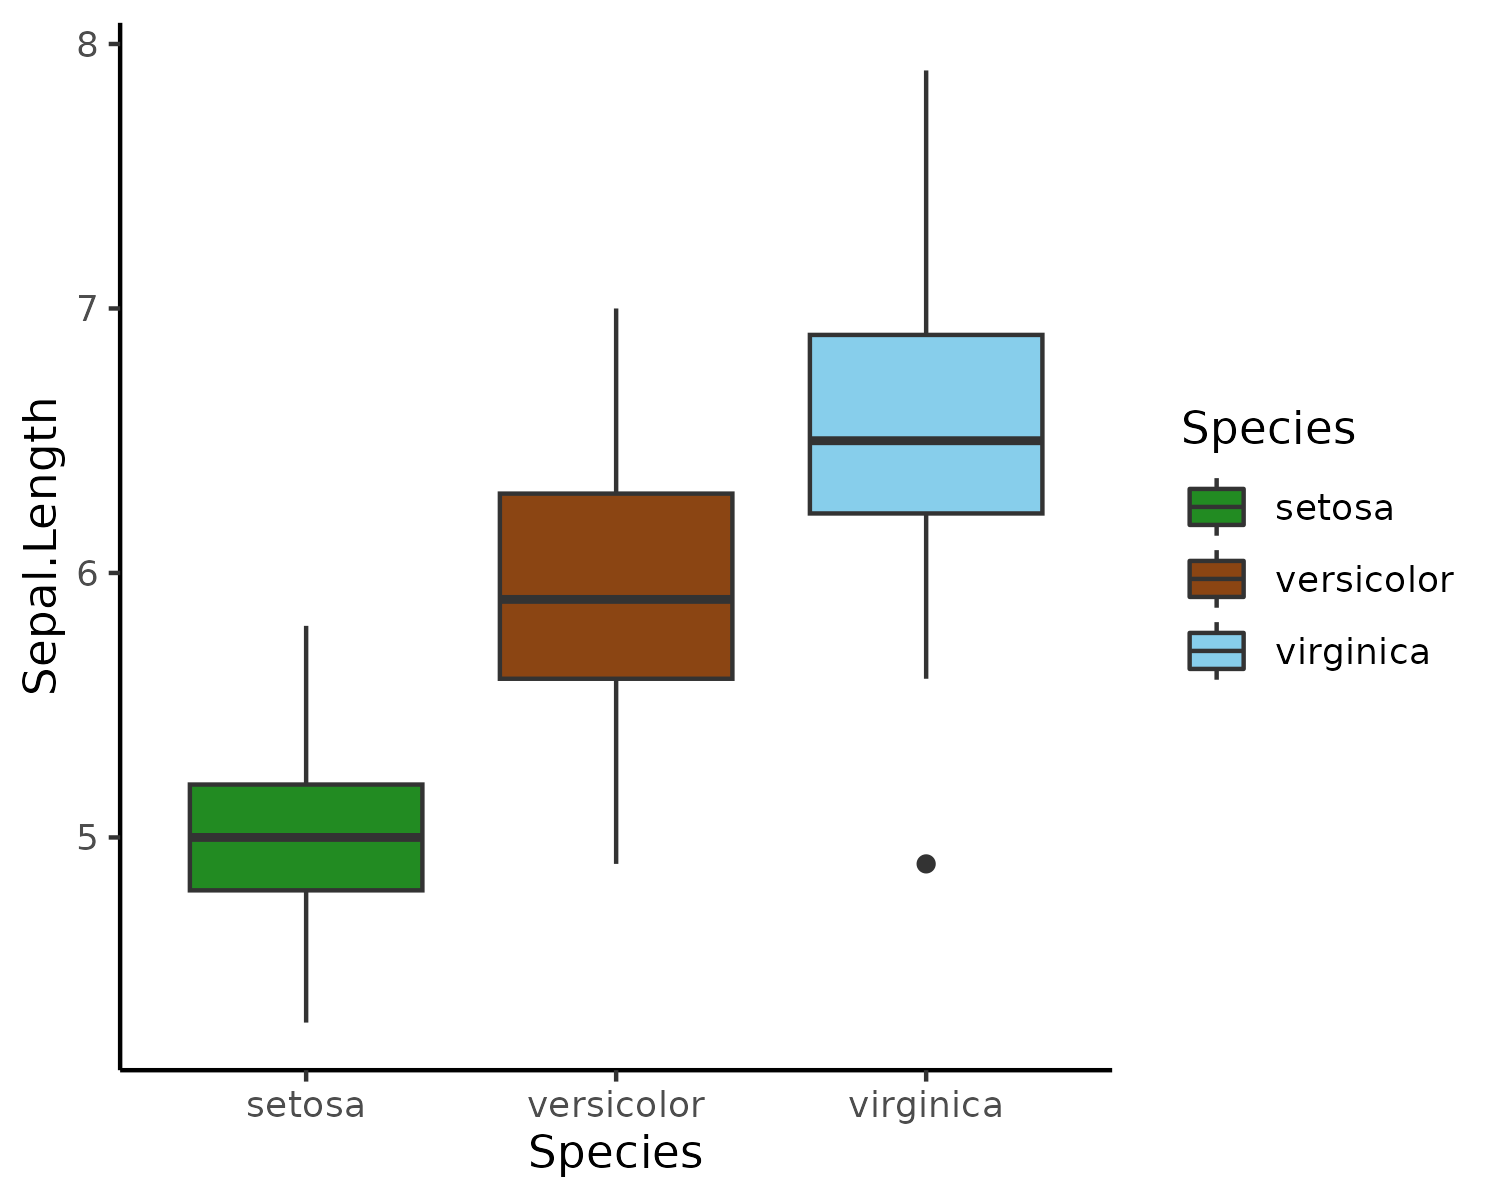
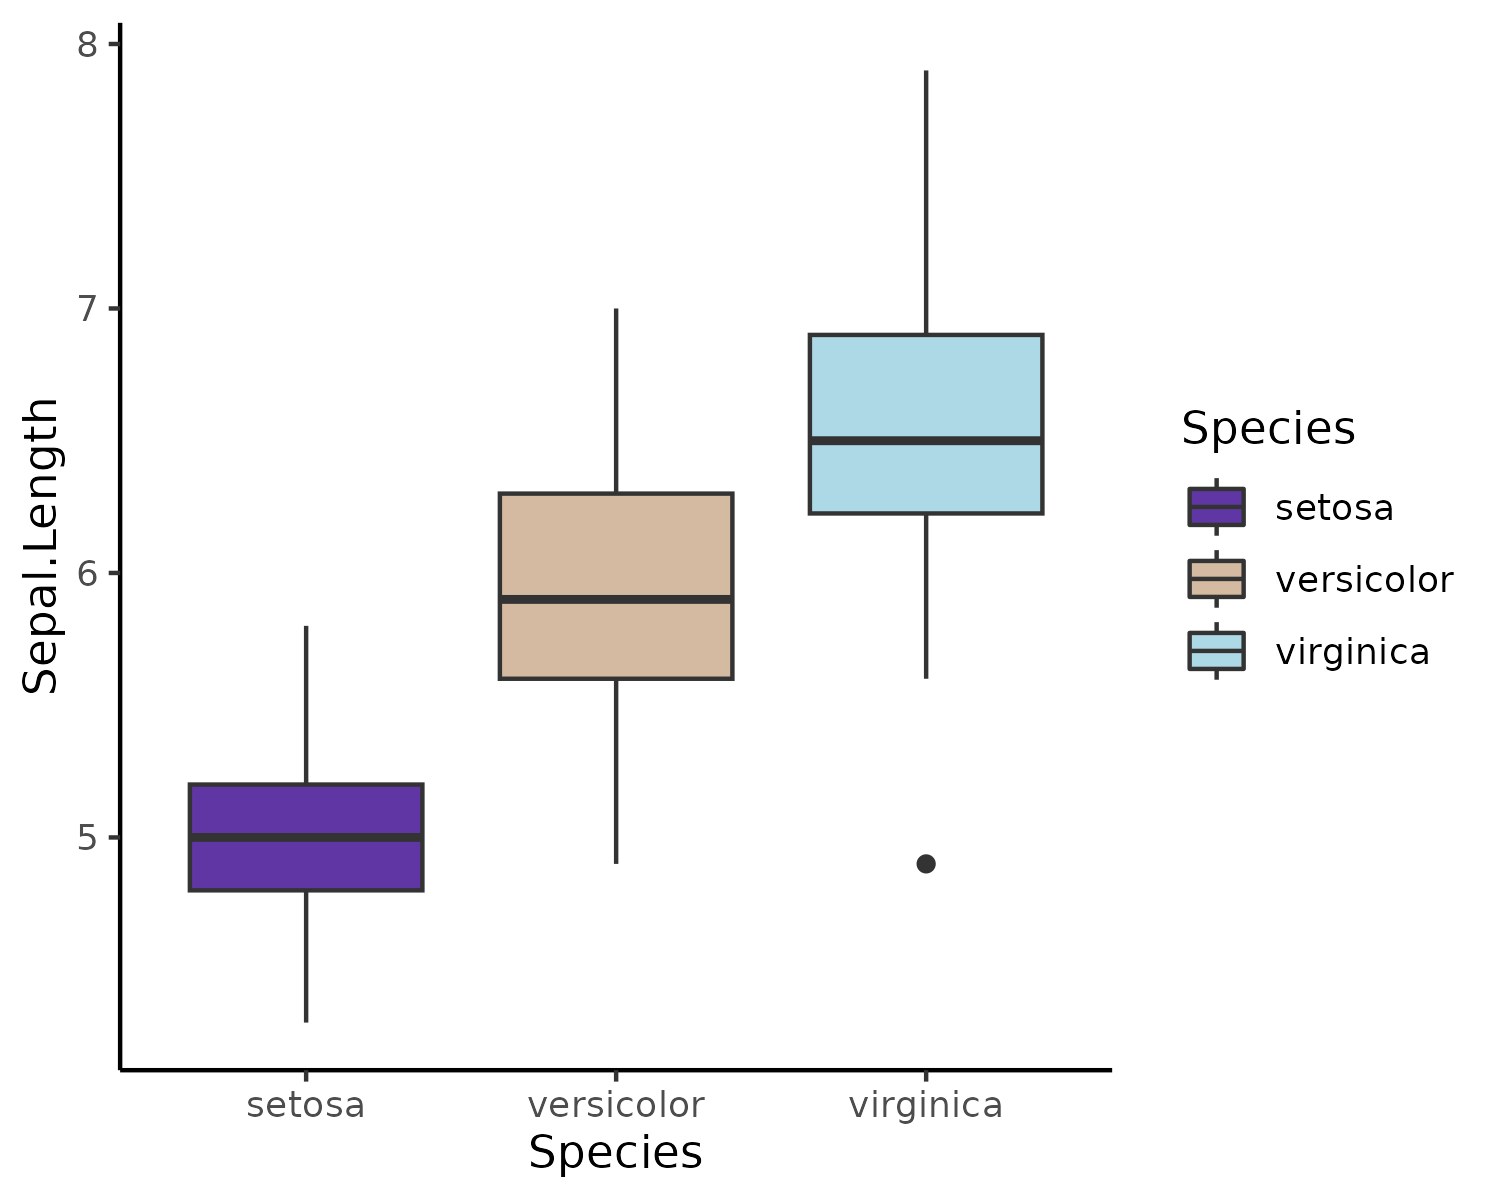
Integrating DOYPAColors palettes into your plots is straightforward with the ggplot-style functions scale_fill_doypa() and scale_color_doypa(). By setting the palette argument, you can select your preferred palette, or leave it blank, and we'll choose one for you. You also have the option to control whether the color scale is discrete or continuous using the discrete argument:
ggplot(iris, aes(x = Species, y = Sepal.Length, fill = Species)) +
    geom_boxplot() +
    scale_fill_doypa(discrete = TRUE) +
    theme_classic()
We've handpicked the exciting 'nature' palette for you - no overthinking required!
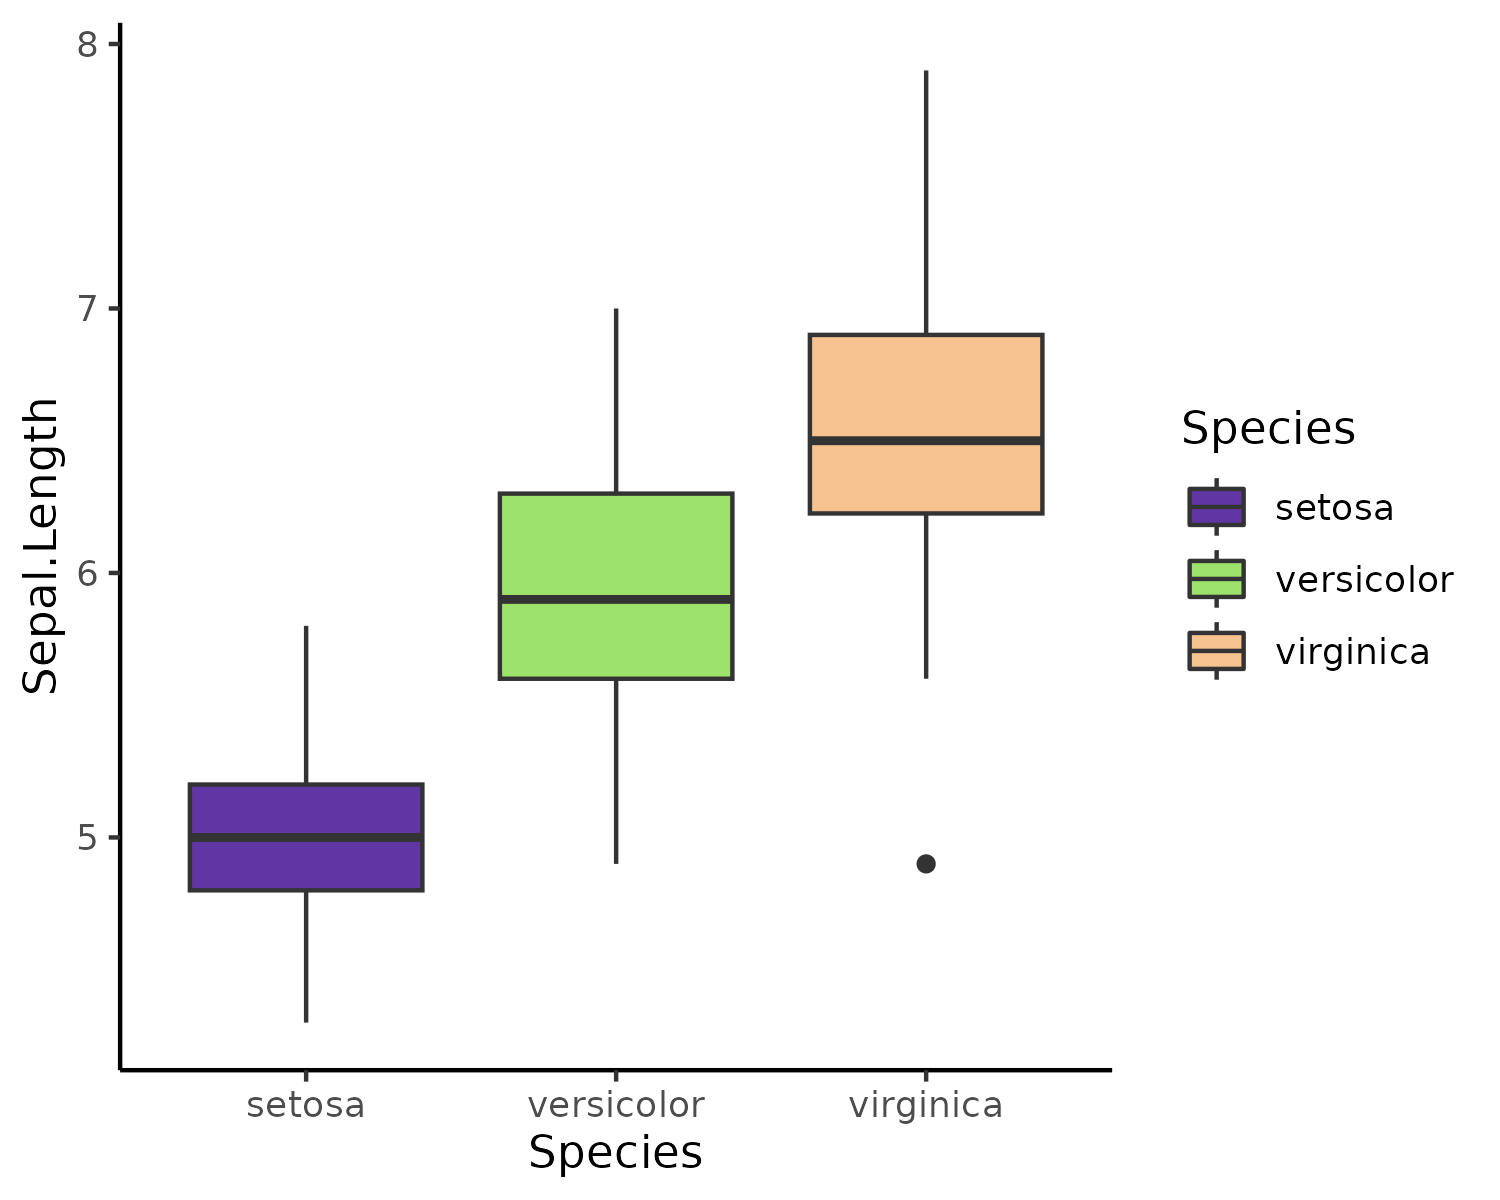
With the n argument, you can specify how many colors to use in your plot:
ggplot(iris, aes(x = Species, y = Sepal.Length, fill = Species)) +
    geom_boxplot() +
    scale_fill_doypa(palette = "buzz", n = 3, discrete = TRUE) +
    theme_classic()
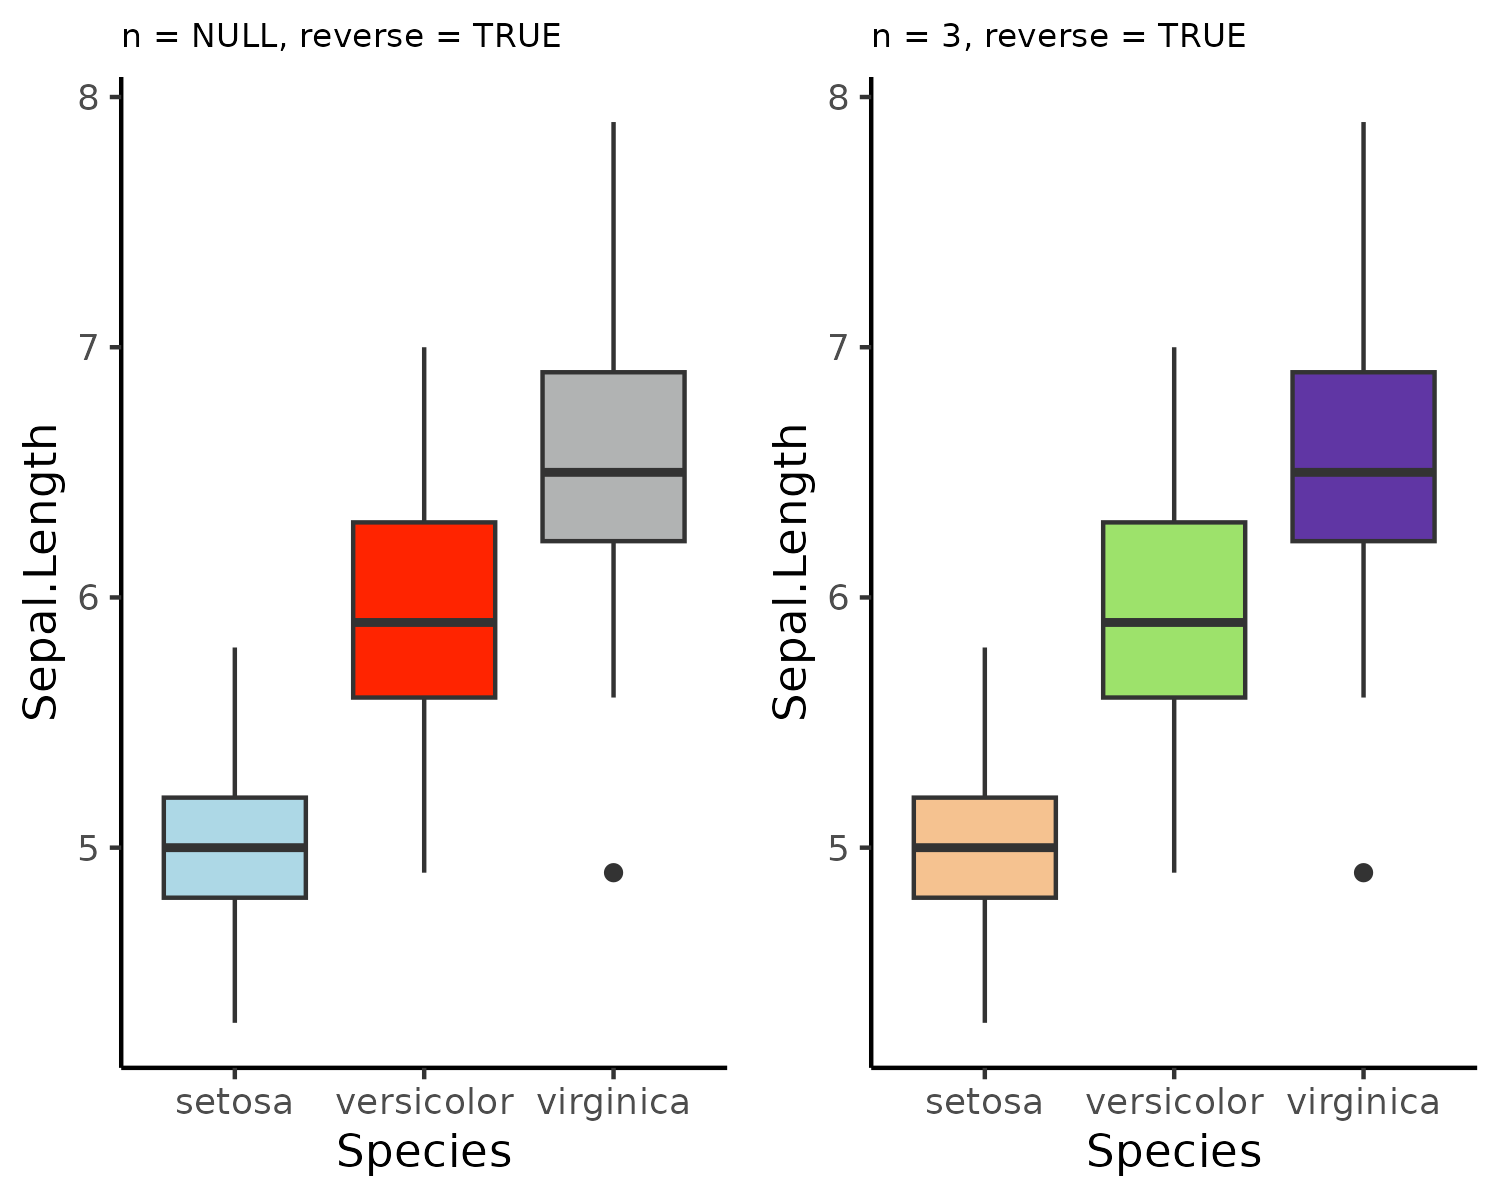
The reverse argument allows you to reverse the order of the color palette. You can experiment with the combination of n and reverse to control the reverse order for the entire palette or just the first n colors:
p1 <- ggplot(iris, aes(x = Species, y = Sepal.Length, fill = Species)) +
    geom_boxplot() +
    scale_fill_doypa(palette = "buzz", reverse = TRUE, discrete = TRUE) +
    theme_classic() +
    theme(legend.position = "none") +
    ggtitle("n = NULL, reverse = TRUE")

p2 <- ggplot(iris, aes(x = Species, y = Sepal.Length, fill = Species)) +
    geom_boxplot() +
    scale_fill_doypa(palette = "buzz", n = 3, reverse = TRUE, discrete = TRUE) +
    theme_classic() +
    theme(legend.position = "none") +
    ggtitle("n = 3, reverse = TRUE")

ggpubr::ggarrange(p1, p2)
For even more versatility, the ramp argument enables you to create a color ramp and interpolate colors from the chosen color palette:
ggplot(iris, aes(x = Species, y = Sepal.Length, fill = Species)) +
    geom_boxplot() +
    scale_fill_doypa(palette = "buzz", ramp = TRUE, discrete = TRUE) +
    theme_classic()
Feel free to explore the various combinations of arguments to discover all the captivating DOYPAColors palettes!


