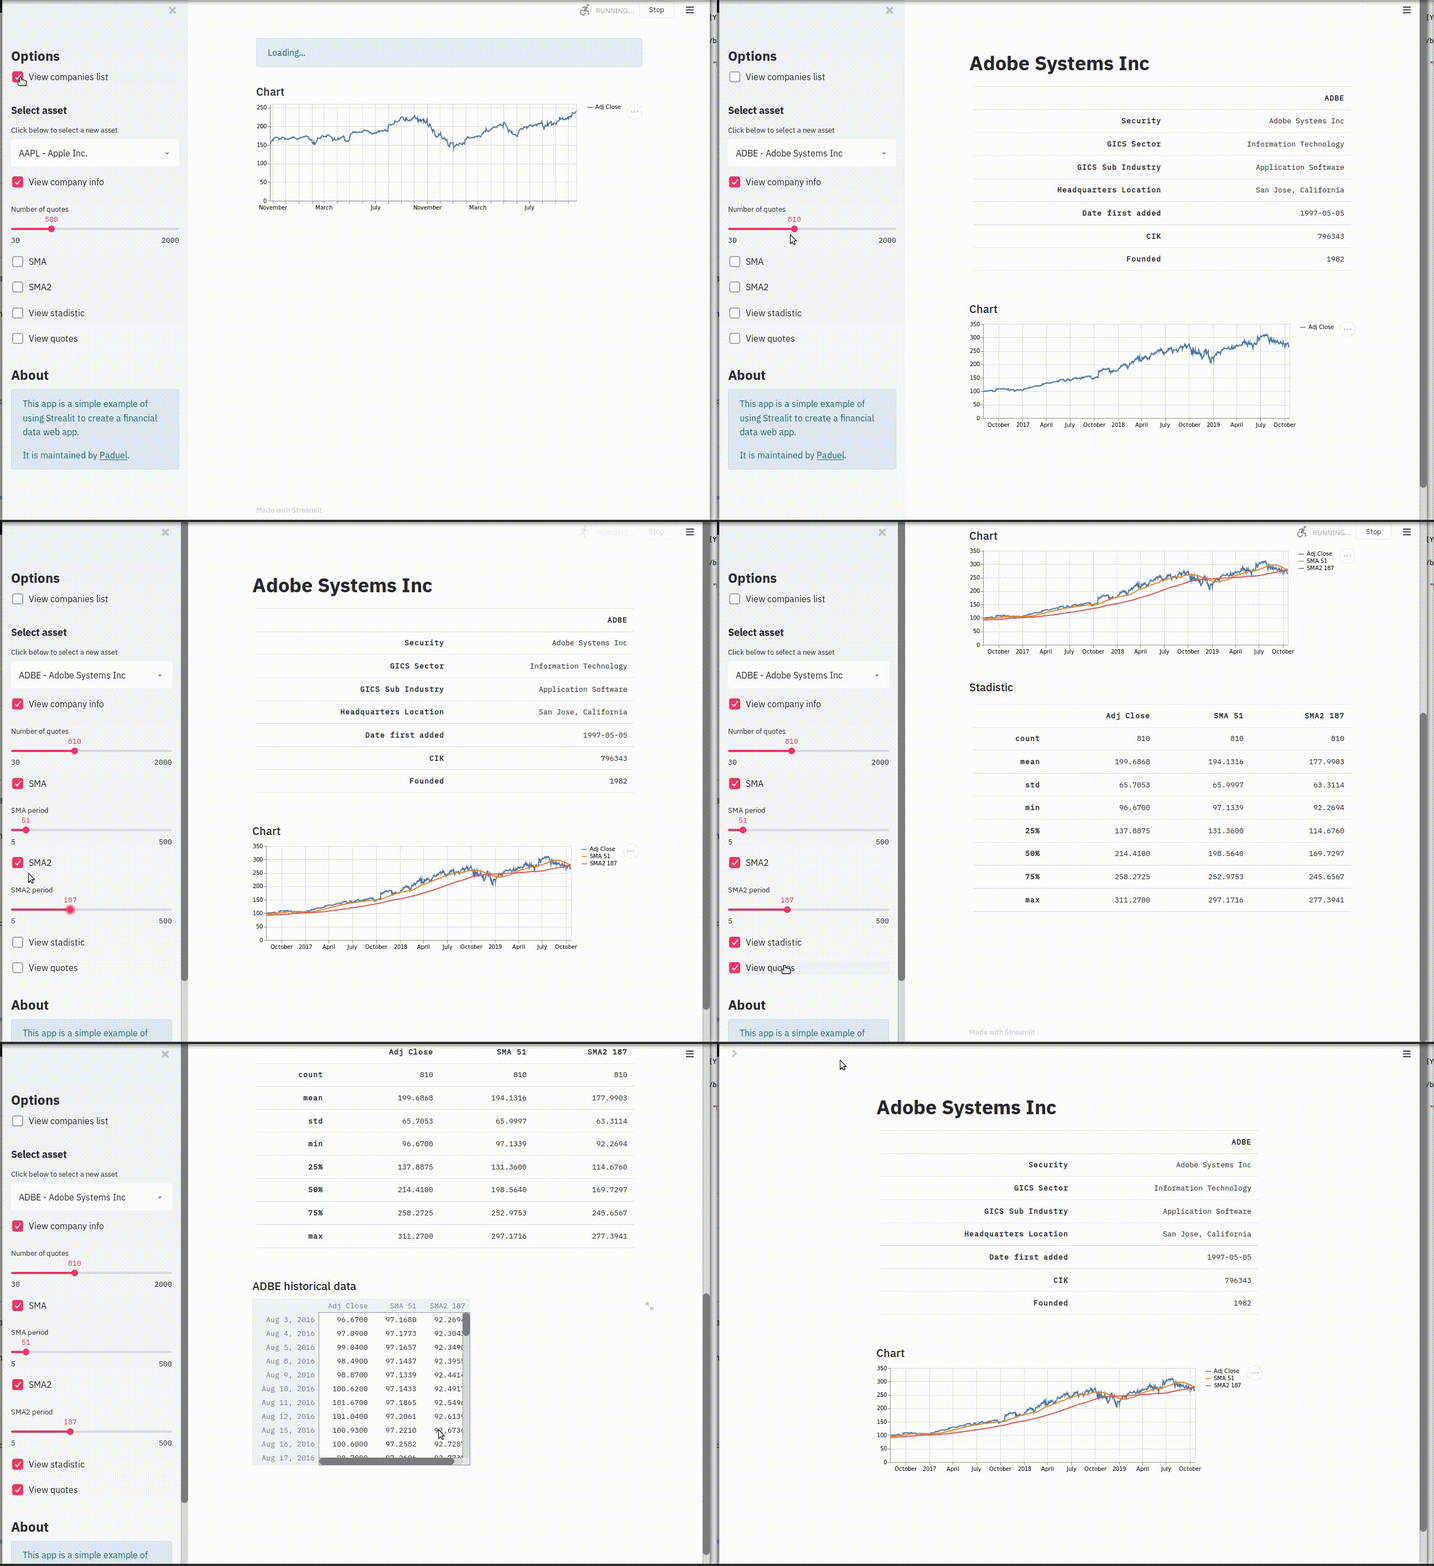
This app is a simple example of using Streamlit to create a financial data web app. This demo use streamlit, pandas and yfinance modules.
Allows you to select one of the 500 companies that compose the S&P 500 and display a updated chart of adjusted closing prices, as well as add a pair of moving averages.
Python3.6 version or superior
conda create -n streamlit python=3.12
conda activate streamlit
pip install -r requirements.txt
streamlit run app.py
conda env create -f environment.yml
conda activate streamlit
streamlit run app.py
I have only made minor edits to ensure this runs. The code is forked from here: https://github.com/paduel/streamlit_finance_chart
