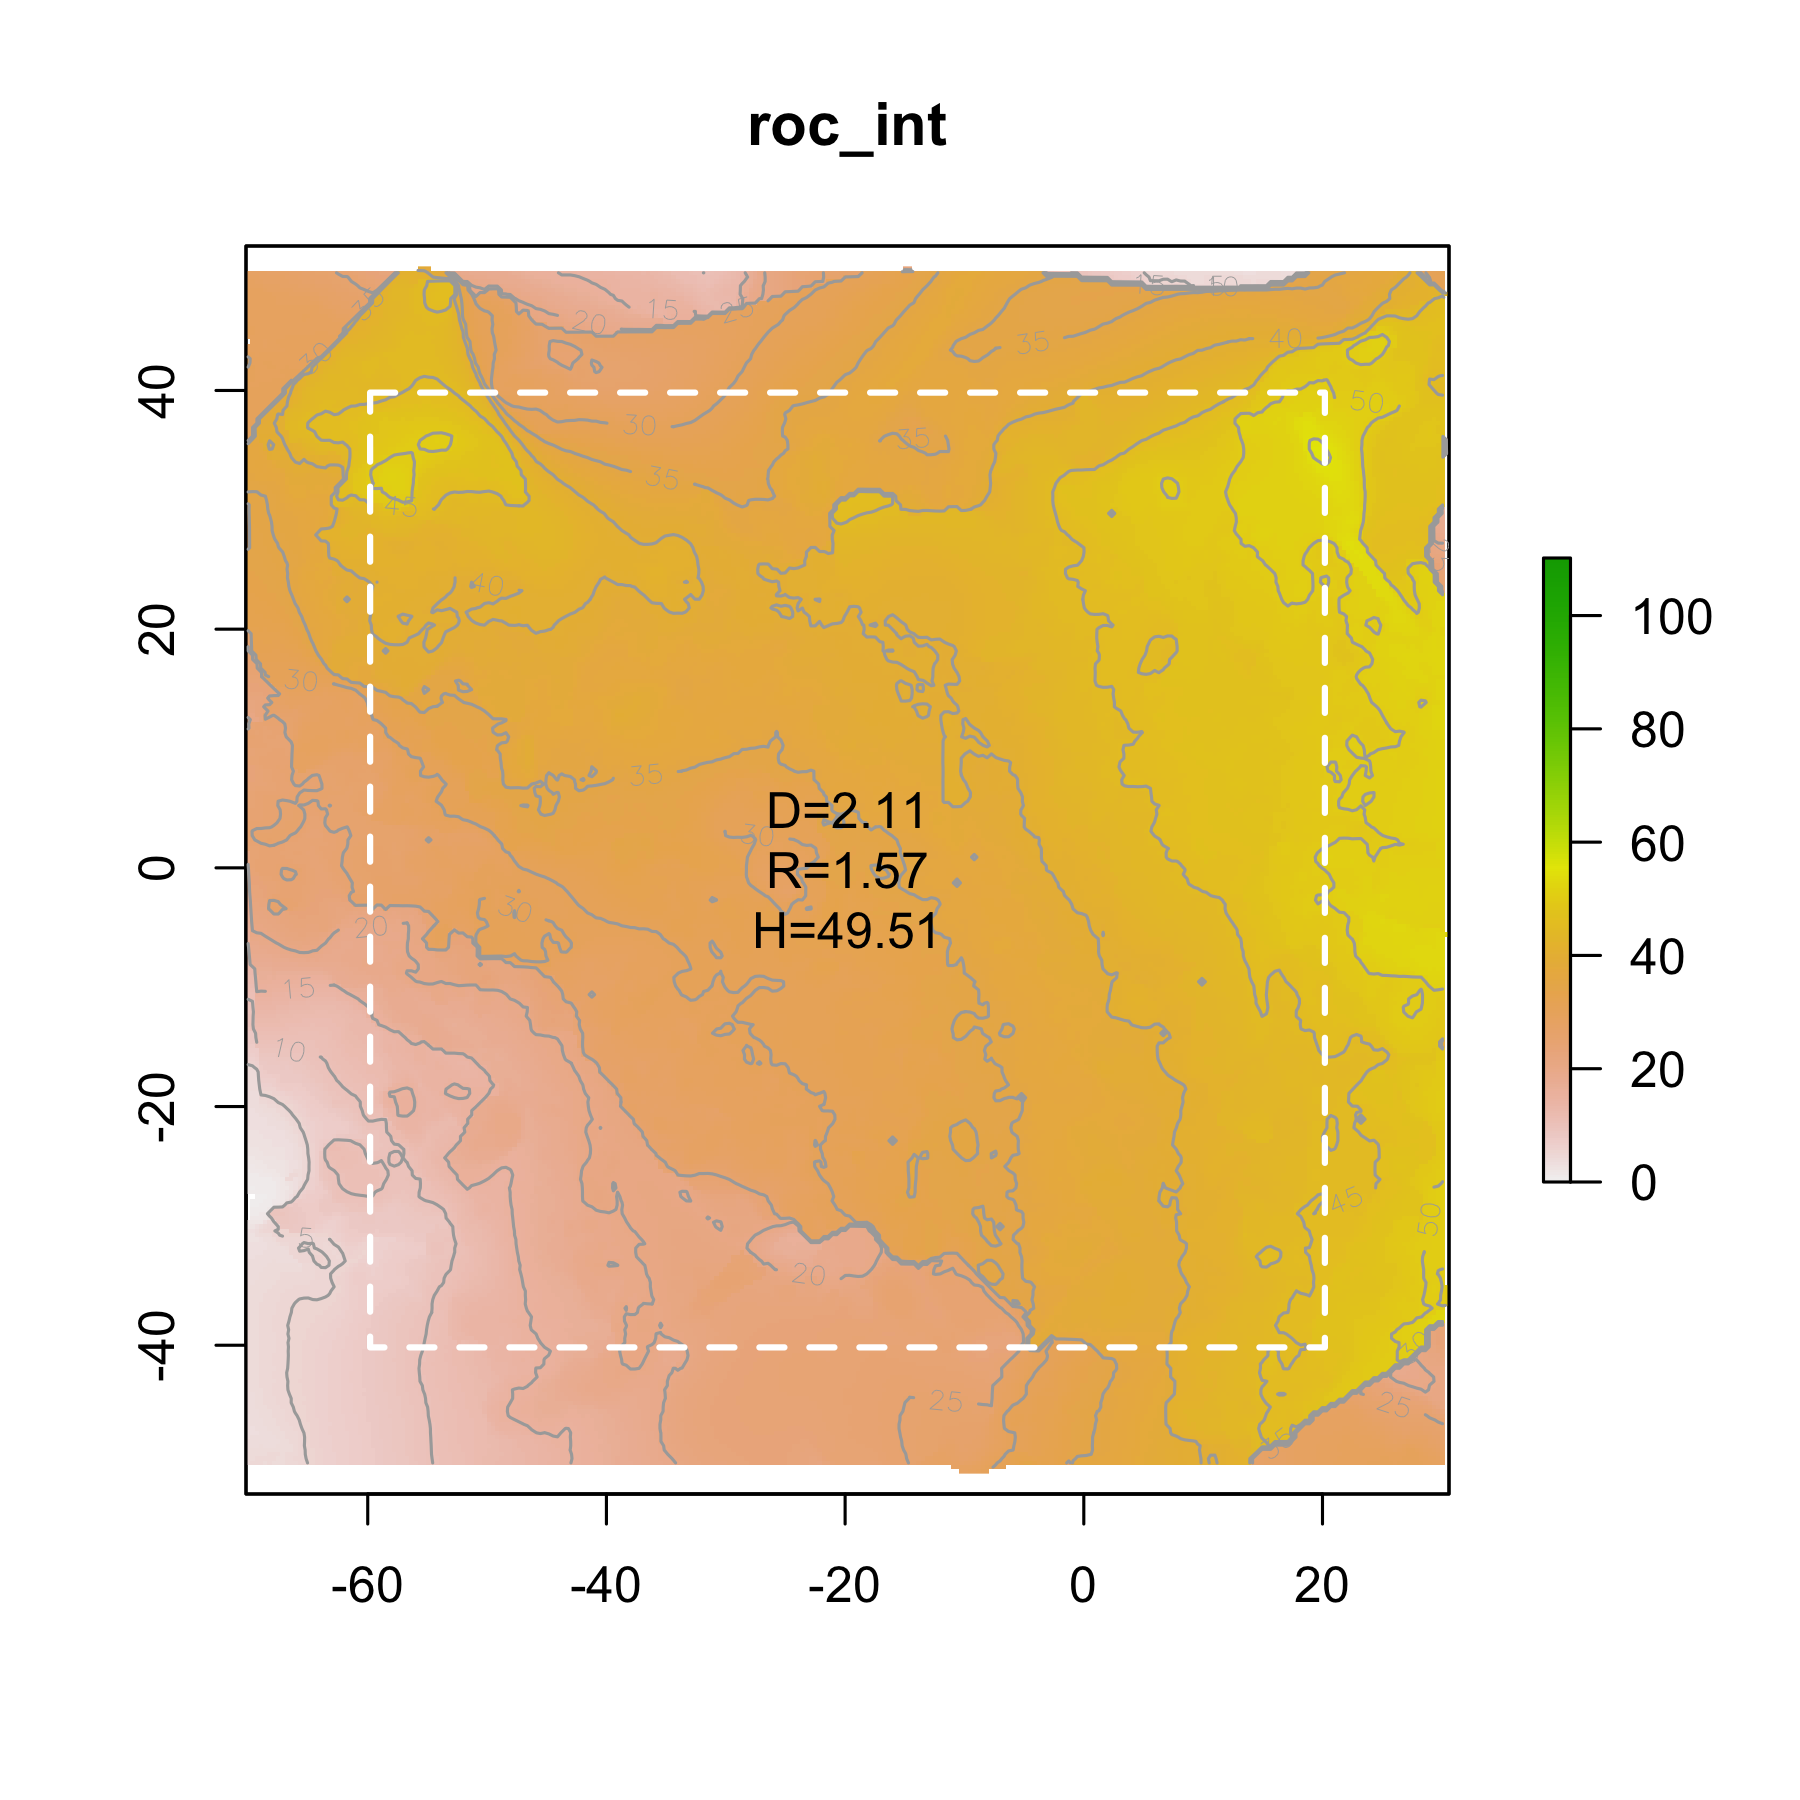
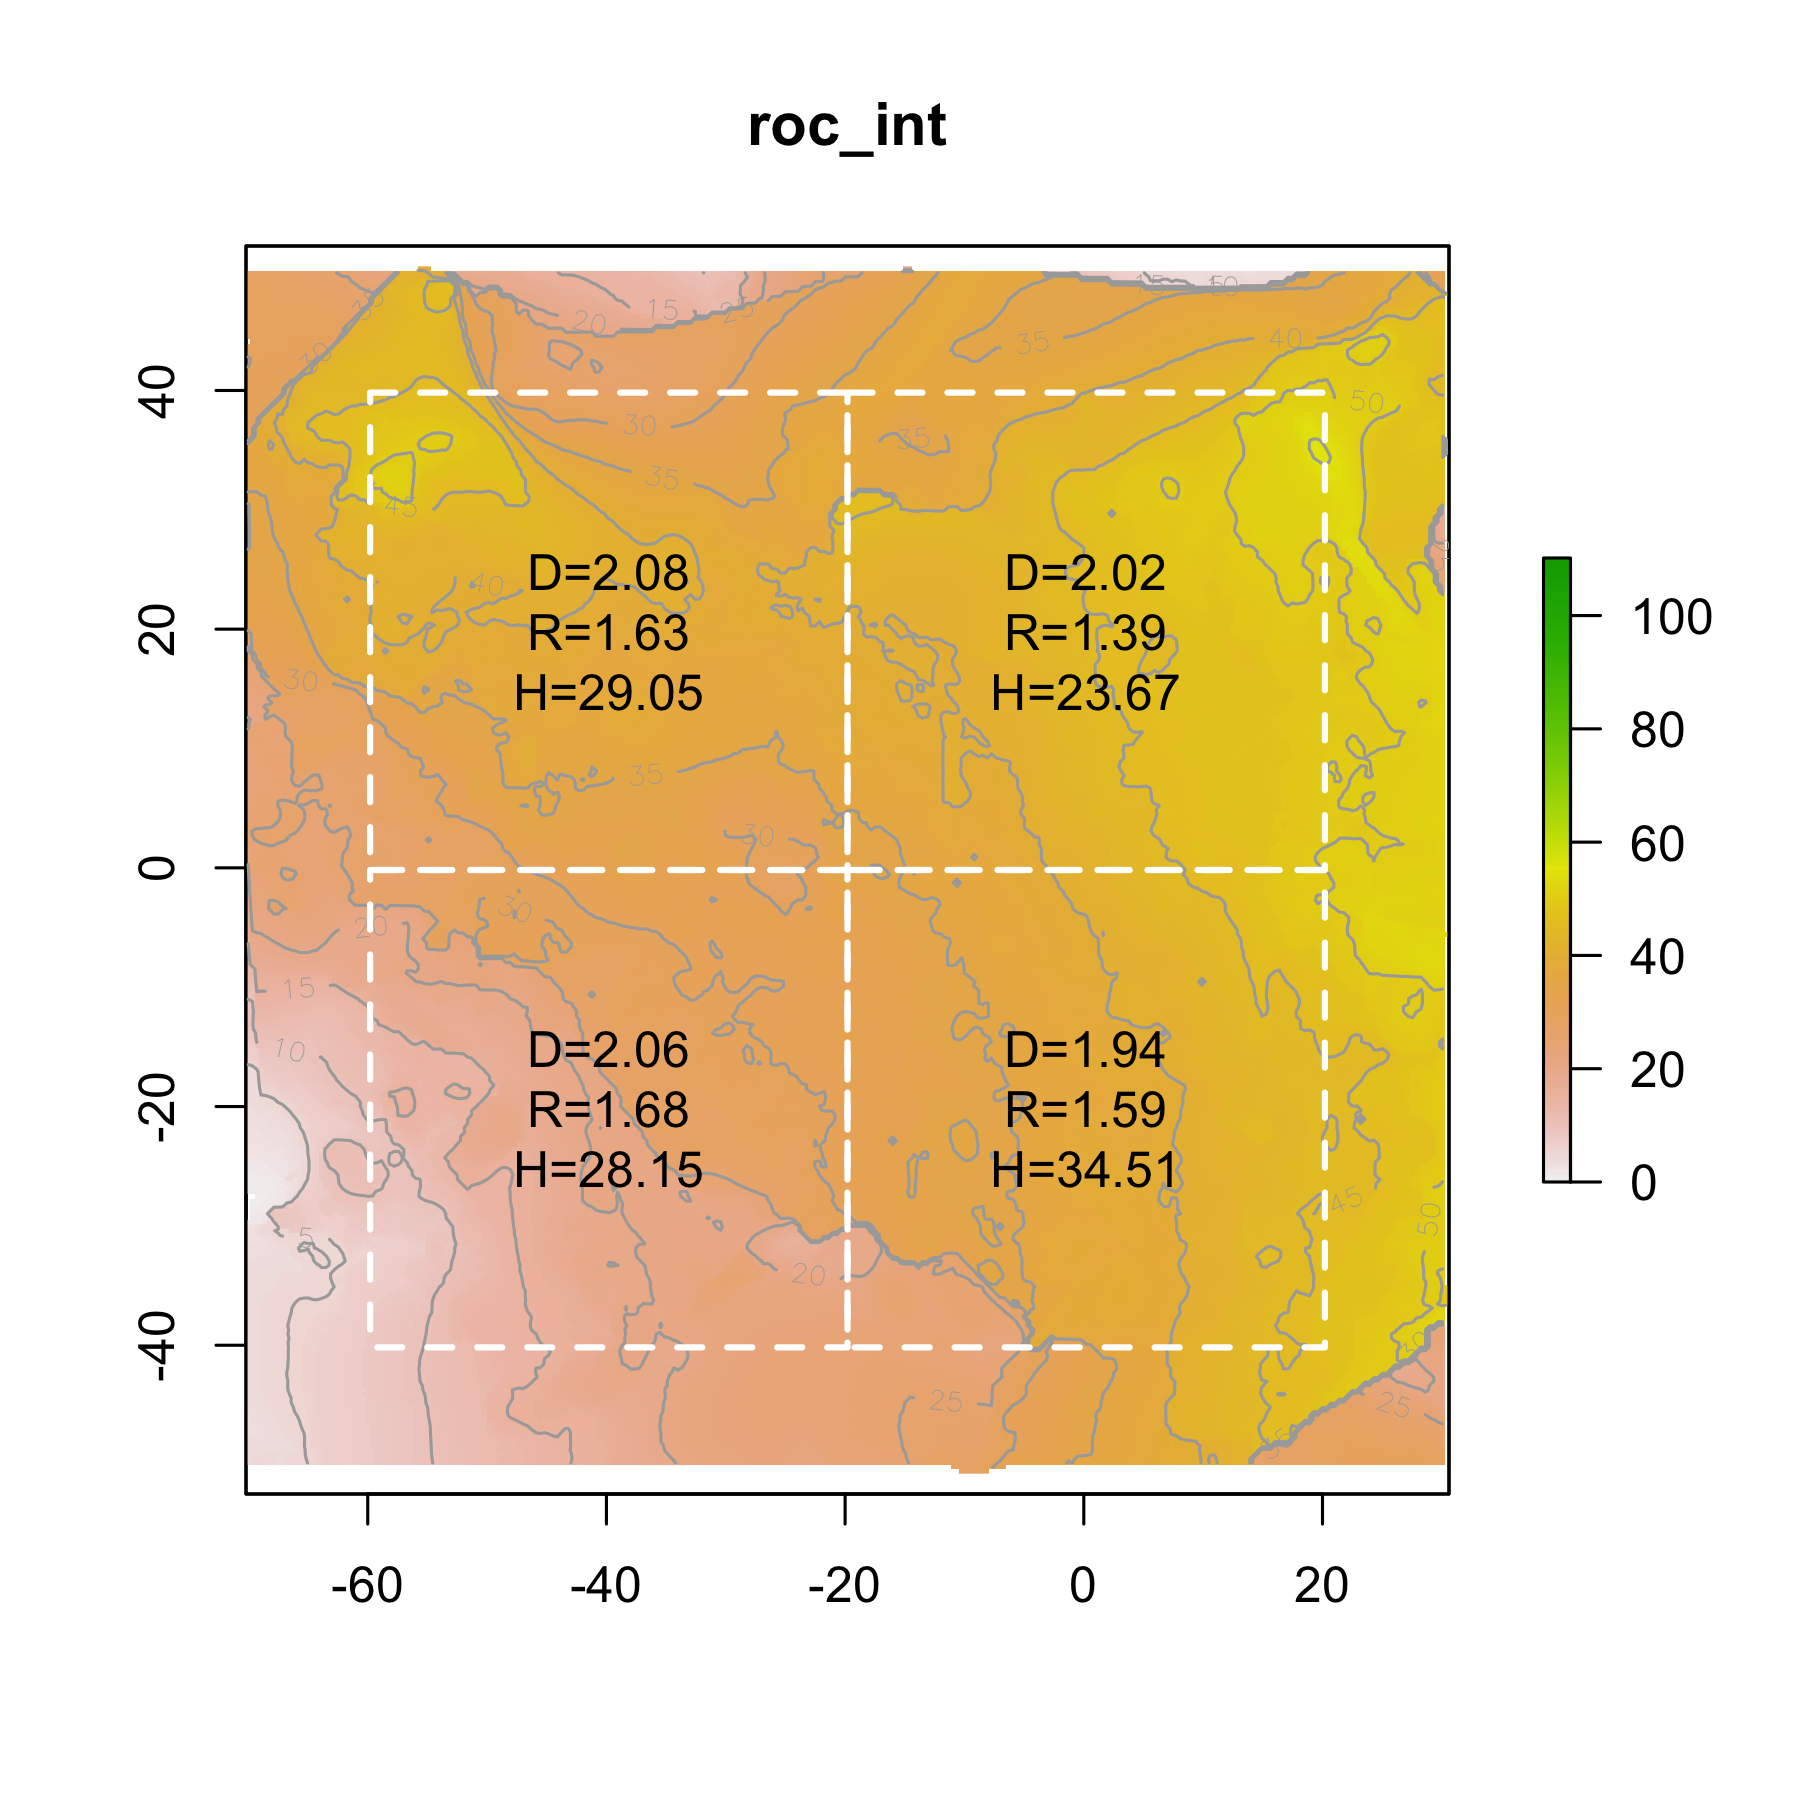
You need to pop the plot 1 folder you sent me into the data/oli folder.
Then you should be able to just run the analysis.R code. There are essentially these steps:
- Select the size of the patch for your calculations (
L) - Select the scales across which fractal dimension will be calculated (
scl), the smallest scale automatically is the resolution (L0) - Load a DEM file as
data(geotif). Here we load yourxyzfile and create a raster. This is a hack, but just to give you a feel for the process. - Pick the bottom left point of the patch (
x0andy0) - Run the
height_variation()function, which is essentially a wrapper function (seeR/functions.R). This function only requires the variables mentioned so far (L,scl,L0,data,x0andy0), so make sure there're assigned. The output of theheight_variation()function is the DEM height range the prescribed scales. For the largest scaleH(or 2x2m) there is only one value for the entire patch, and the next scale down (1x1m) there are four values, and so on. Best to assign the output to a variable and save it somewhere (see the Example), because the smallest scales are very time-consuming. - Calculate the surface descriptor metrics using the
rdh()function. This function only requires the output fromheight_variation().rdh()sends back a list with several metrics:
| Variable | Description |
|---|---|
| D | Fractal dimension from model fit |
| D_ends | Fractal dimension only considering the largest (L) and smallest (L0) scale |
| D_theory | Fractal dimension calculated from theory (i.e., from R and H) |
| R | Surface rugosity calculated using surfaceArea function in R |
| R_theory | Surface rugosity calculated from theory () |
| H | The height range (or height range at L) |


