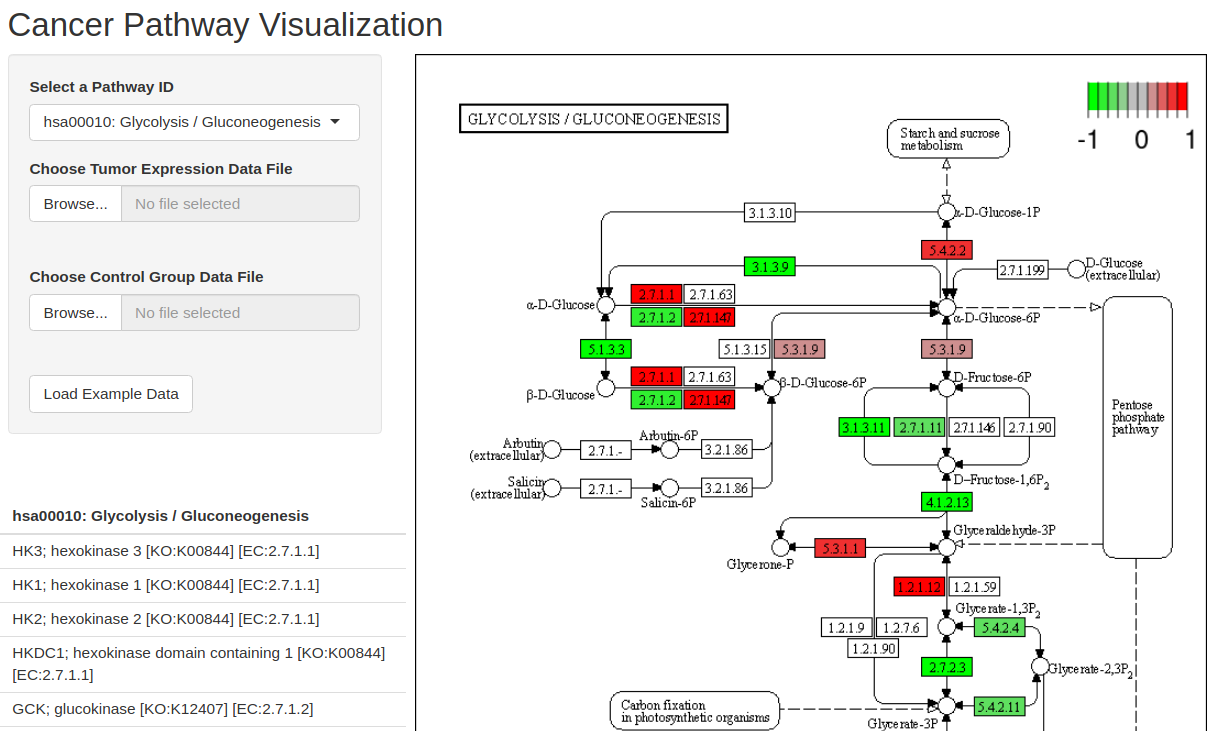
To get started with this R/Shiny app, follow these steps:
-
Create a New Directory: Open your terminal or file explorer and create a new directory where you want to set up the app. You can do this with the following command:
mkdir cancer-pathway-interactive-visualizer
Clone Repository
git clone https://github.com/jlog3/Cancer-Pathway-Interactive-Visualizer.git cancer-pathway-interactive-visualizer
-
Install Required R Packages:
# Install required R packages
install.packages("shiny", dependencies = TRUE)     # shiny (version >= 1.8.0)
install.packages("pathview", dependencies = TRUE)  # pathview (version >= 1.42.0)
install.packages("KEGGREST", dependencies = TRUE)  # KEGGREST (version >= 1.42.0)
install.packages("TCGAbiolinks", dependencies = TRUE)  # TCGAbiolinks (version >= 2.30.0)
install.packages("Biostrings", dependencies = TRUE)   # Biostrings (version >= 2.70.1)
install.packages("biomaRt", dependencies = TRUE)      # biomaRt (version >= 2.58.0)
install.packages("SummarizedExperiment", dependencies = TRUE)  # SummarizedExperiment (version >= 1.32.0)
install.packages("DESeq2", dependencies = TRUE)       # DESeq2 (version >= 1.42.0)
install.packages("AnnotationDbi", dependencies = TRUE) # AnnotationDbi (version >= 1.64.1)
install.packages("org.Hs.eg.db", dependencies = TRUE) # org.Hs.eg.db (version >= 3.18.0)- Run the Shiny App: After installing the packages, you can run the Shiny app using the following command in R:
shiny::runApp("/path/to/shiny_app/")Click "Load Example Data" and wait for plot to update.

Two CSV files are required for plotting.
- Experiment/Tumor Data
- Control/Healthy Data
One of these files should look like this:
Rows are ensembl gene ids. Columns are sample names.
Each file/group must contain at least two samples (columns). This allows you to make meaningful comparisons and identify genes that are differentially expressed between the conditions and gain insights into the molecular differences associated with the disease or condition of interest.
- Go to GDC Cancer Data Portal.
- Under the “Program” dropdown, select “TCGA”.
- Choose your project of interest.
- Follow the R script
downloadTCGA.R. - Follow directions for changing the project and sample type as you require.
- Use the downloaded CSV file with the Shiny App.
-
Tissue-Specific Expression:
- For accurate pathway analysis, the data should ideally come from the same tissue or cell type that is under study in the pathway.
- Gene expression can vary significantly between different tissues or cell types. Certain genes may be highly expressed in one tissue but not in others.
-
Stage of Disease:
- The stage of the disease can also affect gene expression profiles. Users should consider whether their data reflects the disease stage relevant to their research.
-
Inter-Patient Variability:
- Variability between patients can impact gene expression profiles. If the goal is to draw broader conclusions, it’s beneficial to use data that represents a cross-section of the patient population affected by the specific cancer.
-
Consistency in Data Sources:
- Consistency in the source of data is important. Mixing data from different tissues, disease stages, or patient profiles without proper controls can lead to misleading conclusions.
You are encouraged to submit data containing the genes in the selected pathway, but the app is flexible and will tell you which genes in the pathway are not found in your data.
To learn more about this project and differential expression analysis (as well as cancer gene analysis), you can read the Sample Level QC in RNA-seq.
- Allow users to mark columns as belonging to different conditions (e.g., normal tissue vs. tumor). This aids in comparative analysis and is crucial for cancer research.
- Handle different types of gene IDs and map between different ID types. Increases the flexibility and usability of the tool.
- Accept other forms of data such as raw counts, normalized counts, log-transformed values, and fold changes. Ask users to specify the type of expression values (raw, normalized, log-transformed, fold change, etc.) and process them accordingly.
-
Enhanced Understanding of Cancer Biology
- Visualizing Complex Data: Cancer research generates vast amounts of complex data. This tool will visually map these data onto biological pathways, making it easier to understand.
- Highlighting Key Mutations: By focusing on altered pathways and frequently mutated or dysregulated components in different cancer types, the tool will help in pinpointing critical areas of cancer biology.
-
Facilitating Research and Discovery
- Identifying Potential Targets: Visualizing altered pathways can help researchers identify potential therapeutic targets.
- Comparative Analysis: Allows comparison of pathways across different types of cancer, potentially revealing common or unique alteration patterns.
-
Educational Tool
- Teaching Aid: Can be used as an educational resource for students and new researchers to understand cancer biology.
- Interactive Learning: The interactive nature of the tool enhances learning by allowing users to explore and manipulate data.
-
Personalized Medicine
- Tailored Therapies: Understanding specific pathway alterations in different cancers can guide the development of personalized treatment strategies.
-
Collaboration and Sharing
- Data Sharing Platform: Researchers can use the tool to share findings, facilitating collaborative efforts.
- Integrating Diverse Data Sources: The tool can integrate data from various sources, offering a comprehensive view of cancer pathways.
-
Accessibility and User Engagement
- User-Friendly Interface: Makes complex cancer genomics data accessible to a broader audience, including those without deep bioinformatics skills.
- Encouraging Exploration: The tool's interactive nature encourages users to explore and ask new research questions.
-
Data-Driven Decision Making
- Clinical Decision Support: For clinicians, the visualizer can aid in understanding the molecular basis of a patient's cancer, supporting more informed decision-making.
-
Supporting Hypothesis Generation and Testing
- Discovery of Novel Insights: By visually mapping cancer pathways, new hypotheses about cancer development and progression can be generated and tested.
In summary, the Cancer Pathway Interactive Visualizer serves as a powerful tool for visualizing complex cancer genomics data, facilitating research, education, and clinical decision-making, and fostering a deeper understanding of cancer biology.
