Sdb
A socket-based remote debugger for Python. Based on celery.contrib.rdb.
Usage
Use the sdb library to set remote breakpoints in any non-interactive or
background Python code and debug interactively over a telnet session:
   # some/python/code.py

   class SomeCode(object):

       def run(self, **kwargs):
           # This will set a breakpoint and open an interactive Python
           # debugger exposed on a random port between 6899-6999.  The chosen
           # port will be reported as a warning
           #
           # Remote Debugger:6900: Please telnet into 0.0.0.0 6900.
           #
           # You can access it from your host machine using telnet:
           #
           # $ telnet <hostname> <port>
           import sdb
           sdb.set_trace()
Keep in mind that when you interactively debug in this way, any process
that encounters a breakpoint will wait until an active client is established
and concludes the debugging session with a continue command.
Automatically Connecting to Breakpoints
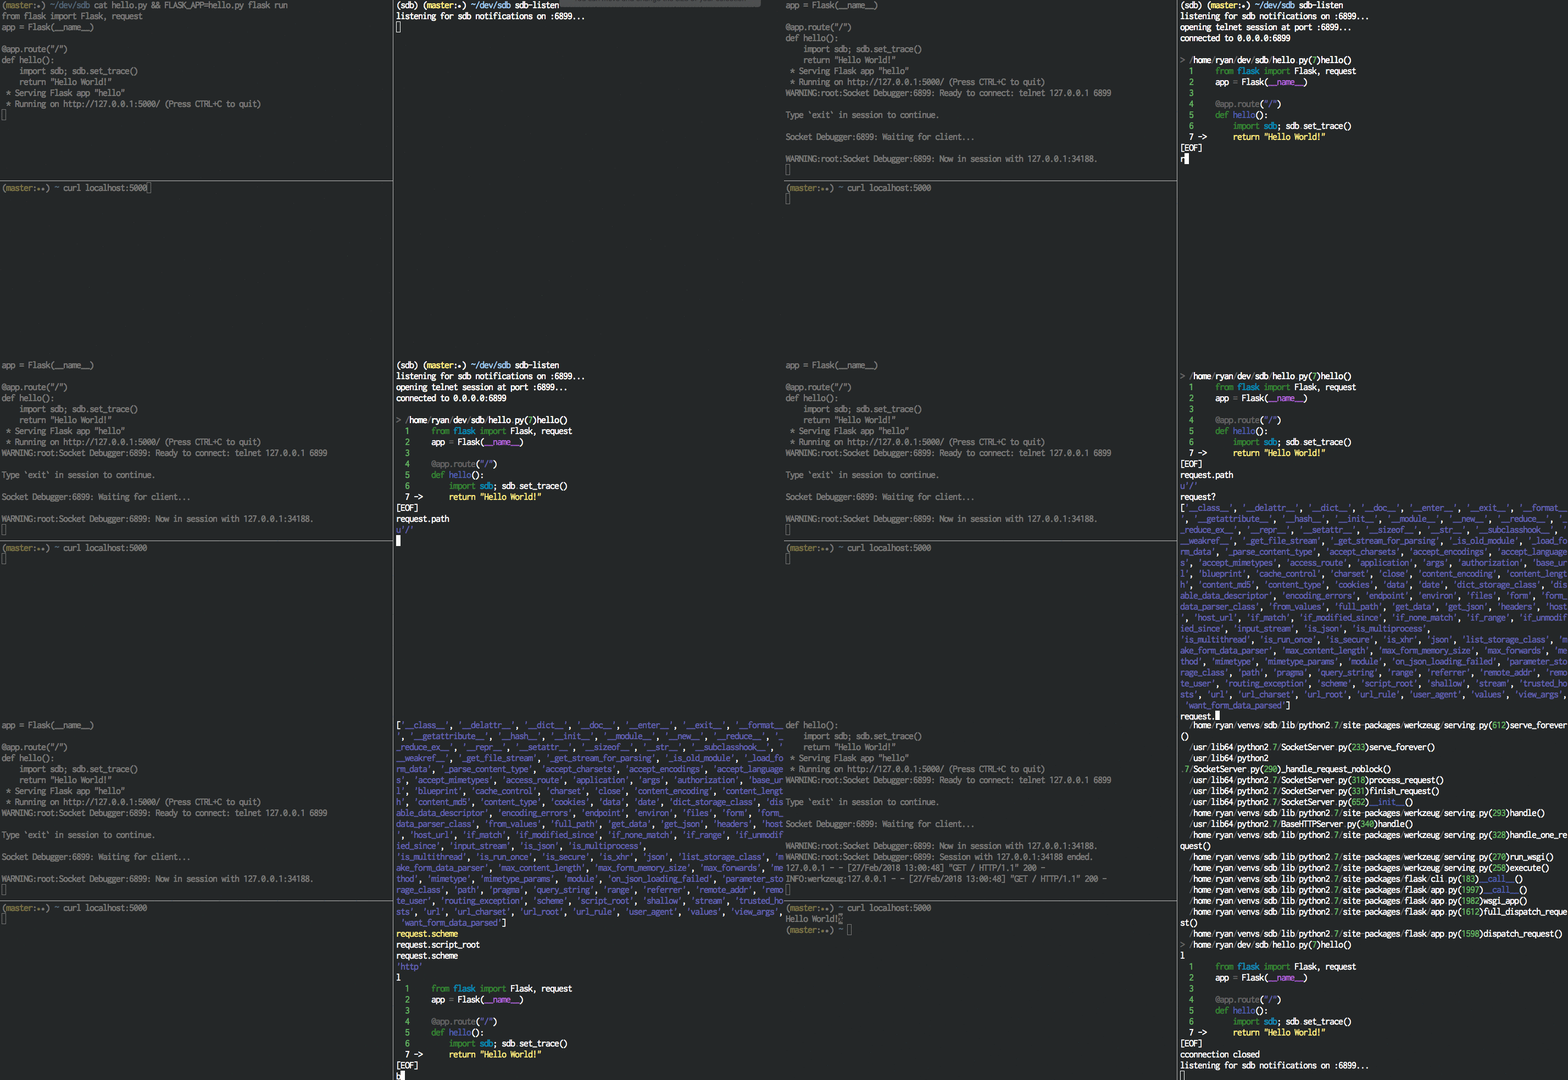
To simplify remote debugging session management, you can use sdb-listen
to automatically discover open remote debugging sessions and connect to them:
$ sdb-listenThis will open a Python process that listens for new debugger sessions and
automatically connects to them for you. If your breakpoint is run on
an entirely different host, you can optionally specify the hostname where
sbd-listen is running:
   import sdb
   sdb.Sdb(notify_host='docker.for.mac.host.internal').set_trace()
The sbd-listen tool also includes support for tab-completion and history
tracking.
Triggering sdb with a Signal
If you want to debug a running process without setting a specific breakpoint,
a set_trace() call can be triggered via SIGTRAP:
import sdb
sdb.sigtrap()

long_running_process()
$ kill -5 <pid-of-process>This is particularly useful for investigating Python processes that appear to be hung.
Other Tips
sdb supports the same commands and aliases as Python's default pdb implementation.
sdb colorizes output by default. To disable this:
   import sdb
   sdb.Sdb(colorize=False).set_trace()
sdb includes a few additional debugger aliases that make interactive debugging more pleasant:
- Prefix commands with an integer to repeat them. For example,
10nis the same as runningnext10 times in a row. ?is the same as callingdir()??can be added to the end of a function call to view its source lines e.g.,requests.post??might print:
def post(url, data=None, json=None, **kwargs):
    r"""Sends a POST request.

    :param url: URL for the new :class:`Request` object.
    :param data: (optional) Dictionary (will be form-encoded), bytes, or file-like object to send in the body of the :class:`Request`.
    :param json: (optional) json data to send in the body of the :class:`Request`.
    :param \*\*kwargs: Optional arguments that ``request`` takes.
    :return: :class:`Response <Response>` object
    :rtype: requests.Response
    """

return request('post', url, data=data, json=json, **kwargs)- By default,
sdbattempts to fill your entire console with debugger output (representing the current line position for the current frame). You can adjust the height ofsdb's draw window with thelinescommand, e.g.,lines 15.
