本文是作者工作中需要对atlas(360开源的mysql中间件,可实现读写分离、分表、多从库负载均衡)以及后期对proxysql(另一款高效并很有特色的数据库代理软件)进行测试时所设计和采用的一套脚本。由于对中间件测试,要测试对比的维度较多,所以尽量将涉及到的因素都纳入脚本中以实现自动化的压测和分析过程。总体思路如下:
准备测试数据(这步在脚本之外人工完成) -->
运行脚本测试(压测线程数在脚本里定义,压测次数默认为3) -->
脚本将测试输出格式化后写入数据库 -->
脚本加 analyse 参数 --> 将压测分析结果打印到标准输出
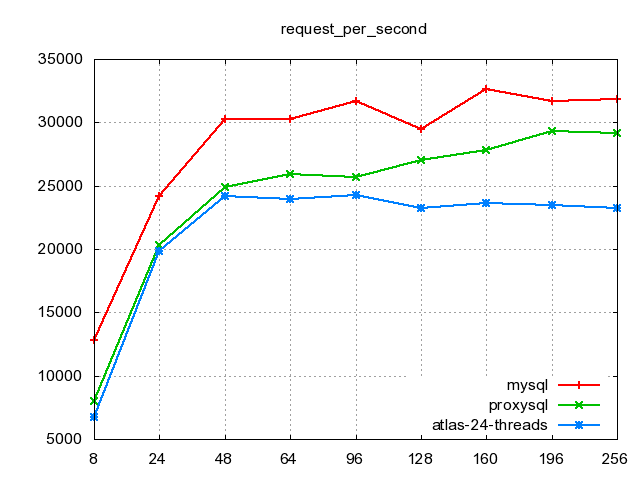
脚本加 chart 参数 --> 对压测结果中的所有测试场景进行绘图
脚本加 chart '测试场景'... --> 只对给定的'测试场景进行绘图'
脚本依赖于sysbench-0.5和gnuplot
下面来看下脚本使用说明及用例截图
帮助信息:
[ljk@demo ~]$ sh shells/mysql_oltp_test.sh -h

Usage: shells/mysql_oltp_test.sh test (test_scenario test_type mysql_host mysql_port mysql_user mysql_password)
       shells/mysql_oltp_test.sh analyse
       shells/mysql_oltp_test.sh chart [scenario]...

----------
测试: 子命令test
      test_scenario: 自定义的测试场景名
      test_type: read-only 或 read-write, 表示测试模式
      其余4参数表示待测试MySQL连接相关信息,密码若包含特殊字符,将其置于单引号内
----------
分析: 子命令analyse
      展示分析结果
----------
画图: 子命令chart
      会在/tmp/下生成request_per_second.png total_time.png 95_pct_time.png 三张图
      chart (对分析结果中的所有测试场景画图)
      chart scenario ... (对指定的测试场景画图,场景名依据先前自定义的名称)
进行测试:
[ljk@demo ~]$ sh shells/mysql_oltp_test.sh test localhost_read_only  read-only 127.0.0.1 3306 user 'passwd'

---------------
创建测测试结果表test.sysbench_test
---------------

---------------
场景:localhost_read_only 模式:read-only
---------------
  8线程    第1次运行...
  24线程   第1次运行...
  48线程   第1次运行...
  64线程   第1次运行...
  96线程   第1次运行...
  128线程  第1次运行...
  160线程  第1次运行...
  196线程  第1次运行...
  256线程  第1次运行...
查看分析结果:
[ljk@demo ~]$ sh shells/mysql_oltp_test.sh analyse
Warning: Using a password on the command line interface can be insecure.
scenario        server_name     test_type       sb_threads      server_load     request_total   request_read    request_write   request_per_second      total_time      95_pct_time
single-mysql-remote     192.168.1.3    read-only       8       1.48    280000  280000  0       14269.88        19.78   17.32
single-mysql-remote     192.168.1.3    read-only       24      1.55    280016  280016  0       23933.22        11.81   111.12
single-mysql-remote     192.168.1.3    read-only       48      1.83    280022  280022  0       26868.16        10.47   225.34
single-mysql-remote     192.168.1.3    read-only       64      2.02    280016  280016  0       28269.55        9.95    231.25
single-mysql-remote     192.168.1.3    read-only       96      1.88    280012  280012  0       29160.26        9.62    409.48
single-mysql-remote     192.168.1.3    read-only       128     1.92    280016  280016  0       31032.74        9.04    443.33
single-mysql-remote     192.168.1.3    read-only       160     1.90    280012  280012  0       30906.38        9.07    616.22
single-mysql-remote     192.168.1.3    read-only       196     2.19    280022  280022  0       31525.47        8.89    647.59
single-mysql-remote     192.168.1.3    read-only       256     2.35    280009  280009  0       31965.53        8.77    844.62
single-mysql-remote     192.168.1.3    read-only       512     2.48    280012  280012  0       31291.09        9.15    1362.92
proxysql-1.3.0e 192.168.1.4    read-only       8       0.96    280005  280005  0       10092.85        27.79   25.06
proxysql-1.3.0e 192.168.1.4    read-only       24      1.00    280009  280009  0       19884.42        14.10   159.36
proxysql-1.3.0e 192.168.1.4    read-only       48      1.30    280014  280014  0       23239.66        12.07   232.69
proxysql-1.3.0e 192.168.1.4    read-only       64      1.28    280023  280023  0       25746.88        10.89   238.74
proxysql-1.3.0e 192.168.1.4    read-only       96      1.25    280014  280014  0       28304.34        9.90    434.78
proxysql-1.3.0e 192.168.1.4    read-only       128     1.52    280014  280014  0       27669.46        10.22   481.75
proxysql-1.3.0e 192.168.1.4    read-only       160     1.68    280028  280028  0       30020.32        9.34    606.40
proxysql-1.3.0e 192.168.1.4    read-only       196     1.69    280028  280028  0       30620.70        9.15    682.21
proxysql-1.3.0e 192.168.1.4    read-only       256     1.76    280033  280033  0       31710.98        8.83    826.42
proxysql-1.3.0e 192.168.1.4    read-only       512     1.65    280028  280028  0       32398.24        8.65    1289.20
对结果进行画图:
#对存在于表中的所有场景进行横向对比画图
[ljk@demo ~]$ sh shells/mysql_oltp_test.sh chart
对特定的场景进行(横向对比)画图
[ljk@demo ~]$ sh shells/mysql_oltp_test.sh chart single-mysql-remote proxysql-use-ps
效果图展示:
接下来我们来了解一下sysbench-0.5对MySQL进行测试的方法及原理
sysbench-0.5,对于数据库的测试较0.4版本有较大不同,之前有内建的--test=oltp方法,现在改成了外部的lua脚本形式,这样更灵活,也方便用户构建自己的测试模型。
这些相关的lua脚本位于”/usr/share/doc/sysbench/tests/db/“ 目录,其内脚本如下图所示

我们需要了解我们最有可能用到的三个脚本:common.lua(公共脚本)、oltp.lua(oltp测试主脚本)和parallel_prepare.lua(并行准备数据)。common.lua中定义了一些选项的默认值(故而,这些选项的值既可以通过命令行指定也可直接修改该脚本里对应值来更改).
简单说一下oltp.lua脚本的逻辑:
默认通过显式的使用begin和commit语句将如下模式的sql组合在一起形成一个事务(只读测试的话则没有写请求)

关于oltp '读写'和'只读'测试的语句及其出现比例如下

10条    SELECT c FROM sbtest6 WHERE id=5047;
1条    SELECT c FROM sbtest16 WHERE id BETWEEN 5050 AND 5050+99;
1条    SELECT SUM(K) FROM sbtest7 WHERE id BETWEEN 5039 AND 5039+99;
1条    SELECT c FROM sbtest7 WHERE id BETWEEN 4987 AND 4987+99 ORDER BY c;
1条    SELECT DISTINCT c FROM sbtest7 WHERE id BETWEEN 13 AND 13+99 ORDER BY c;
1条    UPDATE sbtest1 SET k=k+1 WHERE id=1234;
1条    UPDATE sbtest2 SET c='78864443858-59732318638' where id=2345;
1条    DELETE FROM sbtest11 WHERE id=4958;
1条    INSERT 语句;

然后将此事务循环执行10000次。也就是只读测试共14w请求,混合测试18w请求。
若觉得数量不够,可以修改common.lua中的设置

function set_vars()
   oltp_table_size = oltp_table_size or 10000
   oltp_range_size = oltp_range_size or 100
   oltp_tables_count = oltp_tables_count or 1
   oltp_point_selects = oltp_point_selects or 20 (原来10)
   oltp_simple_ranges = oltp_simple_ranges or 2 (原来1)
   oltp_sum_ranges = oltp_sum_ranges or 2 (原来1)
   oltp_order_ranges = oltp_order_ranges or 2 (原来1)
   oltp_distinct_ranges = oltp_distinct_ranges or 2 (原来1)
   oltp_index_updates = oltp_index_updates or 1

   oltp_non_index_updates = oltp_non_index_updates or 1

这样总的测试请求量会变成28w
以上是通过lua脚本里总结出来的,各位也可查看下这些lua脚本,来更好的理解测试的逻辑过程。
一般来说,对MySQL做压测会基于两种需求:
- 一种是通过压测来大致评估MySQL实例的最大能力,这种适合给定时长来测;
- 另一种就是来对比某些改动前后的性能变化(如版本升级、参数调整等),这种适合给定请求数来测。
以作者的小经验来看,后者要更多一些,所以我的测试模式也是趋向于后者的。
前提功课做好了,接下来一起看一下本例的测试过程
准备数据:
(手动创建)在被测的mysql上执行如下命令(以8线程并发创建16张50w数据的表)
sysbench --test=/usr/share/doc/sysbench/tests/db/parallel_prepare.lua \
         --mysql-table-engine=innodb --oltp-table-size=500000 --mysql-user=user \
         --mysql-password='passwd' --mysql-port=3306 --mysql-host=192.168.1.33 \
         --oltp-tables-count=16 --num-threads=8 run
还有另外一种方式,用oltp.lua脚本以串行方式准备数据
sysbench --test=/usr/share/doc/sysbench/tests/db/oltp.lua --mysql-table-engine=innodb \
         --oltp-table-size=500000 --mysql-user=user --mysql-password='passwd' \
         --mysql-port=3306 --mysql-host=192.168.1.3 --oltp-tables-count=16 prepare
开始测试:
sh mysql_oltp_test.sh test atlas-24-threads read-only 192.168.1.44 3306 user passwd
清空测试数据:
sysbench --test=/usr/share/doc/sysbench/tests/db/parallel_prepare.lua \
--mysql-user=user --mysql-password='passwd' --mysql-port=3306 \
--mysql-host=192.168.1.3 --oltp-tables-count=16 --num-threads=8 cleanup