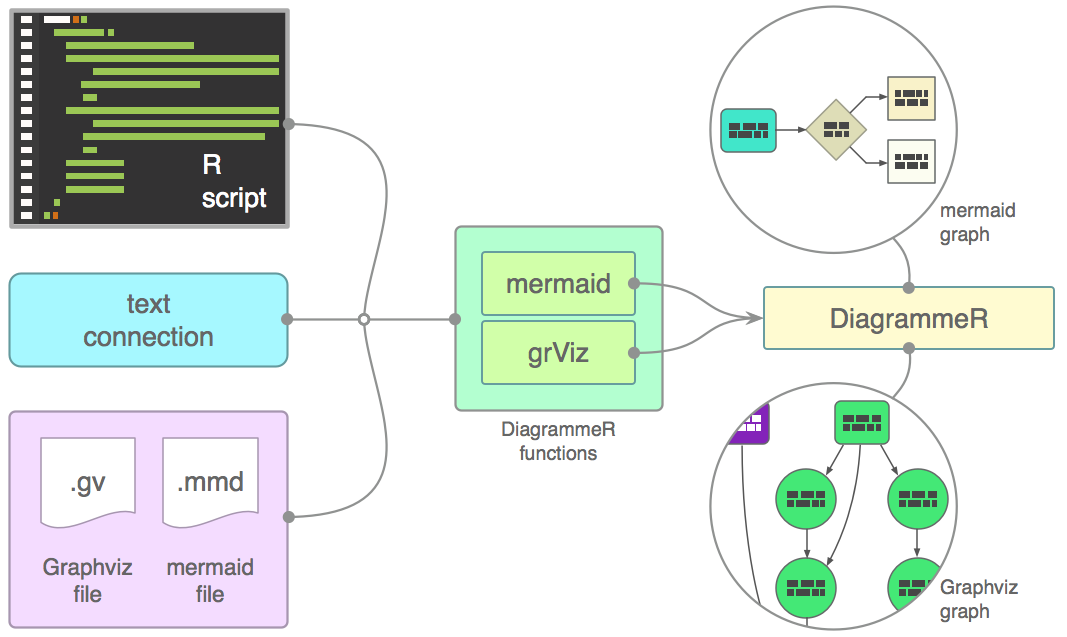
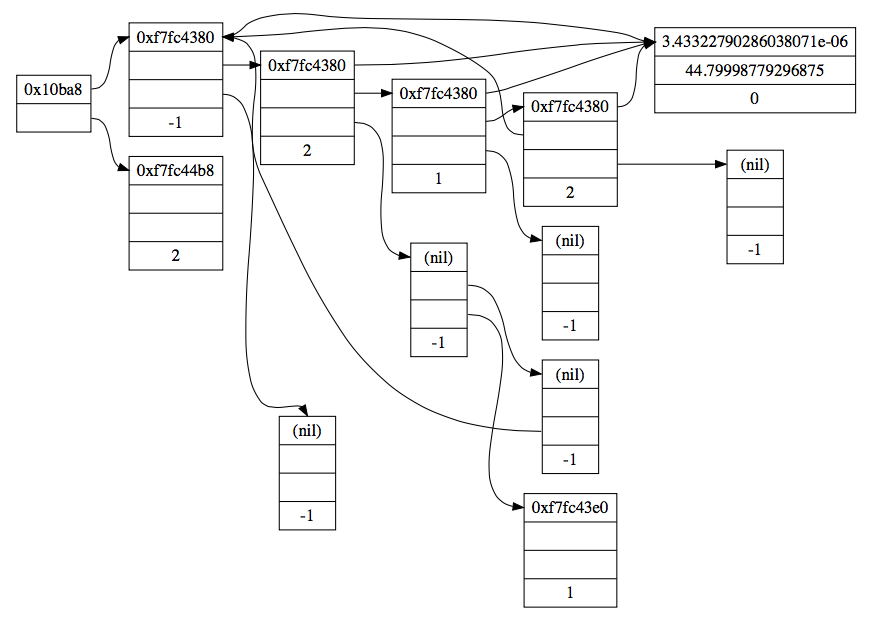
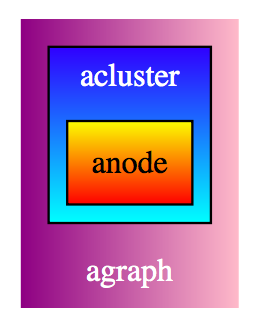
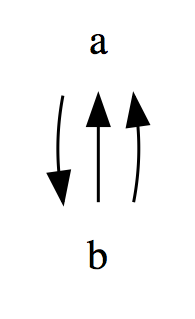
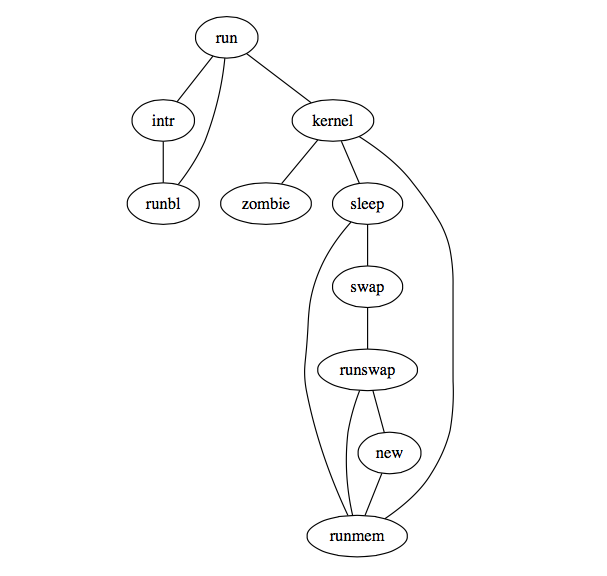
With the DiagrammeR package, you can create diagrams and flowcharts using R. Markdown-like text is used to describe a diagram and, by doing this in R, we can also add some R code into the mix and integrate these diagrams in the R console, through R Markdown, and in shiny apps. Want a more visual intro? View a really sweet video by following the link below to Dailymotion (click/tap the image to undergo transport).
The package leverages the infrastructure provided by htmlwidgets to bridge R and both mermaid.js and viz.js.
Install the development version of DiagrammeR from GitHub using the devtools package.
devtools::install_github('rich-iannone/DiagrammeR')It's possible to make diagrams using the Graphviz support included in the DiagrammeR package. The processing function is called grViz. What you pass into grViz is a valid graph in the DOT language. The text can either exist in the form of a string, a reference to a Graphviz file (with a .gv file extension), or as a text connection.
The Graphviz graph specification must begin with a directive stating whether a directed graph (digraph) or an undirected graph (graph) is desired. Semantically, this indicates whether or not there is a natural direction from one of the edge's nodes to the other. An optional graph ID follows this and paired curly braces denotes the body of the statement list (stmt_list).
Optionally, A graph may also be described as strict. This forbids the creation of multi-edges, i.e., there can be at most one edge with a given tail node and head node in the directed case. For undirected graphs, there can be at most one edge connected to the same two nodes. Subsequent edge statements using the same two nodes will identify the edge with the previously defined one and apply any attributes given in the edge statement.
Here is the basic structure:
[strict] (graph | digraph) [ID] '{' stmt_list '}'
The graph statement (graph_stmt), the node statement (node_stmt), and the edge statement (edge_stmt) are the three most commonly used statements in the Graphviz DOT language. Graph statements allow for attributes to be set for all components of the graph. Node statements define and provide attributes for graph nodes. Edge statements specify the edge operations between nodes and they supply attributes to the edges. For the edge operations, a directed graph must specify an edge using the edge operator -> while a undirected graph must use the -- operator.
Within these statements follow statement lists. Thus for a node statement, a list of nodes is expected. For an edge statement, a list of edge operations. Any of the list item can optionally have an attribute list (attr_list) which modify the attributes of either the node or edge.
Comments may be placed within the statement list. These can be marked using // or a /* */ structure. Comment lines are denoted by a # character. Multiple statements within a statement list can be separated by linebreaks or ; characters between multiple statements.
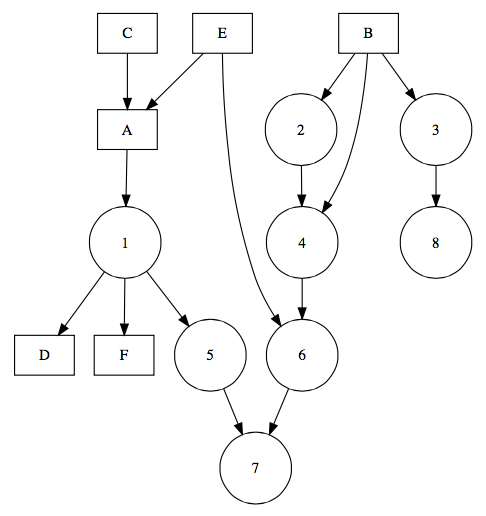
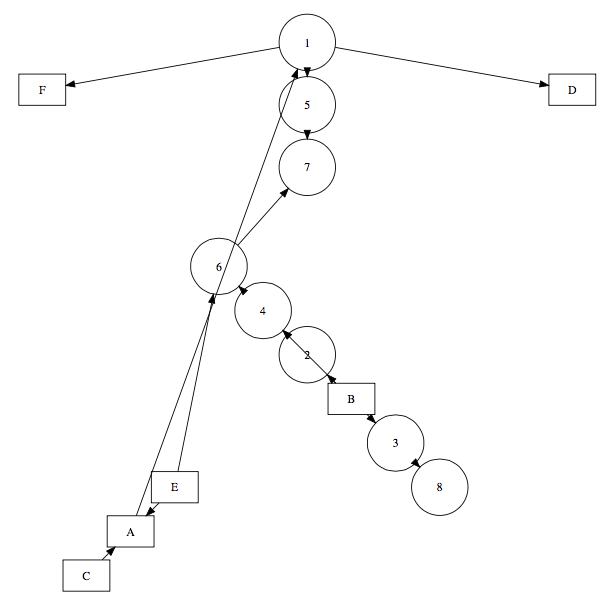
Here is an example where nodes (in this case styled as boxes and circles) can be easily defined along with their connections:
boxes_and_circles <- "
digraph boxes_and_circles {

  # several 'node' statements
  node [shape = box]
    A; B; C; D; E; F

  node [shape = circle,
        fixedsize = true,
        width = 0.9] // sets as circles
    1; 2; 3; 4; 5; 6; 7; 8

  # several 'edge' statements
    A->1; B->2; B->3; B->4; C->A
    1->D; E->A; 2->4; 1->5; 1->F
    E->6; 4->6; 5->7; 6->7; 3->8

  # a 'graph' statement
  graph [overlap = true, fontsize = 10]
}
"

grViz(boxes_and_circles)
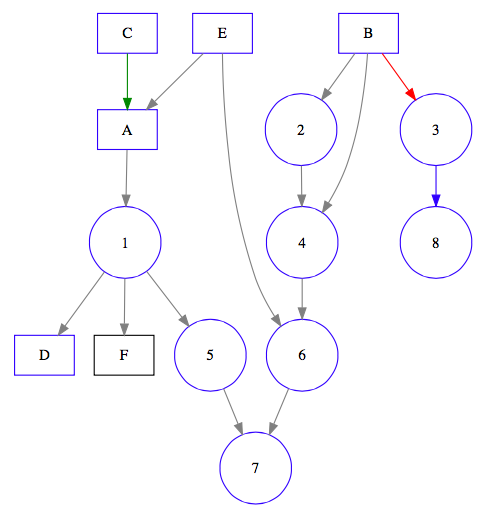
The attributes of the nodes and the edges can be easily modified. In the following, colors can be selectively changed in attribute lists.
boxes_and_circles <- "
digraph boxes_and_circles {

  # several 'node' statements
  node [shape = box,
        color = blue] // for the letter nodes, use box shapes
    A; B; C; D; E
    F [color = black]

  node [shape = circle,
        fixedsize = true,
        width = 0.9] // sets as circles
    1; 2; 3; 4; 5; 6; 7; 8

  # several 'edge' statements
  edge [color = gray] // this sets all edges to be gray (unless overridden)
    A->1; B->2
    B->3 [color = red]
    B->4
    C->A [color = green]
    1->D; E->A; 2->4; 1->5; 1->F
    E->6; 4->6; 5->7; 6->7
    3->8 [color = blue]

  # a 'graph' statement
  graph [overlap = true, fontsize = 10]
}
"

grViz(boxes_and_circles)
There are many more attributes. Here are the principal node attributes:
| Node Attribute | Description | Default |
|---|---|---|
color |
the node shape color | black |
colorscheme |
the scheme for interpreting color names | |
distortion |
node distortion for any shape = polygon |
0.0 |
fillcolor |
node fill color | lightgrey/black |
fixedsize |
label text has no affect on node size | false |
fontcolor |
the font color | black |
fontname |
the font family | Times-Roman |
fontsize |
the point size of the label | 14 |
group |
the name of the node's horizontal alignment group | |
height |
the minimum height in inches | 0.5 |
image |
the image file name | |
labelloc |
the node label vertical alignment | c |
margin |
the space around a label | 0.11, 0.55 |
orientation |
the node rotation angle | 0.0 |
penwidth |
the width of the pen (in point size) for drawing boundaries | 1.0 |
peripheries |
the number of node boundaries | |
shape |
the shape of the node | ellipse |
sides |
the number of sides for shape = polygon |
4 |
skew |
the skewing of the node for shape = polygon |
0.0 |
style |
graphics options for the node | |
tooltip |
the tooltip annotation for the node | [node label] |
width |
the minimum width in inches | 0.75 |
The edge attributes:
| Edge Attribute | Description | Default |
|---|---|---|
arrowhead |
style of arrowhead at head end | normal |
arrowsize |
scaling factor for arrowheads | 1.0 |
arrowtail |
sytle of arrowhead at tail end | normal |
color |
edge stroke color | black |
colorscheme |
the scheme for interpreting color names | |
constraint |
whether edge should affect node ranking | true |
decorate |
setting this draws line between labels with their edges | |
dir |
direction; either forward, back, both, or none |
forward |
edgeURL |
URL attached to non-label part of edge | |
edgehref |
same as edgeURL attribute |
|
edgetarget |
if an URL is set, this determines the browser window for URL | |
edgetooltip |
a tooltip annotation for the non-label part of edge | label |
fontcolor |
the font color | black |
fontname |
the font family | Times-Roman |
fontsize |
the point size of the label | 14 |
headclip |
if false, edge is not clipped to head node boundary | true |
headhref |
same as headURL |
|
headlabel |
label placed near head of edge | |
headport |
can be either: n, ne, e, se, s, sw, w, nw |
|
headtarget |
if headURL is set, determines the browser window for URL |
|
headtooltip |
a tooltip annotation near head of edge | label |
headURL |
URL attached to head label | |
href |
alias for URL | |
id |
any string (user-defined output object tags) | |
label |
edge label | |
labelangle |
angle in degrees which head or tail label is rotated off edge | -25.0 |
labeldistance |
scaling factor for distance of head or tail label from node | 1.0 |
labelfloat |
lessen constraints on edge label placement | false |
labelfontcolor |
typeface color for head and tail labels | black |
labelfontname |
font family for head and tail labels | Times-Roman |
labelfontsize |
point size for head and tail labels | 14 |
labelhref |
same as labelURL |
|
labelURL |
URL for label, overrides edgeURL |
|
labeltarget |
if URL or labelURL set, determines browser window for URL |
|
labeltooltip |
tooltip annotation near label | label |
layer |
all, id or id:id, or a comma-separated list |
overlay range |
lhead |
name of cluster to use as head of edge | |
ltail |
name of cluster to use as tail of edge | |
minlen |
minimum rank distance between head and tail | 1 |
penwidth |
width of pen for drawing edge stroke, in points | 1.0 |
samehead |
tag for head node; edge heads with the same tag are merged onto the same port | |
sametail |
tag for tail node; edge tails with the same tag are merged onto the same port | |
style |
graphics options | |
tailclip |
if false, edge is not clipped to tail node boundary | true |
tailhref |
same as tailURL |
|
taillabel |
label placed near tail of edge | |
tailport |
can be either: n, ne, e, se, s, sw, w, nw |
|
tailtarget |
if tailURL is set, determines browser window for URL |
|
tailtooltip |
tooltip annotation near tail of edge | label |
tailURL |
URL attached to tail label | |
target |
if URL is set, determines browser window for URL |
|
tooltip |
tooltip annotation | label |
weight |
integer cost of stretching an edge | 1 |
The graph attributes:
| Graph Attribute | Description | Default |
|---|---|---|
aspect |
controls aspect ratio adjustment | |
bgcolor |
background color for drawing and initial fill color | |
center |
center drawing | false |
clusterrank |
local but optionally global or none |
local |
color |
the color for clusters, outline color, and fill color | black |
colorscheme |
the scheme for interpreting color names | |
compound |
allow edges between clusters | false |
concentrate |
enables edge concentrators | false |
dpi |
dpi for image output | 96 |
fillcolor |
cluster fill color | black |
fontcolor |
typeface color | black |
fontname |
font family | Times-Roman |
fontpath |
list of directories to search for paths | |
fontsize |
point size of label | 14 |
id |
any string (user-defined output object tags) | |
label |
any string | |
labeljust |
label justification; l or r for left or right |
centered |
labelloc |
label location; t or b for top or bottom |
top |
landscape |
graph orientation; true for landscape |
|
layers |
id:id:id... | |
layersep |
specifies separator character to split layers |
: |
margin |
margin (in inches) included in page |
0.5 |
mindist |
minimum separation (in inches) between all nodes | 1.0 |
nodesep |
separation (in inches) between nodes | 0.25 |
nojustify |
justify to label if set as true | false |
ordering |
if out edge order is preserved |
|
orientation |
if rotate is not used and the value is landscape, then landscape |
portrait |
outputorder |
or nodesfirst, edgesfirst |
breadthfirst |
page |
unit of pagination (e.g., "8.5,11") |
|
pagedir |
traversal order of pages | BL |
pencolor |
color for drawing cluster boundaries | black |
penwidth |
width of pen, in points, for drawing boundaries | 1.0 |
peripheries |
number of cluster boundaries | 1 |
rank |
choices are: same, min, max, source or sink |
|
rankdir |
choices are: LR (left to right) or TB (top to bottom) |
TB |
ranksep |
separation between ranks, in inches | 0.75 |
ratio |
approximate aspect ratio desired: fill or auto |
|
rotate |
if set to 90, set orientation to landscape |
|
samplepoints |
number of points used to represent ellipses and circles on output | 8 |
searchsize |
maximum edges with negative cut values to check when looking for a minimum one during network simplex | 30 |
size |
maximum drawing size, in inches | |
splines |
draw edges as splines, polylines, lines | |
style |
graphics options for clusters (e.g., filled) |
|
stylesheet |
pathname or URL to XML style sheet for SVG | |
target |
if URL is set, determines browser window for URL |
|
tooltip |
tooltip annotation for cluster | label |
truecolor |
if set, force 24-bit or indexed color in image output | |
URL |
URL associated with graph (format-dependent) | |
viewport |
clipping window on output |
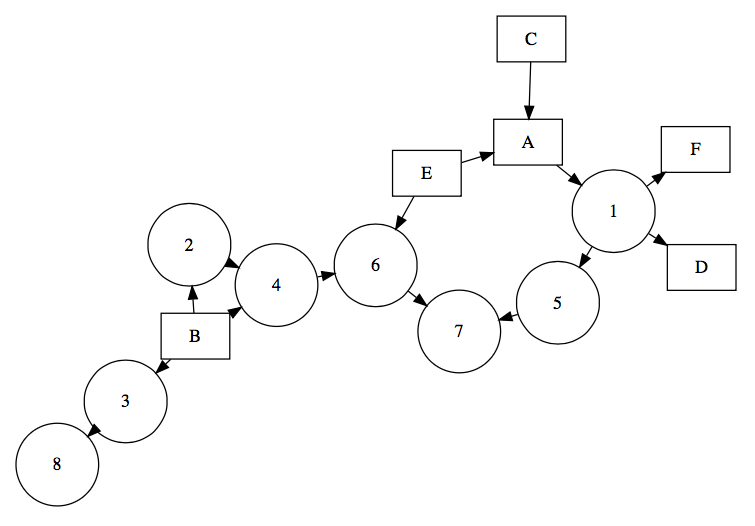
Several Graphviz engines are available with DiagrammeR for rendering graphs. By default, the grViz function renders graphs using the standard dot engine. However, the neato, twopi, and circo engines are selectable by supplying those names to the engine argument. The neato engine provides spring model layouts. This is a suitable engine if the graph is not too large (<100 nodes) and you don't know anything else about it. The neato engine attempts to minimize a global energy function, which is equivalent to statistical multi-dimensional scaling. The twopi engine provides radial layouts. Nodes are placed on concentric circles depending their distance from a given root node. The circo engine provide circular layouts. This is suitable for certain diagrams of multiple cyclic structures, such as certain telecommunications networks.
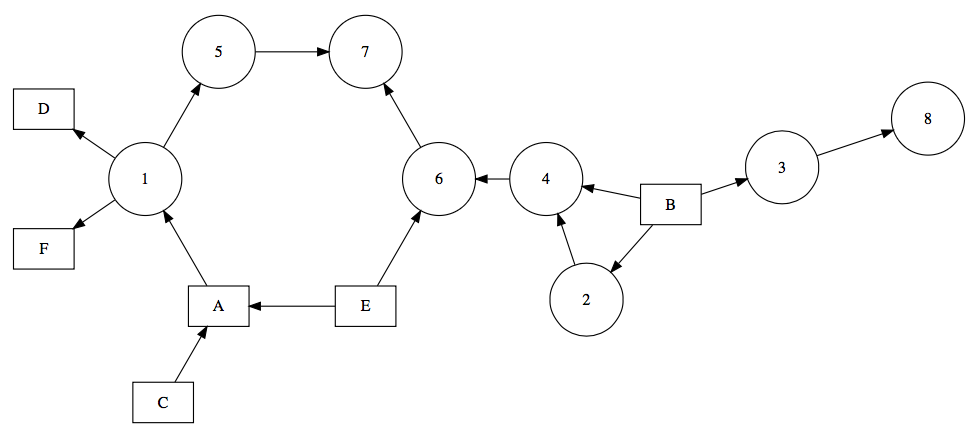
Here is how the 'boxes_and_circles' graph is rendered with the neato engine:
grViz(boxes_and_circles, engine = "neato")grViz(boxes_and_circles, engine = "twopi")grViz(boxes_and_circles, engine = "circo")Possibilities are interesting when combining R functions with DiagrammeR and the grViz function. Here's an example of how the rvest package and piping with pipeR can yield multiple graphs:
library(rvest)
library(XML)
library(pipeR)

# Generate all the examples from viz.js GitHub repo
html("https://raw.githubusercontent.com/mdaines/viz.js/gh-pages/example.html") %>>%
  html_nodes("script[type='text/vnd.graphviz']") %>>%
  lapply(
    function(x){
      xmlValue(x) %>>% (~ htmltools::html_print(grViz(.)) ) %>>% grViz
    }
  )
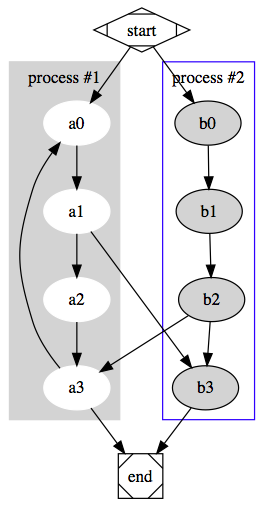
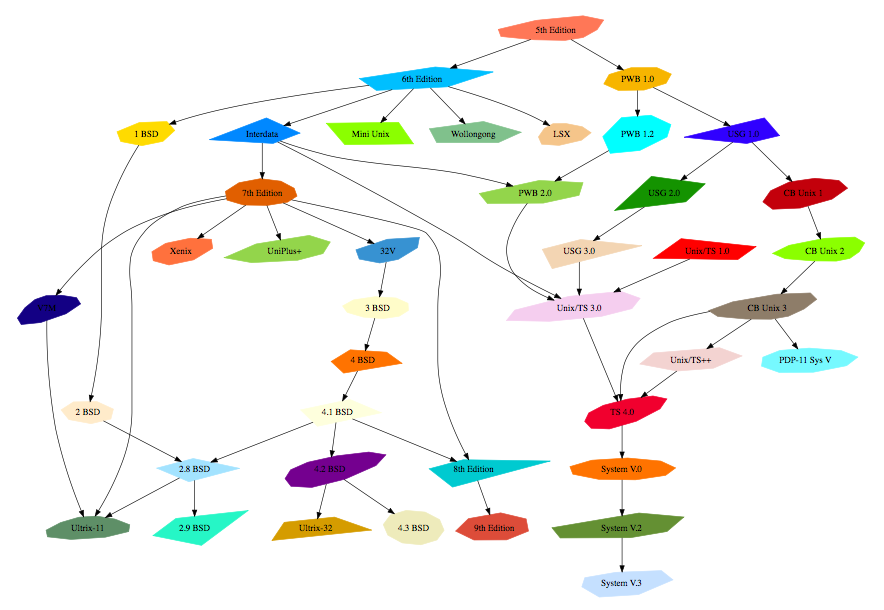
Isn't this great? Let's take in some examples straight from the Graphviz gallery:
readLines("http://www.graphviz.org/Gallery/directed/fsm.gv.txt") %>>%
  grViz

readLines("http://www.graphviz.org/Gallery/directed/Genetic_Programming.gv.txt") %>>%
  grViz

readLines("http://www.graphviz.org/Gallery/directed/unix.gv.txt") %>>%
  grViz
You get some nice figures as a result. Try 'em, you'll see.
For much more information on the DOT language, see the excellent drawing graphs with dot manual.
The mermaid function processes the specification of a diagram and then renders the diagram. This diagram spec can either exist in the form of a string, a reference to a mermaid file (with a .mmd file extension), or as a connection.
The mermaid-style graph specification begins with a declaration of graph followed by the graph direction. The directions can be:
LRleft to rightRLright to leftTBtop to bottomBTbottom to topTDtop down (same asTB)
Nodes can be given arbitrary ID values and those IDs are displayed as text within their respective boxes. Connections between nodes are denoted by:
-->arrow connection---line connection
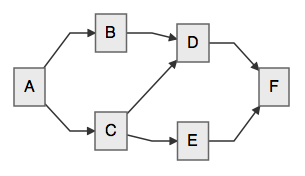
Simply joining up a series of nodes in a left-to-right graph can be done in a few lines:
diagram <- "
graph LR
  A-->B
  A-->C
  C-->E
  B-->D
  C-->D
  D-->F
  E-->F
"

mermaid(diagram)
This renders the following image:
The same result can be achieved in a more succinct manner with this R statement (using semicolons between statements in the mermaid diagram spec):
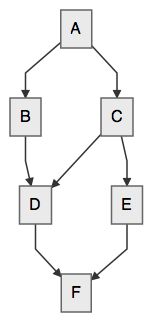
mermaid("graph LR; A-->B; A-->C; C-->E; B-->D; C-->D; D-->F; E-->F")Alternatively, here is the result of using the statement graph TB in place of graph LR:
Keep in mind that external files can also be called by the mermaid function. The file graph.mmd can contain the text of the diagram spec as follows
graph LR
  A-->B
  A-->C
  C-->E
  B-->D
  C-->D
  D-->F
  E-->F
and be rendered through:
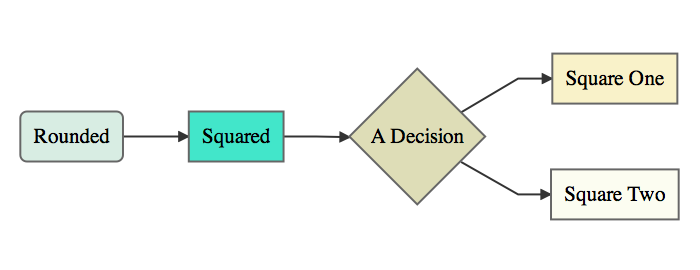
mermaid("graph.mmd")Alright, here's another example. This one places some text inside the diagram objects. Also, there are some CSS styles to add a color fill to each of the diagram objects:
diagram <- "
graph LR
A(Rounded)-->B[Squared]
B-->C{A Decision}
C-->D[Square One]
C-->E[Square Two]

style A fill:#DCEBE3
style B fill:#77DFC9
style C fill:#DEDBBA
style D fill:#F8F0CC
style E fill:#FCFCF2
"

mermaid(diagram)
What you get is this:
Here's an example with line text (that is, text appearing on connecting lines). Simply place text between pipe characters, just after the arrow, right before the node identifier. There are few more CSS properties for the boxes included in this example (stroke, stroke-width, and stroke-dasharray).
diagram <- "
graph LR
A(Start)-->|Line Text|B(Keep Going)
B-->|More Line Text|C(Stop)

style A fill:#A2EB86, stroke:#04C4AB, stroke-width:2px
style B fill:#FFF289, stroke:#FCFCFF, stroke-width:2px, stroke-dasharray: 4, 4
style C fill:#FFA070, stroke:#FF5E5E, stroke-width:2px
"

mermaid(diagram)
The resultant graphic:
Let's include the values of some R objects into a fresh diagram. The mtcars dataset is something I go to again and again, so, I'm going to load it up.
data(mtcars)When you call the R summary function on this data frame, you obtain this:
     mpg             cyl             disp             hp             drat
 Min.   :10.40   Min.   :4.000   Min.   : 71.1   Min.   : 52.0   Min.   :2.760
 1st Qu.:15.43   1st Qu.:4.000   1st Qu.:120.8   1st Qu.: 96.5   1st Qu.:3.080
 Median :19.20   Median :6.000   Median :196.3   Median :123.0   Median :3.695
 Mean   :20.09   Mean   :6.188   Mean   :230.7   Mean   :146.7   Mean   :3.597
 3rd Qu.:22.80   3rd Qu.:8.000   3rd Qu.:326.0   3rd Qu.:180.0   3rd Qu.:3.920
 Max.   :33.90   Max.   :8.000   Max.   :472.0   Max.   :335.0   Max.   :4.930
       wt             qsec             vs               am              gear
 Min.   :1.513   Min.   :14.50   Min.   :0.0000   Min.   :0.0000   Min.   :3.000
 1st Qu.:2.581   1st Qu.:16.89   1st Qu.:0.0000   1st Qu.:0.0000   1st Qu.:3.000
 Median :3.325   Median :17.71   Median :0.0000   Median :0.0000   Median :4.000
 Mean   :3.217   Mean   :17.85   Mean   :0.4375   Mean   :0.4062   Mean   :3.688
 3rd Qu.:3.610   3rd Qu.:18.90   3rd Qu.:1.0000   3rd Qu.:1.0000   3rd Qu.:4.000
 Max.   :5.424   Max.   :22.90   Max.   :1.0000   Max.   :1.0000   Max.   :5.000
      carb
 Min.   :1.000
 1st Qu.:2.000
 Median :2.000
 Mean   :2.812
 3rd Qu.:4.000
 Max.   :8.000
That information can placed into a diagram. First, we'll get a vector object for strings that specify each of the connections and the text inside the boxes (one for each mtcars dataset column). These strings will contain each of the statistics provided by the summary function (minimum, 1st quartile, median, mean, 3rd quartile, and maximum). We'll use a sapply to loop through each column.
connections <- sapply(
  1:ncol(mtcars)
  , function(i){
    paste0(
      i
      , "(", colnames(mtcars)[i], ")---"
      , i, "-stats("
      , paste0(
        names(summary(mtcars[,i]))
        , ": "
        , unname(summary(mtcars[,i]))
        , collapse="<br/>"
      )
      , ")"
    )
  }
)
This generates all of the syntax required for connections between column names to the statistical summary text in each of the adjoining boxes. Notice the use of the <br/> tag that terminates each of the stats inside the paste0 statement. They provide the necessary linebreaks for text within each diagram object.
Now, to generate the code for the summary diagram, one can use a paste0 statement and then a separate paste statement for the connection text (with the collapse argument set to \n to specify a linebreak for the output text). Note that within the paste0 statement, there is a \n linebreak wherever you would need one. Finally, to style multiple objects, a classDef statement was used. Here, a class of type column was provided with values for certain CSS properties. On the final line, the class statement applied the class definition to nodes 1 through 11 (a comma-separated list generated by the paste0 statement).
diagram <-
paste0(
"graph TD;", "\n",
paste(connections, collapse = "\n"), "\n",
"classDef column fill:#0001CC, stroke:#0D3FF3, stroke-width:1px;" ,"\n",
"class ", paste0(1:length(connections), collapse = ","), " column;
")

mermaid(diagram)
This is part of the resulting graphic (it's quite wide so I'm displaying just 8 of the 11 columns):
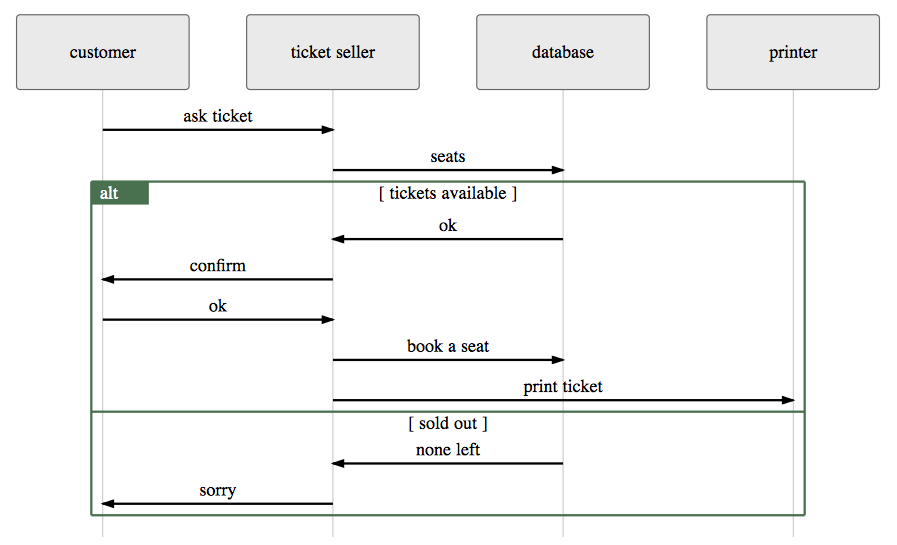
The mermaid.js library also supports sequence diagrams. The "How to Draw Sequence Diagrams" report by Poranen, Makinen, and Nummenmaa offers a good introduction to sequence diagrams. Let's replicate the ticket-buying example from Figure 1 of this report and add in some conditionals.
# Using this "How to Draw a Sequence Diagram"
# http://www.cs.uku.fi/research/publications/reports/A-2003-1/page91.pdf
# draw some sequence diagrams with DiagrammeR

mermaid("
sequenceDiagram
  customer->>ticket seller: ask ticket
  ticket seller->>database: seats
  alt tickets available
    database->>ticket seller: ok
    ticket seller->>customer: confirm
    customer->>ticket seller: ok
    ticket seller->>database: book a seat
    ticket seller->>printer: print ticket
  else sold out
    database->>ticket seller: none left
    ticket seller->>customer: sorry
  end
")
For more examples and additional documentation, see the mermaid.js Wiki.
As with other htmlwidgets, we can easily dynamically bind DiagrammeR in R with shiny. Here is a quick example where we can provide a diagram spec in a textInput.
library(shiny)

ui = shinyUI(fluidPage(
  textInput('spec', 'Diagram Spec', value = ""),
  DiagrammeROutput('diagram')
))

server = function(input, output){
  output$diagram <- renderDiagrammeR(DiagrammeR(
    input$spec
  ))
}

shinyApp(ui = ui, server = server)

