A Leaflet plugin that allows to add elevation profiles using d3js
For a working example see one of the following demos:
- loading .gpx file
- loading .geojson file
- loading string data
- hoverable chart / hidden map
- hoverable chart / hidden chart
- hoverable .gpx tracks
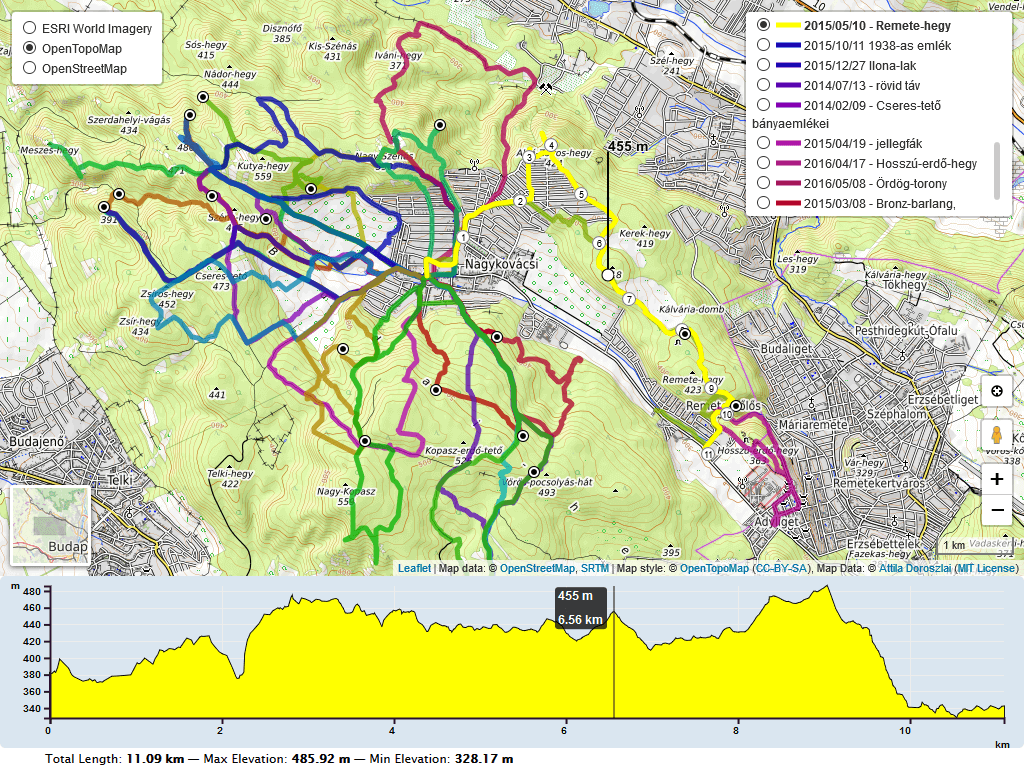
- toggable .gpx tracks
- toggable .gpx charts
- custom-theme colors
- close button
- follow marker location
Initially based on the work of Felix “MrMufflon” Bache
- include CSS & JavaScript
<head>
...
<style> html, body, #map, #elevation-div { height: 100%; width: 100%; padding: 0; margin: 0; } #map { height: 75%; } #elevation-div {	height: 25%; font: 12px/1.5 "Helvetica Neue", Arial, Helvetica, sans-serif; } </style>
<!-- Leaflet (JS/CSS) -->
<link rel="stylesheet" href="https://unpkg.com/leaflet@1.3.2/dist/leaflet.css" />
<script src="https://unpkg.com/leaflet@1.3.2/dist/leaflet.js"></script>
<!-- D3.js -->
<script src="https://unpkg.com/d3@4.13.0/build/d3.min.js" charset="utf-8"></script>
<!-- leaflet-gpx -->
<script src="https://cdnjs.cloudflare.com/ajax/libs/leaflet-gpx/1.4.0/gpx.js"></script>
<!-- leaflet-elevation -->
<link rel="stylesheet" href="https://unpkg.com/@raruto/leaflet-elevation@latest/leaflet-elevation.css" />
<script src="https://unpkg.com/@raruto/leaflet-elevation@latest/leaflet-elevation.js"></script>
...
</head>
- choose the div containers used for the slippy map
<body>
...
<div id="map"></div>
<div id="elevation-div"></div>
...
</body>
- create your first simple “leaflet-elevation” slippy map
<script> var opts = { map: { center: [41.4583, 12.7059], zoom: 5, markerZoomAnimation: false, zoomControl: false, }, zoomControl: { position: 'topleft', }, otmLayer: { url: 'https://{s}.tile.opentopomap.org/{z}/{x}/{y}.png', options: { attribution: 'Map data: © <a href="http://www.openstreetmap.org/copyright">OpenStreetMap</a>, <a href="http://viewfinderpanoramas.org">SRTM</a> | Map style: © <a href="https://opentopomap.org">OpenTopoMap</a> (<a href="https://creativecommons.org/licenses/by-sa/3.0/">CC-BY-SA</a>)', /*subdomains:"1234"*/ }, }, elevationControl: { data: "https://raruto.github.io/examples/leaflet-elevation/via-emilia.gpx", options: { position: "topleft", theme: "magenta-theme", //default: lime-theme useHeightIndicator: true, //if false a marker is drawn at map position collapsed: false, //collapsed mode, show chart on click or mouseover detachedView: true, //if false the chart is drawn within map container elevationDiv: "#elevation-div", // if (detached), the elevation chart container }, }, layersControl: { options: { collapsed: false, }, }, }; var map = new L.Map('map', opts.map); var baseLayers = {}; baseLayers.OTM = new L.TileLayer(opts.otmLayer.url, opts.otmLayer.options); var controlZoom = new L.Control.Zoom(opts.zoomControl); var controlElevation = L.control.elevation(opts.elevationControl.options); var controlLayer = L.control.layers(baseLayers, null, opts.layersControl.options); controlZoom.addTo(map); controlLayer.addTo(map); controlElevation.addTo(map); // attach elevation chart to map controlElevation.loadData(opts.elevationControl.data); // url or plain gpx/geojson data map.addLayer(baseLayers.OTM); </script>
Related: QGIS Integration
Compatibile with: leaflet@1.3.2, leaflet-gpx@1.4.0, d3js@4.13
Contributors: MrMufflon, HostedDinner, ADoroszlai, Raruto