R/Bioconductor script for hierachical clustering by various DNA sequence features and measuring its similarity with reference clustering.
-
Install the latest stable version of R (3.3.0) from CRAN.
-
Run the latest R and install packages
Rcpp,inline,fastclusterandggtreeusing Bioconductor installer.source("https://bioconductor.org/biocLite.R") biocLite(c("Rcpp", "inline", "fastcluster", "ggtree"))
-
Download the script
feature_select.Rfrom GitHub into current working folder and load it into R.source("feature_select.R") -
Use functions
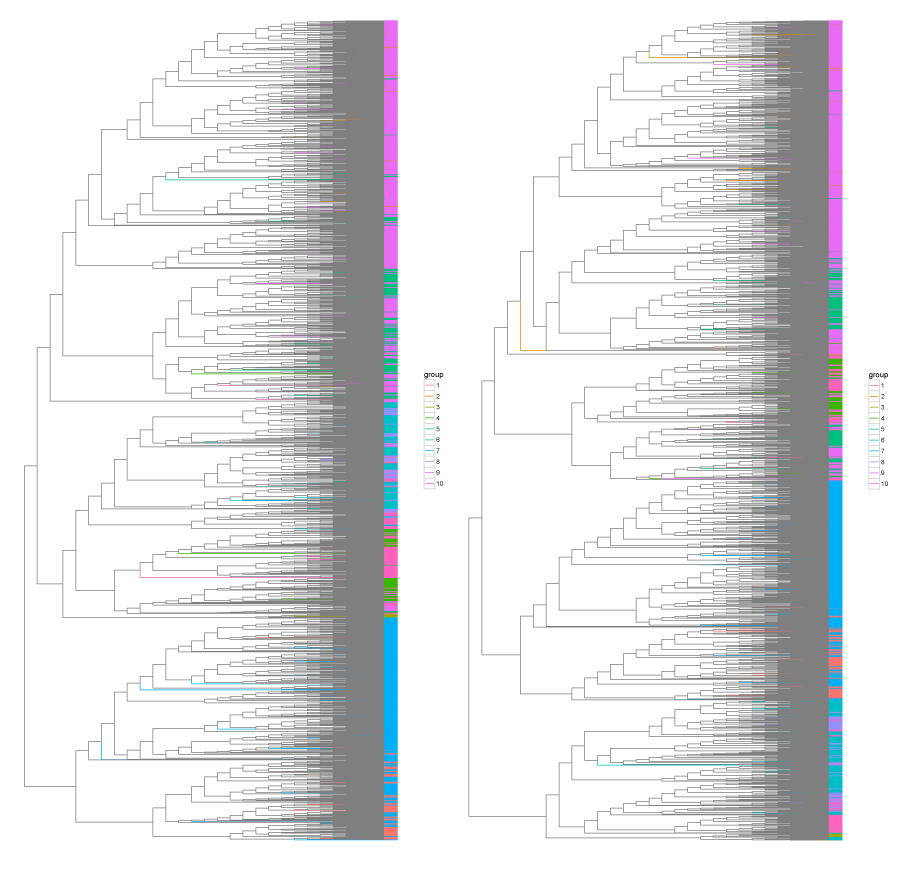
load_features,eval_all_feature_comb,find_best_featuresandplot_treeto run the analysis and visualize the results. The most time consuming functioneval_all_feature_combcan be run in parallel mode (setparalleloption toTRUE). See the following example:features <- load_features("features.csv") res <- eval_all_feature_comb(features, min_features = 2, max_features = 6, parallel = TRUE) best_euc <- find_best_features(res, 'euc') # for euclidean distance best_cos <- find_best_features(res, 'cos') # for cosine dissimilarity plot_tree(best_euc$tree, features$Organism, "tree_euc.pdf") plot_tree(best_cos$tree, features$Organism, "tree_cos.pdf")
-
Feel free to inspect the structure of
best_eucandbest_cosvariables. It is just a list of three items:featurescontains a vector of used features,kis a cutoff value (number of clusters) of the hierarchical clustering tree, that gave the best Variantion of Information (VI) with reference clustering andvicontains the best VI value. -
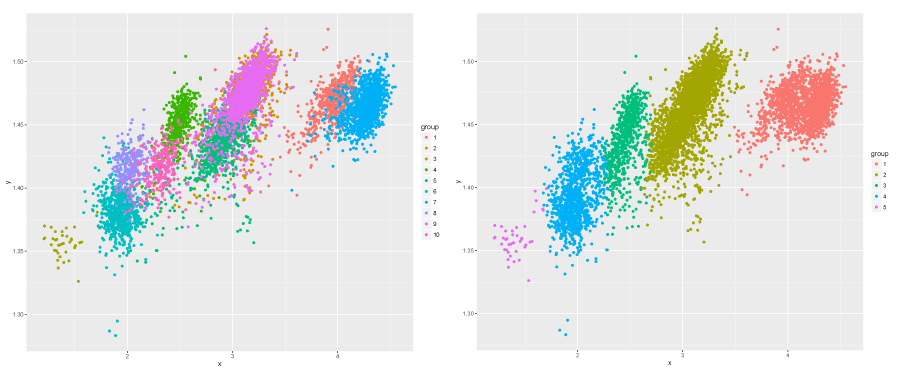
You can also plot a 2D projection of the clustering for comparison with reference:
ref_cls <- features$Organism
plot_clustering_2d(features$HP1_aktivita, features$HP2_mobilita, ref_cls, "2d_ref.pdf")
best_cls <- cutree(best_euc$tree, best_euc$k)
plot_clustering_2d(features$HP1_aktivita, features$HP2_mobilita, best_cls, "2d_euc.pdf")