This repository contains the Final Project for Deree course "Investments & Portfolio Management".
Authors:
- Dimitrios Georgiou
- Angelos Pappas
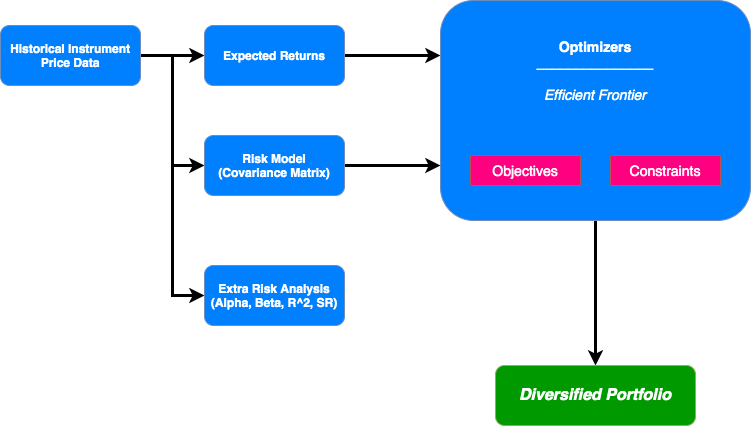
Agora is a system that implements Markowitz Portfolio Optimization method (classical mean-variance technique). Harry Markowitz's 1952 paper is the undeniable classic, which turned portfolio optimization from an art into a science. The key insight is that by combining assets with different expected returns and volatilities, one can decide on a mathematically optimal allocation which minimises the risk for a target return – the set of all such optimal portfolios is referred to as the efficient frontier.
It is extensible, and can be useful for a casual investor giving initial insights through as a serious Financial Instrument Analysis or Portfolio Management. The software relies on Yahoo Finance! to download the most recent trends in asset performance.
Head over to the report to get an in-depth look at the project.
Commands are given via the terminal.
Usage :
$ ./agora.py COMMAND

Available Commands:
1   - `tickers` [letter]
2   - `ticker-data` [ticker] [start_date] [end_date]
3.1 - `ticker-statistics`[ticker1] ... [tickerN] [start_date] [end_date]
3.2 - `tickers-statistics`[ticker] [start_date] [end_date]
4.1 - `ticker-risk-analysis`[ticker] [start_date] [end_date]
4.2 - `tickers-risk-analysis`[ticker1] ... [tickerN] [start_date] [end_date]
5.1 - `portfolio-construction` [N] [ticker1] ... [tickerN] [start_date] [end_date]
5.2 - `portfolio-optimization` [P] [N] [ticker1] ... [tickerN] [start_date] [end_date]
6   - `help`

Explanation:
1   - Get all tickers list that starts with <letter>
2.  - Get all historical data for <ticker> from <start_date> to <end_date>
3.1 - Get all historical data & descriptive statistics for <ticker> from <start_date> to <end_date>
3.2 - Get all historical data & descriptive statistics for <ticker1>, ... <tickerN> from <start_date> to <end_date>
4.1 - Get all historical data & descriptive  & risk-analysis statistics for <ticker> from <start_date> to <end_date>
4.2 - Get all historical data & descriptive  & risk-analysis statistics for <ticker1>, ... <tickerN> from <start_date> to <end_date>
5.1 - Construct a portfolio with <N> instruments <ticker1>, ... <tickerN> from <start_date> to <end_date>
5.2 - Optimize a portfolio with <N> instruments <ticker1>, ... <tickerN> from <start_date> to <end_date> through the Simulation of <P> portfolios
6   - Prints all available commands to the user
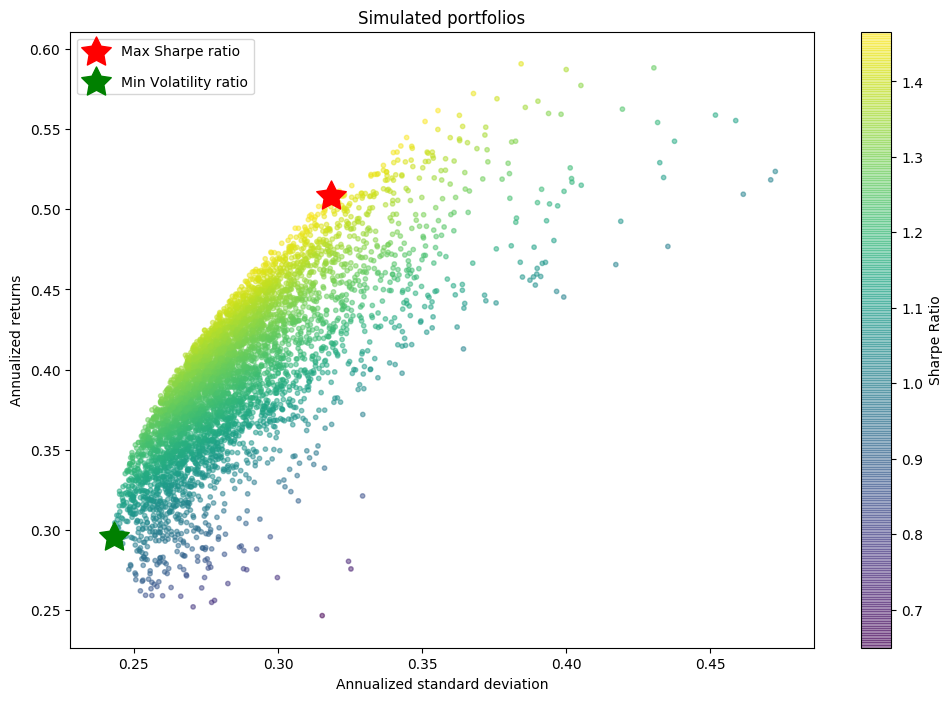
Here is an example on real life bond, stock & commodities data, demonstrating how easy it is to find the 2 efficient portfolios:
- One that Maximises the Sharpe ratio (a measure of risk-adjusted returns).
- One that Minimizes the volatility
./agora.py portfolio-optimization 5000 5 AAPL MSFT NVDA VRTX BTC-USD 01/01/2015 23/04/2020This outputs the following:
+---------+--------------------------+-----------------------------+
|         |   Expected Annual Return |   Annual Standard Deviation |
|---------+--------------------------+-----------------------------|
| AAPL    |                  23.1442 |                    0.285451 |
| MSFT    |                  30.419  |                    0.275795 |
| NVDA    |                  61.2178 |                    0.460714 |
| VRTX    |                  21.9815 |                    0.385221 |
| BTC-USD |                  61.5178 |                    0.63088  |
+---------+--------------------------+-----------------------------+
+--------------------------------------------------------------+
|           * Max Sharpe Ratio optimized Portfolio *           |
|  Portfolio Annual Return (252 days)  = 50.839 %              |
|  Portfolio Annual Standard Deviation  (252 days)  = 0.319    |
|  Portfolio Annual Sharpe Ratio  (252 days)  = 1.466          |
+--------------------------------------------------------------+
+-------------------------------------------------------------+
|       * Min Standard Deviation optimized Portfolio *        |
|  Portfolio Annual Return (252 days)  = 29.543 %             |
|  Portfolio Annual Standard Deviation  (252 days)  = 0.243   |
|  Portfolio Annual Sharpe Ratio  (252 days)  = 1.044         |
+-------------------------------------------------------------+
+---------+-----------------------------+----------------------------+
|         |   Max SR Allocation Weights |   Min σ Allocation Weights |
|---------+-----------------------------+----------------------------|
| AAPL    |                     4.2967  |                   39.136   |
| MSFT    |                    22.5286  |                   32.4369  |
| NVDA    |                    43.9819  |                    1.12696 |
| VRTX    |                     4.78606 |                   17.3675  |
| BTC-USD |                    24.4067  |                    9.93264 |
+---------+-----------------------------+----------------------------+
/src/agora/agora.py        `Agora` main control used to execute commands
/src/agora/instrument.py   Instrument class that covers methods related to instruments
/src/agora/portfolio.py    Portfolio class that covers methods related to portfolios
/src/agora/utils.py        Every extra useful function in terms of (a) financial calculations (b) User Experience (UI)
- Instrument : An instrument is a financial Security e.g Apple
- Ticker : It is the symbol used in the stock market. APIs used this to retrieve data. eg. AAPl for Apple
- Portfolio : A pool of different instruments that may belong to the same asset class or not
- Asset Class : A grouping of investments that exhibit similar characteristics and are subject to the same laws eg. Stocks, Bonds, Commodities. AAPL belongs to the 'Stocks'
- Optimization : For this project is the resolving of the 'Asset Allocation' problem by finding the optimal weights for every one of 2 efficient portfolios
- Metrics
- Descriptive : Return (price change of an instrument from day to day) & Risk (standard deviation of the changes)
- Risk Analysis : Implementation of CAPM (Capital Asset Pricing Model). Extra Risk metrics calculated against a market (Beta, Alpha, R^2). We chose S&P500 (stock market) as market instrument.
- Optimization Techniques
- Black Litterman Allocation as optimization technique
- Hierarchical Risk Parity
- Machine Learning Techniques
- Macroeconomic & Microeconomic Analysis
- Principal Component Analysis (PCA) : Analyze and keep N most valuable features that caputre information about a financial instrument.
- Experimental Features : exponentially-weighted covariance matrices. Etc.