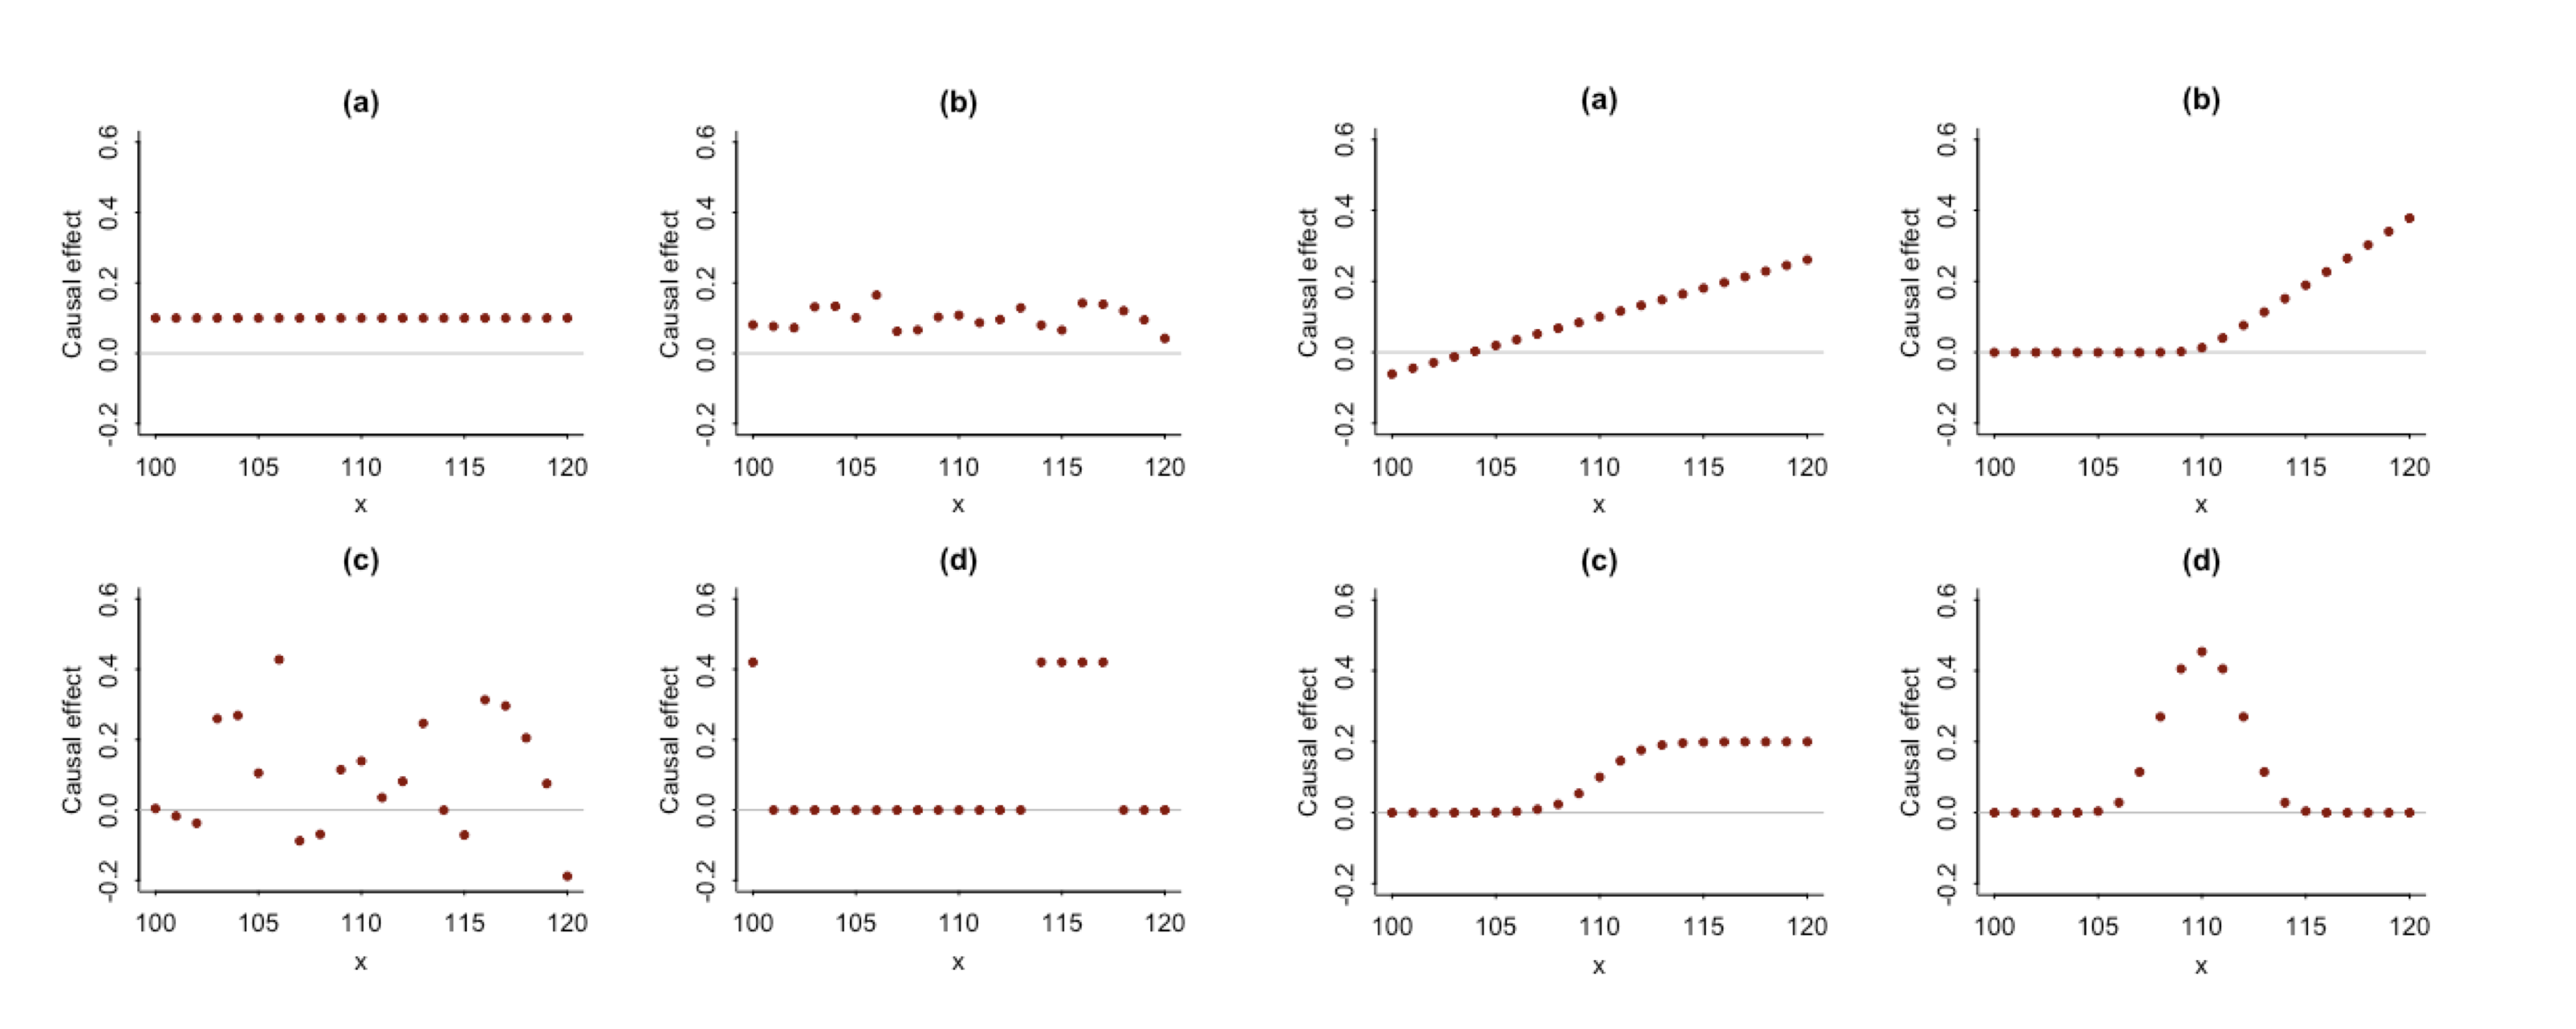
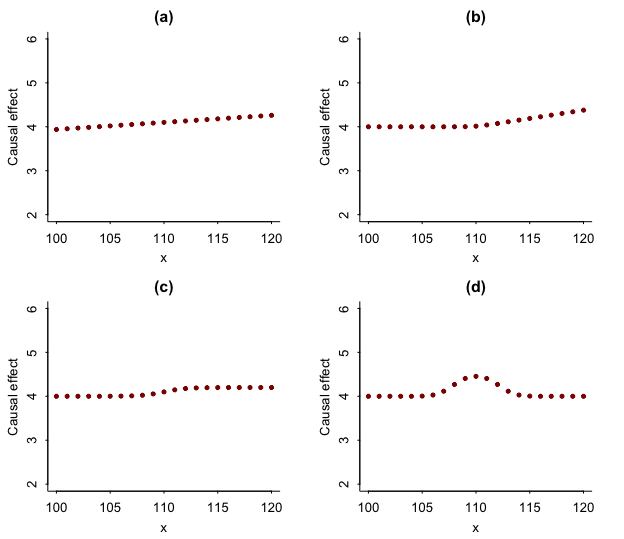
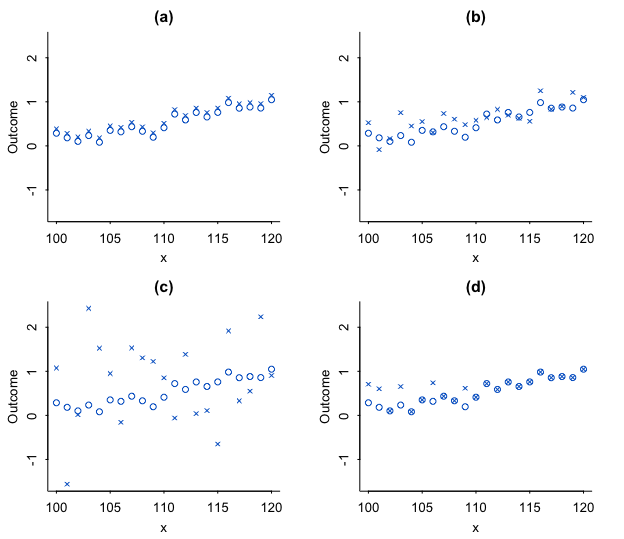
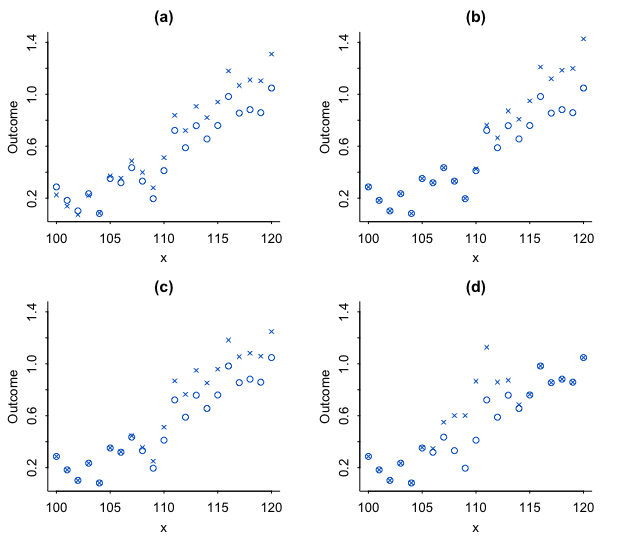
The average treatment effect can often be best understood in the context of its variation. Causal quartets depict the same average treatment effect under different patterns of heterogeneity. As with the famous correlation quartet of Anscombe (1973), causal quartets dramatize the way in which real-world variation can be more complex than simple numerical summaries.
To cite: Gelman, A., Hullman, J., & Kennedy, L. (2023). Causal quartets: Different ways to attain the same average treatment effect.
You can install the latest development version from GitHub with these R commands:
install.packages("devtools")
devtools::install_github("jhullman/causalQuartet")This document provides examples of how to use the package to create quartets of latent effects under random or systematic variation, or of observables consistent with latent effects. The minimim information reqired to generate a causal quartet is an average treatment effect and a set of x observations.
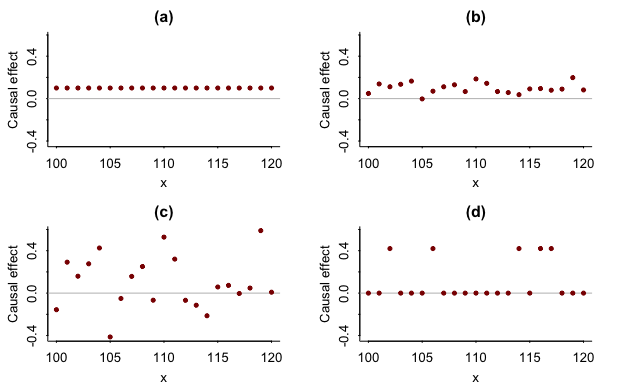
To generate a latent quartet depicting patterns of random variation for an average treatment effect, provide the estimate and a set of x observations representing individual units:
ate <- 0.1
x <- c(100:120)
r <- causal_quartet(ate,x)
r
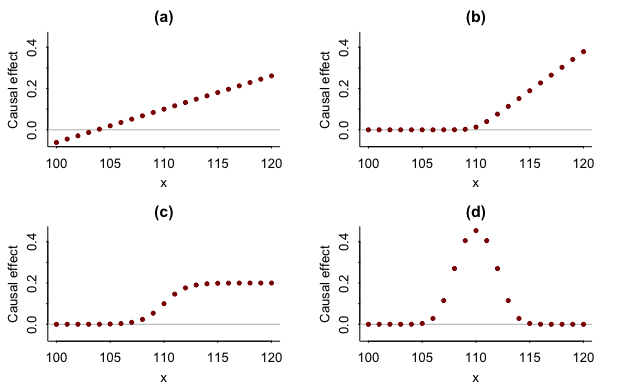
To generate a latent quartet depicting patterns of systematic variation:
s <- causal_quartet(ate,x,vartype="systematic")
s
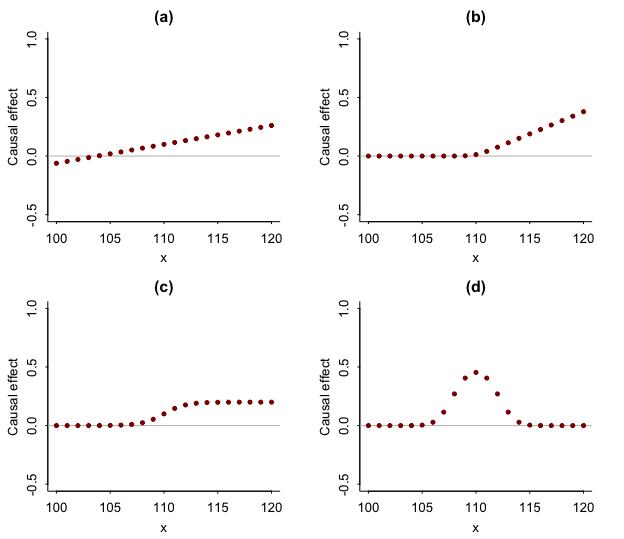
Customize the y-axis range:
s <- causal_quartet(ate,x,vartype="systematic",yrange=c(-0.5,1))
s
Change the baseline y value against which effects are compared from the default of 0 to another value:
s <- causal_quartet(ate,x,vartype="systematic",yoffset=4,yrange=c(2,6))
s
To generate a quartet of hypothetical observables depicting patterns of random variation, include a set of control observations along with the average treatment effect and x observations:
y <- seq(0,1,by=0.05)
y <- y + rnorm(length(y), sd=0.1)
ro <- causal_quartet(ate,x,y,obs=TRUE)
ro
To generate an observables quartet depicting patterns of systematic variation:
so <- causal_quartet(ate,x,y,vartype="systematic",obs=TRUE)
so
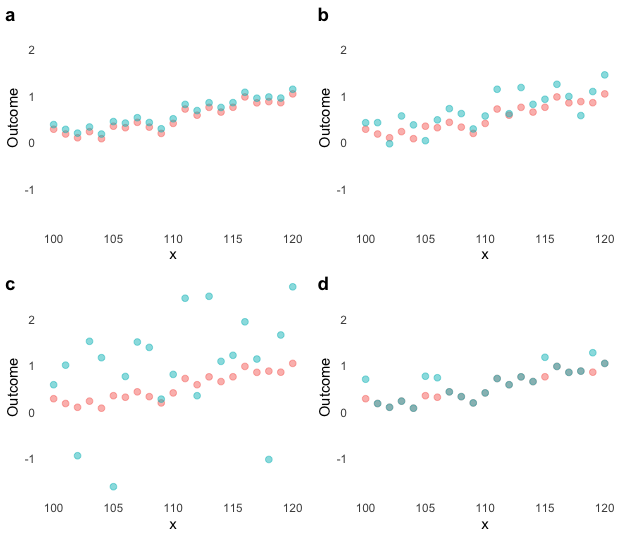
You can extract the data from a causal quartet object, for example, to plot the quartets using a preferred graphics package:
library(tidyverse)
ro <- causal_quartet(ate,x,y,obs=TRUE)
attach(ro)
cq <- as.tibble(data.frame(x, y, a, b, c, d))


#plot data using ggplot2 and cowplot
library(ggplot2)
library(cowplot)

cq <- rename(cq, control=y)
long_cq <- cq %>% gather(group, treatment, a:d)  %>% gather(cond, value, c("control", "treatment"))
yr <- attr(ro, "yrange")

pa <- long_cq %>% filter(group == "a") %>% ggplot(., aes(x = x, y = value, color = cond)) + geom_point(alpha = 0.5, size=2) + ylim(yr[1], yr[2]) + labs(y = "Outcome", color = "condition") + theme_classic() + theme(line = element_blank(), legend.position="none")
pb <- long_cq %>% filter(group == "b") %>% ggplot(., aes(x = x, y = value, color = cond)) + geom_point(alpha = 0.5, size=2) + ylim(yr[1], yr[2]) + labs(y = "Outcome", color = "condition") + theme_classic() + theme(line = element_blank(), legend.position="none")
pc <- long_cq %>% filter(group == "c") %>% ggplot(., aes(x = x, y = value, color = cond)) + geom_point(alpha = 0.5, size=2) + ylim(yr[1], yr[2]) + labs(y = "Outcome", color = "condition") + theme_classic() + theme(line = element_blank(), legend.position="none")
pd <- long_cq %>% filter(group == "d") %>% ggplot(., aes(x = x, y = value, color = cond)) + geom_point(alpha = 0.5, size=2) + ylim(yr[1], yr[2]) + labs(y = "Outcome", color = "condition") + theme_classic() + theme(line = element_blank(), legend.position="none")

plot_grid(pa, pb, pc, pd, labels = "auto")
