A Raspberry Pi Configuration for Internet connectivity
I have had a couple Pis doing random Internet-related duties for years. It's finally time to formalize their configs and make all the DNS/ad-blocking/monitoring stuff encapsulated into one Ansible project.
So that's what this is.
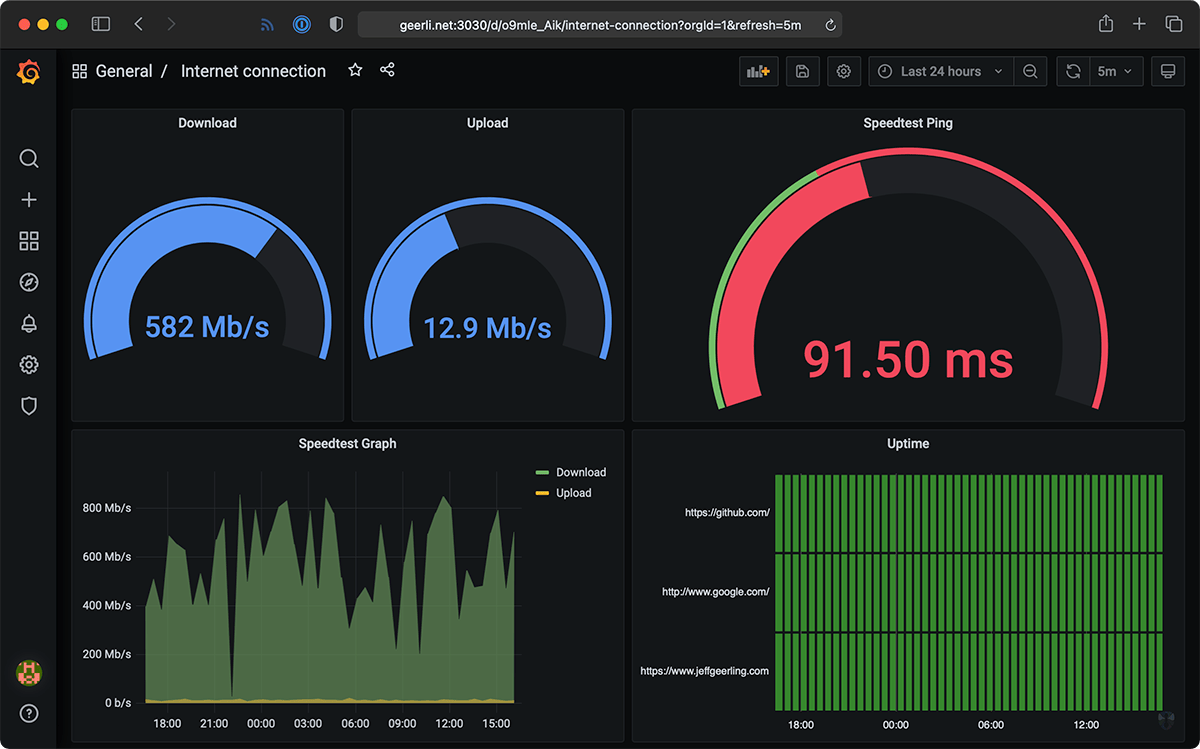
Internet Monitoring: Installs Prometheus and Grafana, along with a few Docker containers to monitor your Internet connection with Speedtest.net speedtests and HTTP tests so you can see uptime, ping stats, and speedtest results over time.
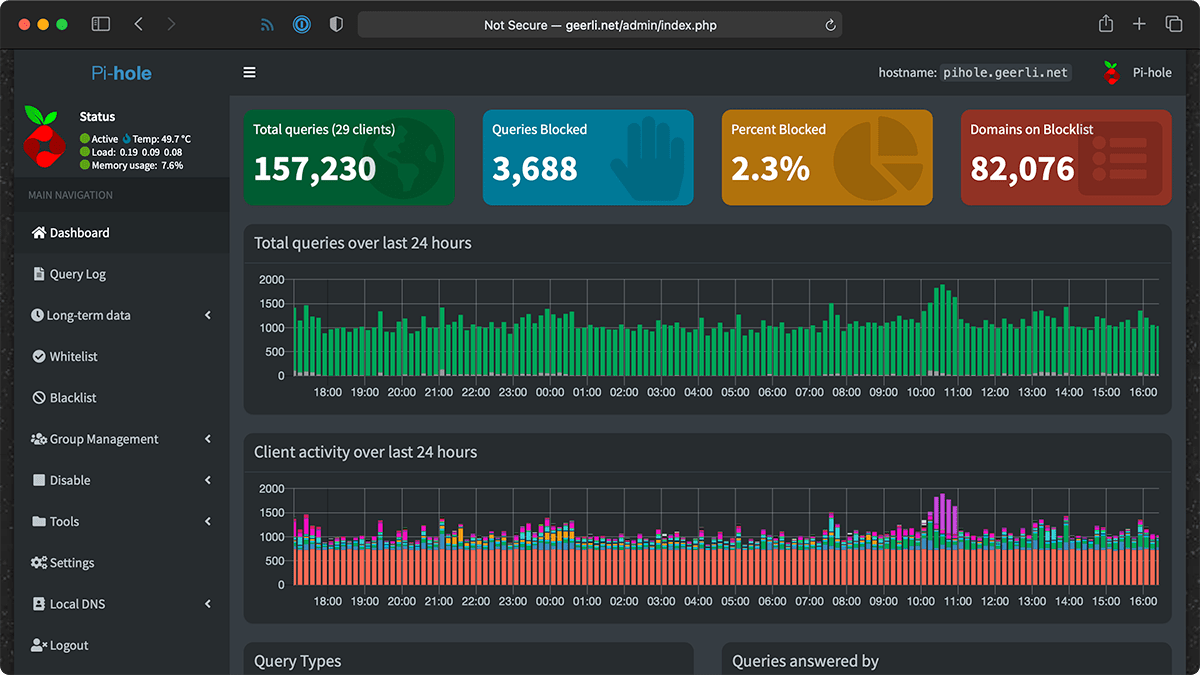
Pi-hole: Installs the Pi-hole Docker configuration so you can use Pi-hole for network-wide ad-blocking and local DNS. Make sure to update your network router config to direct all DNS queries through your Raspberry Pi if you want to use Pi-hole effectively!
Other features:
- Shelly Plug Monitoring: Installs a
shelly-plug-prometheusexporter and a Grafana dashboard, which tracks and displays power usage on a Shelly Plug running on the local network. (Disabled by default. Enable and configure using theshelly_plug_*vars inconfig.yml.) - AirGradient Monitoring: Configures
airgradient-prometheusand a Grafana dashboard, which tracks and displays air quality over time via one or more AirGradient DIY monitors. (Disabled by default. Enable and configure using theairgradient_enablevar inconfig.yml. See example configuration for ability to monitor multiple AirGradient DIY stations.) - Starlink Monitoring: Installs a
starlinkprometheus exporter and a Grafana dashboard, which tracks and displays Starlink statistics. (Disabled by default. Enable and configure using thestarlink_enablevar inconfig.yml.)
IMPORTANT NOTE: If you use the included Internet monitoring, it will download a decently-large amount of data through your Internet connection on a daily basis. Don't use it, or tune the internet-monitoring setup to not run the speedtests as often, if you have a metered connection!
You should use a Raspberry Pi 4 model B or better. The Pi 4 and later generations of Pi include a full gigabit network interface and enough I/O to reliably measure fast Internet connections.
Older Pis work, but have many limitations, like a slower CPU and sometimes very-slow NICs that limit the speed test capability to 100 Mbps or 300 Mbps on the Pi 3 model B+.
Other computers and VMs may run this configuration as well, but it is only regularly tested on a Raspberry Pi.
The configuration is tested against Raspberry Pi OS, both 64-bit and 32-bit, and runs great on that or a generic Debian installation.
It should also work with Ubuntu for Pi, or Arch Linux, but has not been tested on other operating systems.
- Install Ansible. The easiest way (especially on Pi or a Debian system) is via Pip:
- (If on Pi/Debian):
sudo apt-get install -y python3-pip - (Everywhere):
pip3 install ansible
- (If on Pi/Debian):
- Clone this repository:
git clone https://github.com/geerlingguy/internet-pi.git, then enter the repository directory:cd internet-pi. - Install requirements:
ansible-galaxy collection install -r requirements.yml(if you seeansible-galaxy: command not found, restart your SSH session or reboot the Pi and try again) - Make copies of the following files and customize them to your liking:
example.inventory.initoinventory.ini(replace IP address with your Pi's IP, or comment that line and uncomment theconnection=localline if you're running it on the Pi you're setting up).example.config.ymltoconfig.yml
- Run the playbook:
ansible-playbook main.yml
If running locally on the Pi: You may encounter an error like "Error while fetching server API version". If you do, please either reboot or log out and log back in, then run the playbook again.
Visit the Pi's IP address (e.g. http://192.168.1.10/) and use the pihole_password you configured in your config.yml file. An existing pi-hole installation can be left unaltered by disabling the setup of this proyect's installation in your config.yml (pihole_enable: false)
Visit the Pi's IP address with port 3030 (e.g. http://192.168.1.10:3030/), and log in with username admin and the password monitoring_grafana_admin_password you configured in your config.yml.
To find the dashboard, navigate to Dashboards, click Browse, then go to the Internet connection dashboard. If you star this dashboard, it will appear on the Grafana home page.
Note: The
monitoring_grafana_admin_passwordis only used the first time Grafana starts up; if you need to change it later, do it via Grafana's admin UI.
A number of default Prometheus job configurations are included out of the box, but if you would like to add more to the prometheus.yml file, you can add a block of text that will be added to the end of the scrape_configs using the prometheus_extra_scrape_configs variable, for example:
prometheus_extra_scrape_configs: |
  - job_name: 'customjob'
    scrape_interval: 5s
    static_configs:
      - targets: ['192.168.1.1:9100']
You can also add more targets to monitor via the node exporter dashboard, say if you have a number of servers or other Pis you want to monitor on this instance. Just add them to the list, after the nodeexp:9100 entry for the main Pi:
prometheus_node_exporter_targets:
  - 'nodeexp:9100'
  # Add more targets here
- 'another-server.local:9100'To upgrade Pi-hole to the latest version, run the following commands:
cd ~/pi-hole #
docker-compose pull             # pulls the latest images
docker-compose up -d --no-deps  # restarts containers with newer images
docker system prune --all # deletes unused imagesUpgrades for the other configurations are similar (go into the directory, and run the same docker-compose commands. Make sure to cd into the config_dir that you use in your config.yml file.
Alternatively, you may update the initial config.yml in the the repo folder and re-run the main playbook: ansible-playbook main.yml. At some point in the future, a dedicated upgrade playbook may be added, but for now, upgrades may be performed manually as shown above.
A guide for backing up the configurations and historical data will be posted here as part of Issue #194: Create Backup guide.
To remove internet-pi from your system, run the following commands (assuming the default install location of ~, your home directory):
# Enter the internet-monitoring directory.
cd ~/internet-monitoring

# Shut down internet-monitoring containers and delete data volumes.
docker-compose down -v

# Enter the pi-hole directory.
cd ~/pi-hole

# Shutdown pi-hole containers and delete data volumes.
docker-compose down -v

# Delete all the unused container images, volumes, etc. from the system.
docker system prune -f
Do the same thing for any of the other optional directories added by this project (e.g. shelly-plug-prometheus, starlink-exporter, etc.).
You can then delete the internet-monitoring, pi-hole, etc. folders and everything will be gone from your system.
MIT
This project was created in 2021 by Jeff Geerling.

