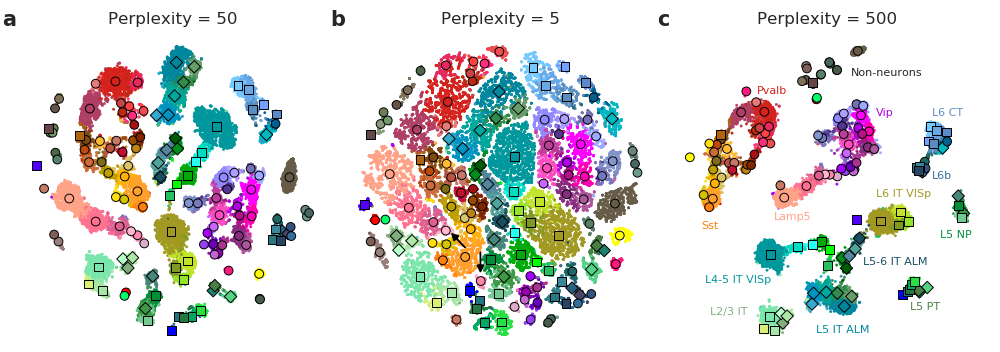
The art of using t-SNE for single-cell transcriptomics
This is a companion repository to our preprint https://www.biorxiv.org/content/early/2018/10/25/453449 (Kobak & Berens 2018, The art of using t-SNE for single-cell transcriptomics). All code is in Python Jupyter notebooks. We use this t-SNE implementation: https://github.com/KlugerLab/FIt-SNE.
See https://github.com/berenslab/rna-seq-tsne/blob/master/demo.ipynb for a step-by-step guide that we are using in the paper. It uses the Allen institute data (25000 cells sequenced with Smart-seq2) from http://celltypes.brain-map.org/rnaseq/mouse.
The other notebooks generate all figures that we have in the paper:
-
https://github.com/berenslab/rna-seq-tsne/blob/master/tasic-et-al.ipynb
Includes the analysis of the Allen dataset mentioned above, plus Tasic et al. 2016 and Cadwell et al. 2016.
-
https://github.com/berenslab/rna-seq-tsne/blob/master/umi-datasets.ipynb
Includes the analysis of Macosko et al. 2015, Shekhar et al. 2016, and Harris et al. 2018.
-
https://github.com/berenslab/rna-seq-tsne/blob/master/million-cells.ipynb
N = 1.3 mln dataset from 10x Genomics. To run this notebook one first needs to run
million-cells-server.py. One needs more than 32 Gb of RAM to process the this dataset, so this Python script was run separately on a powerful machine. It pickles all the results and then themillion-cells.ipynbnotebook uses that to make the figures.
For any technical questions, please start an Issue.
