
Python module for Barnes-Hut implementation of t-SNE (Cython).
This module is based on the excellent work of Laurens van der Maaten.
- Better results than the Scikit-Learn BH t-SNE implementation: bhtsne VS Scikit-Learn
- Fast (C++/Cython)
- Ability to set random seed
- Ability to set pre-defined plot coordinates (allow for smooth transitions between plots)
From pip:
pip install bhtsneReduce the four dimensional iris data set to two dimensions:
from bhtsne import tsne
from sklearn.datasets import load_iris
iris = load_iris()
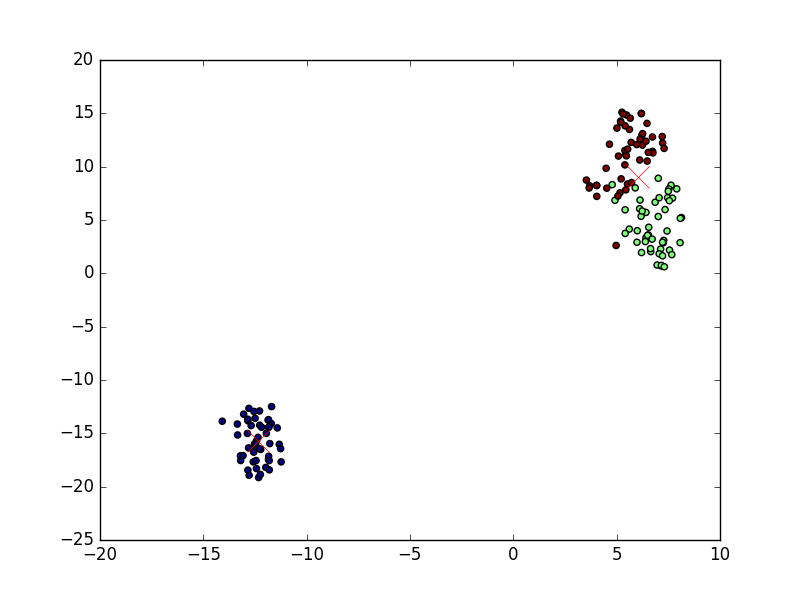
Y = tsne(iris.data)
plt.scatter(Y[:, 0], Y[:, 1], c=iris.target)
plt.show()This should result in:
When adding new data the t-SNE plot can change dramatically (even when setting a random seed). This makes it hard to animate between different plots when data is in motion.
This problem can be partially solved by setting the start coordinates of the first N vectors. In this example we'll create two t-SNE plots, the first one will have part of the iris data set. The second will include the remaining 10 of the iris set:
from bhtsne import tsne
from sklearn.datasets import load_iris
iris = load_iris()
X_a = load_iris().data[:-10]
X_b = load_iris().data
# Generate random positions for last 10 items
remainder_positions = np.array([
[(random.uniform(0, 1) * 0.0001), (random.uniform(0, 1) * 0.0001)]
for x in range(X_b.shape[0] - Y_a.shape[0])
])
# Append them to previous TSNE output and use as seed_positions in next plot
seed_positions = np.vstack((Y_a, remainder_positions))
Y_b = tsne(X_b, seed_positions=seed_positions)
plt.scatter(Y_a[:, 0], Y_a[:, 1], c='b')
plt.scatter(Y_b[:-10, 0], Y_b[:-10, 1], c='r')
plt.scatter(Y_b[-10:, 0], Y_b[-10:, 1], c='g')
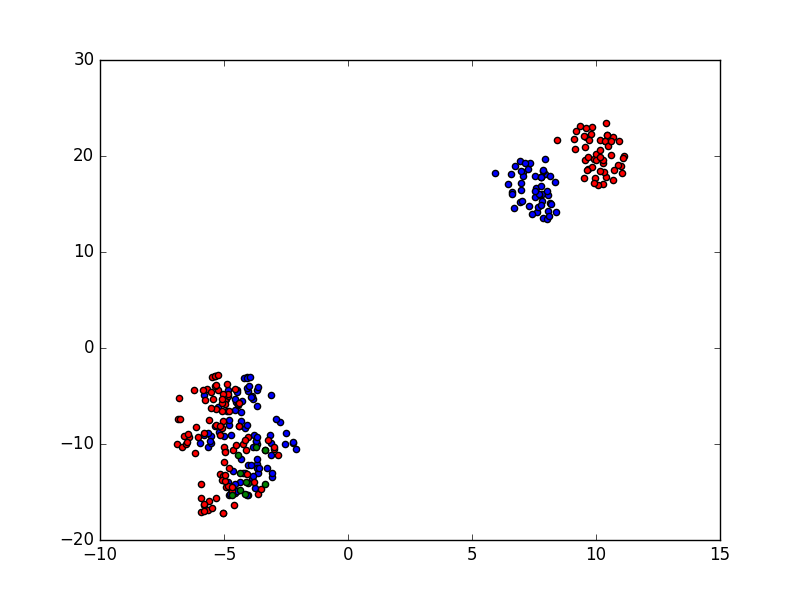
plt.show()The resulting plot shows our first iteration in blue. Then the second iteration is shown in red and the new nodes that were added are green:
Build:
pip install cython
make
To run unit tests:
make testAlso creates visual plots in the test/plots folder.
- Allow more sophisticated control of updates to the t-SNE (streaming/online t-SNE)
- Allow more control on the number of iterations and error rate thresholds