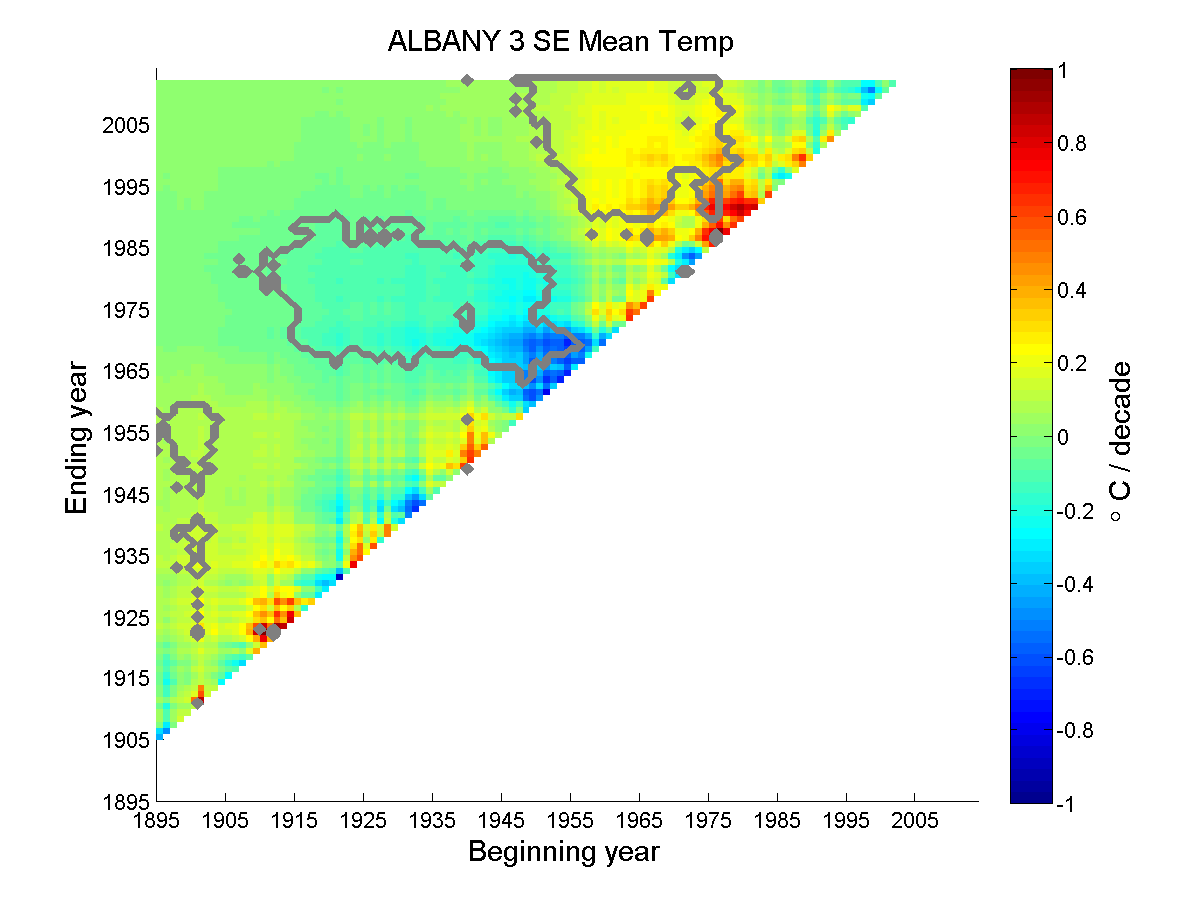
running-Mann-Kendall-plots
plot running mann-kendall trends
This is a set of MATLAB scripts for creating the figures in:
Historical trends in precipitation, temperature and drought in the Alabama–Coosa–Tallapoosa and Apalachicola–Chattahoochee–Flint river basins JJ Maleski, CJ Martinez - International Journal of Climatology, 2017 https://doi.org/10.1002/joc.4723
Example data is included in an excel file.
Run scripts in this order:
1 calculate running mann kendall (RMK_annual)
2 calculate field significance (RMK_FS_annual)
3 plot (plot_annual_RMK)
Example Figure Mean Tempearture trends (grey outlines indicate field signifcant trends)
