- Library to display maps using
three.js. Allows for full world scale visualization of geographic data using tile based chunks. - Can generate 3D geometry for terrain from terrain height data using software generated tiles or using GPU displacement maps.
- Supports multiple maps service providers (BingMaps, GoogleMaps, HereMaps, MapBox, MapTiler, OpenMapTiles, OpenStreetMaps).
- Each one of these map providers require a developer account and a API configuration to be used.
- Its possible to implement new provides using the
MapProviderinterface. - Providers should have a tile based map system to be supported by the library.
- You can test the live demo of the library running from the GitHub page.
- To add the library to your project get the library trough NPM alongside with three.js and use it as a ES module.
- You can also include the library directly in you webpage but ensure first that THREE is available globally.
// Create a map tiles provider object
var provider = new OpenStreetMapsProvider();

// Create the map view and add it to your THREE scene
var map = new MapView(MapView.PLANAR, provider);
scene.add(map);-
Tiles are fetched from the service API configured, each on of the services requires specific configuration using the specific
MapProviderobject. -
Base tiles are always loaded at the beginning of the process, then each frame a couple of rays are casted into the tile tree. The number of rays can be configured using the
MapViewsubdivisionRaysattribute. -
The distance of the ray to the camera is used to define if the node needs to simplified or sub-divided. These values can be configured using the
thresholdUpandthresholdDownvalues.

-
The library as support for multiple data providers that have to be configured beforehand. Most of these data providers rely on external API that differ from service to service.
-
Each one of them has its own provider object implementation of the
MapProviderinterface. -
The
DebugProviderprovides information about the tiles loaded, shows the zoom level and the coordinates of the tile relative to the origin in that specific level.


- The library has support for both planar and spherical representation of tiles. Most providers only have planar tiles available.
- It is required that the tiles for spherical mode are previously adjusted, since planar tiles get more stretched as closer you get to the poles.


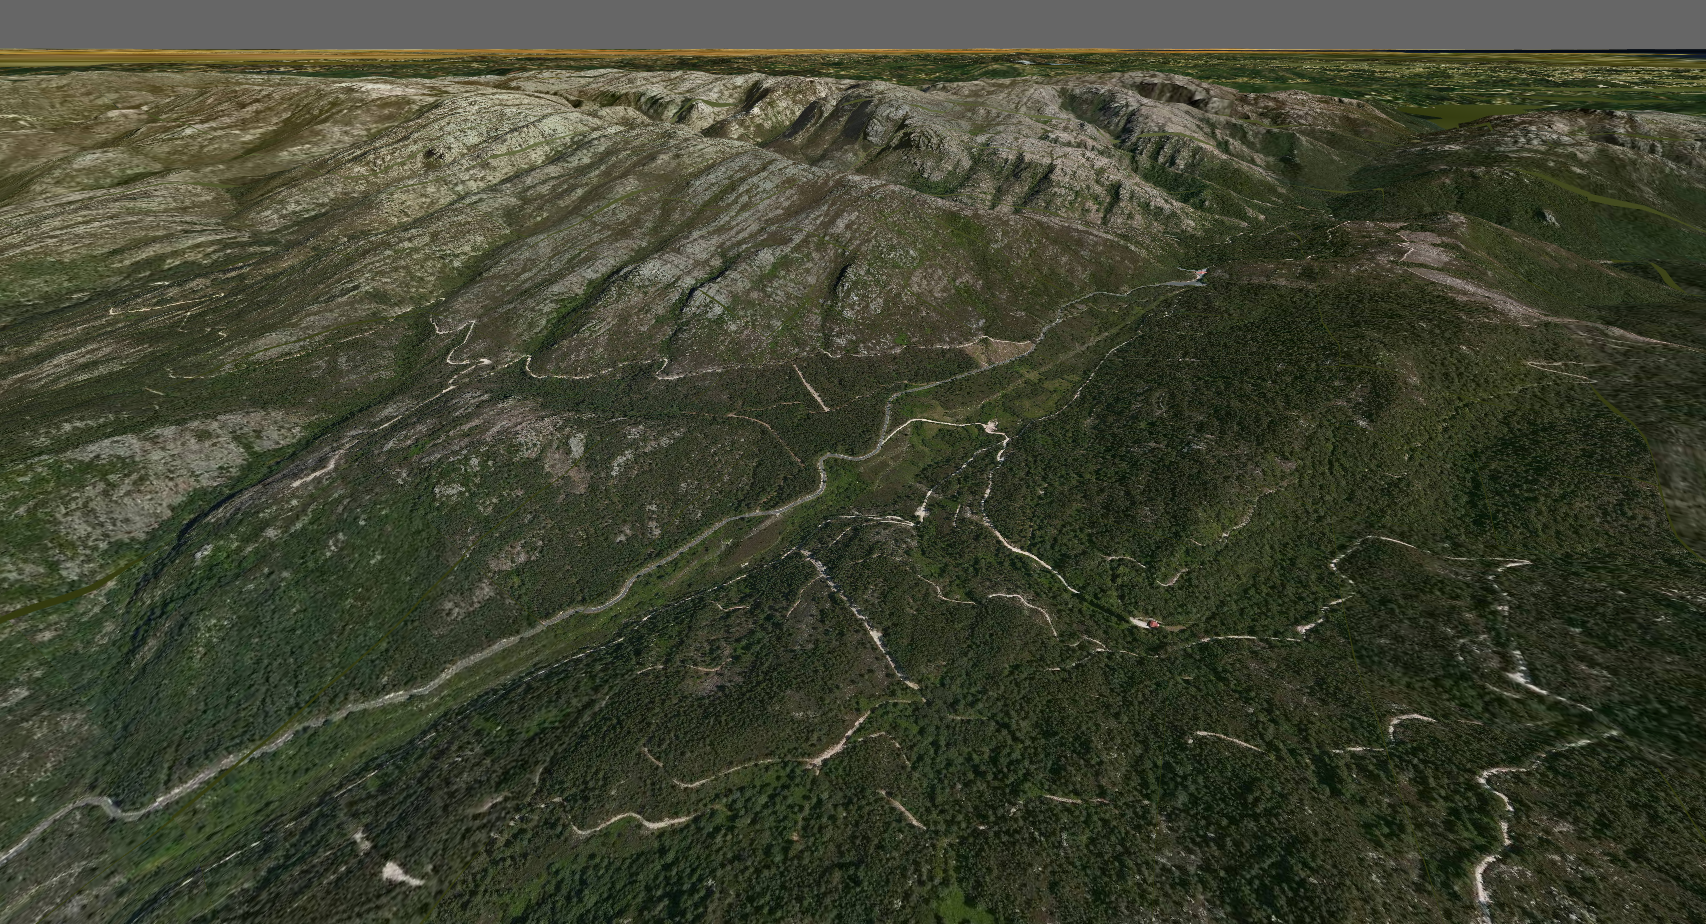
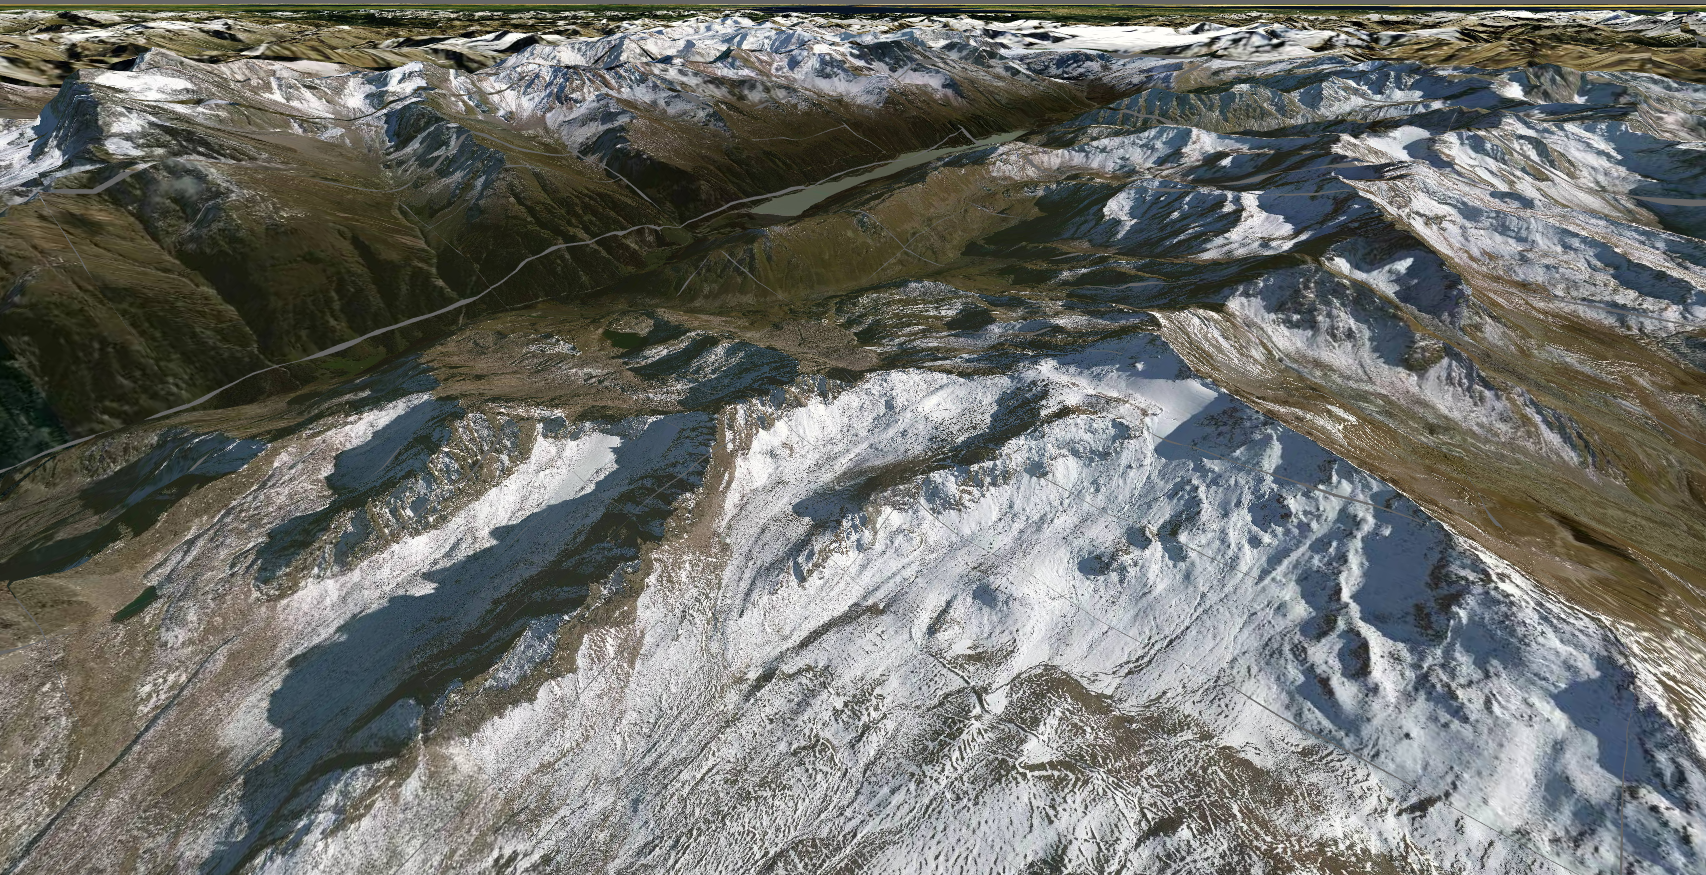
- There are available formats for GPU shader generated geometry using height data directly from the providers.
- GPU generated geometry is more dense, more detailed and a lot faster. But the final geometry used is not accessible for raycasting, so interaction with these geometries is limited.
- On the left the geometry was generated in CPU and on the right the geometry was displaced directly in the vertex shader.

- It is possible to create new data providers to access data other tile sources. New data sources have to provide access to the rasterized tile as a compatible DOM element (e.g. Image, Canvas, ...)
- Custom providers have to extend the base
MapProviderclass and implement thefetchTile(zoom, x, y)method that returns aPromisewith access to the tile data. - Bellow is an implementation of a provider to access OpenStreetMaps tile data using the Tile API the provider simply loads the URL data into a image element.
- These methods are called directly by nodes being loaded into the scene. These should be always asynchronous and should avoid any blocking actions.
export class OpenStreetMapsProvider extends MapProvider
{
	constructor(address) {super();}

	fetchTile(zoom, x, y)
	{
		return new Promise((resolve, reject) =>
		{
			var image = document.createElement("img");
			image.onload = function(){resolve(image);};
			image.onerror = function(){reject();};
			image.crossOrigin = "Anonymous";
			image.src = "https://a.tile.openstreetmap.org/" + zoom + "/" + x + "/" + y + ".png";
		});
	}
}- Tiles coordinates for each zoom level are counted from the left-top corner sequentially across the tiles.
- Different API's might use different methods to index these tiles (e.g. Bing maps uses a different indexing method).
- These coordinates need to be adapted to ensure correct loading when using this library.

- It is also possible to create fictional tiles without any external API to generate tiles by writing data directly into a canvas or even using a local image database to draw the map.
- The code bellow shows how to implement a tile provided that draws a gradient from blue to red based on the zoom level of the tile with 16x16 pixels. This example can be used as basis for other code based tile generators.
import {Color} from "three";

export class BlueToRedProvider extends MapProvider
{
	fetchTile(zoom, x, y)
	{
		const canvas = new OffscreenCanvas(16, 16);
		const context = canvas.getContext('2d');

		const blue = new Color(0x0000FF);
		const red = new Color(0xFF0000);
		const color = blue.lerpHSL(red, (zoom - this.minZoom) / (this.maxZoom - this.minZoom));

		context.fillStyle = color.getStyle();
		context.fillRect(0, 0, 16, 16);
		return Promise.resolve(canvas);
	}
}- Project uses a MIT license that allow for commercial usage of the platform without any cost.
- The license is available on the project GitHub page