spectrum
Spectrum is a library containing signal analysis routines with a focus towards spectral routines.
Status
Documentation
The documentation can be found here.
Building Spectrum
CMakeThis library can be built using CMake. For instructions see Running CMake.
FPM can also be used to build this library using the provided fpm.toml.
fpm buildThe SPECTRUM library can be used within your FPM project by adding the following to your fpm.toml file.
[dependencies]
spectrum = { git = "https://github.com/jchristopherson/spectrum" }
External Libraries
The FPLOT library depends upon the following libraries.
Spectrum contains a large selection of signal processing routines. The following examples illustrate some of the spectral capabilities in addition to some of the filtering options available.
Example 1
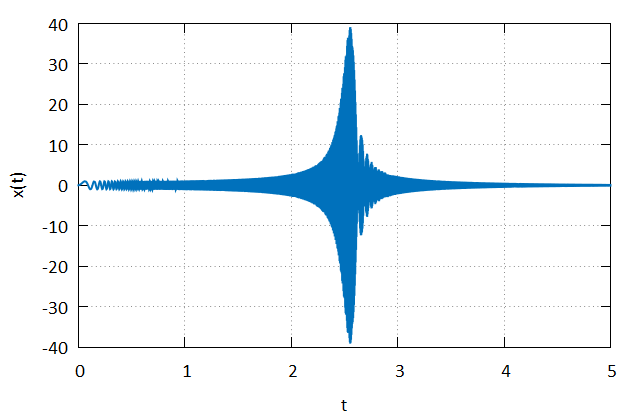
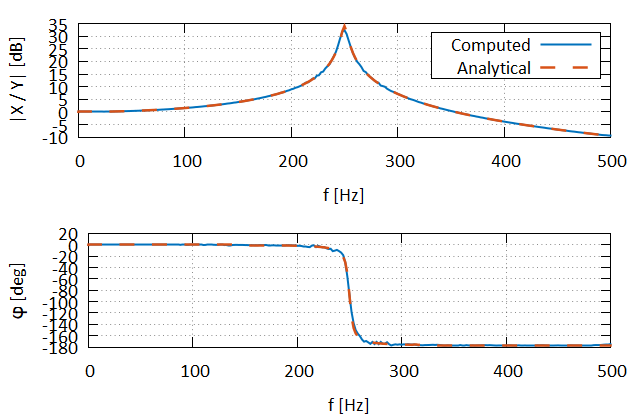
This example illustrates the calculation of a single-input/single-output (SISO) transfer function from a signal stored in a CSV file. This example utilizes the fplot library for plotting and the fortran-csv-module library for reading the CSV file.
program example
    use iso_fortran_env
    use spectrum
    use fplot_core
    use csv_module
    implicit none

    ! Parameters
    integer(int32), parameter :: winsize = 1024
    integer(int32), parameter :: nxfrm = winsize / 2 + 1
    real(real64), parameter :: pi = 2.0d0 * acos(0.0d0)
    complex(real64), parameter :: j = (0.0d0, 1.0d0)
    real(real64), parameter :: zeta = 1.0d-2
    real(real64), parameter :: fn = 2.5d2
    real(real64), parameter :: wn = 2.0d0 * pi * fn

    ! Local Variables
    logical :: ok
    integer(int32) :: i
    real(real64) :: dt, fs, df, freq(nxfrm)
    real(real64), allocatable, dimension(:) :: t, x, y, mag, phase, maga, pa
    complex(real64), allocatable, dimension(:) :: tf, s, tfa
    type(hamming_window) :: win
    type(csv_file) :: file

    ! Plot Variables
    type(multiplot) :: mplt
    type(plot_2d) :: plt, plt1, plt2
    type(plot_data_2d) :: pd, pda
    class(plot_axis), pointer :: xAxis, yAxis
    class(legend), pointer :: lgnd

    ! Import time history data
    call file%read("files/chirp.csv", status_ok = ok)
    call file%get(1, t, ok)
    call file%get(2, y, ok)
    call file%get(3, x, ok)

    ! Determine the sample rate
    dt = t(2) - t(1)
    fs = 1.0d0 / dt
    print 100, "Sample Rate: ", fs, " Hz"

    ! Compute the transfer function
    win%size = winsize
    tf = siso_transfer_function(win, y, x)

    ! Compute the frequency, magnitude, and phase
    df = frequency_bin_width(fs, winsize)
    freq = (/ (df * i, i = 0, nxfrm - 1) /)
    mag = 2.0d1 * log10(abs(tf))    ! Convert to dB
    phase = atan2(aimag(tf), real(tf))
    call unwrap(phase, pi / 2.0d0)

    ! Compare to the analytical solution
    s = j * (2.0d0 * pi * freq)
    tfa = (2.0d0 * zeta * wn * s + wn**2) / &
        (s**2 + 2.0d0 * zeta * wn * s + wn**2)
    maga = 2.0d1 * log10(abs(tfa))
    pa = atan2(aimag(tfa), real(tfa))
    call unwrap(phase, pi / 2.0d0)

    ! Set up the plot objects
    call plt%initialize()
    xAxis => plt%get_x_axis()
    yAxis => plt%get_y_axis()

    ! Plot the time signal
    call xAxis%set_title("t")
    call yAxis%set_title("x(t)")

    call pd%define_data(t, x)
    call pd%set_line_width(2.0)
    call plt%push(pd)
    call plt%draw()

    ! Plot the transfer function
    call mplt%initialize(2, 1)
    call plt1%initialize()
    call plt2%initialize()

    ! Plot the magnitude component
    xAxis => plt1%get_x_axis()
    yAxis => plt1%get_y_axis()
    lgnd => plt1%get_legend()
    call xAxis%set_title("f [Hz]")
    call xAxis%set_autoscale(.false.)
    call xAxis%set_limits(0.0d0, 5.0d2)
    call yAxis%set_title("|X / Y| [dB]")
    call lgnd%set_is_visible(.true.)

    call pd%define_data(freq, mag)
    call pd%set_name("Computed")
    call plt1%push(pd)

    call pda%define_data(freq, maga)
    call pda%set_name("Analytical")
    call pda%set_line_style(LINE_DASHED)
    call pda%set_line_width(2.5)
    call plt1%push(pda)

    ! Plot the phase component
    xAxis => plt2%get_x_axis()
    yAxis => plt2%get_y_axis()
    call xAxis%set_title("f [Hz]")
    call xAxis%set_autoscale(.false.)
    call xAxis%set_limits(0.0d0, 5.0d2)
    call yAxis%set_title("{/Symbol f} [deg]")

    call pd%define_data(freq, phase * 1.8d2 / pi)
    call plt2%push(pd)

    call pda%define_data(freq, pa * 1.8d2 / pi)
    call plt2%push(pda)

    call mplt%set(1, 1, plt1)
    call mplt%set(2, 1, plt2)
    call mplt%draw()

    ! Formatting
100 format(A, F6.1, A)
end program
This example produces the following plots.
Example 2
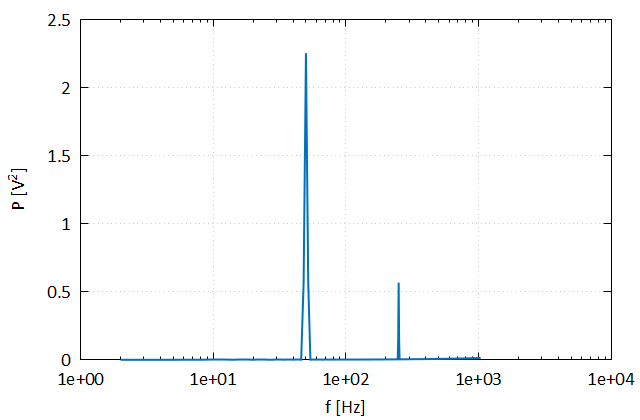
This example illustrates the calculation of the power-spectral-density (PSD) of a signal. This example also utilizes the fplot library for plotting.
program example
    use iso_fortran_env
    use spectrum
    use fplot_core
    implicit none

    ! Parameters
    integer(int32), parameter :: npts = 20000
    integer(int32), parameter :: winsize = 1024
    real(real64), parameter :: sample_rate = 2.048d3
    real(real64), parameter :: freq1 = 5.0d1
    real(real64), parameter :: freq2 = 2.5d2
    real(real64), parameter :: phase1 = 0.0d0
    real(real64), parameter :: phase2 = 4.5d1
    real(real64), parameter :: pi = 2.0d0 * acos(0.0d0)
    real(real64), parameter :: amp1 = 1.5d0
    real(real64), parameter :: amp2 = 7.5d-1

    ! Local Variables
    integer(int32) :: i, nxfrm
    real(real64) :: df, dt, t(npts), x(npts)
    real(real64), allocatable, dimension(:) :: pwr, freq
    type(hann_window) :: win

    ! Plot Variables
    type(plot_2d) :: plt
    type(plot_data_2d) :: pd
    class(plot_axis), pointer :: xAxis, yAxis

    ! Build the signal - assume units of V
    dt = 1.0d0 / sample_rate
    t = (/ (dt * i, i = 0, npts - 1) /)
    x = amp1 * sin(2.0d0 * pi * freq1 * t - pi * phase1 / 1.8d2) + &
        amp2 * sin(2.0d0 * pi * freq2 * t - pi * phase2 / 1.8d2)

    ! Define the window
    win%size = winsize

    ! Compute the PSD
    pwr = psd(win, x)

    ! Build a corresponding array of frequency values
    df = frequency_bin_width(sample_rate, winsize)
    allocate(freq(size(pwr)))
    freq = (/ (df * i, i = 0, size(pwr) - 1) /)

    ! Plot the spectrum
    call plt%initialize()
    xAxis => plt%get_x_axis()
    yAxis => plt%get_y_axis()

    call xAxis%set_title("f [Hz]")
    call yAxis%set_title("P [V^{2}]")

    call xAxis%set_is_log_scaled(.true.)
    call xAxis%set_use_default_tic_label_format(.false.)
    call xAxis%set_tic_label_format("%0.0e")

    call pd%define_data(freq, pwr)
    call pd%set_line_width(2.0)
    call plt%push(pd)
    call plt%draw()
end program
This example produces the following plots.
Example 3
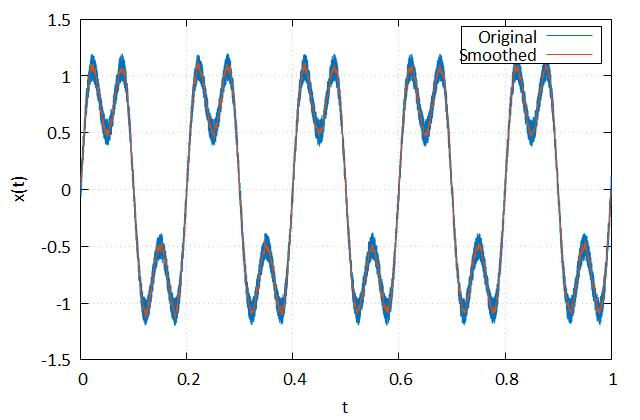
This example highlights some of the filtering capabilities; specifically, Gaussian filtering.
program example
    use iso_fortran_env
    use spectrum
    use fplot_core
    implicit none

    ! Parameters
    integer(int32), parameter :: npts = 10000
    real(real64), parameter :: pi = 2.0d0 * acos(0.0d0)
    real(real64), parameter :: f1 = 5.0d0
    real(real64), parameter :: f2 = 1.5d1
    real(real64), parameter :: alpha = 3.0d0

    ! Local Variables
    integer(int32) :: i, k
    real(real64) :: t(npts), x(npts), y(npts)

    ! Plot Variables
    type(plot_2d) :: plt
    type(plot_data_2d) :: d1, d2
    class(plot_axis), pointer :: xAxis, yAxis
    class(legend), pointer :: lgnd

    ! Build the signal
    t = linspace(0.0d0, 1.0d0, npts)
    call random_number(x)
    x = 0.25d0 * (x - 0.5d0) + sin(2.0d0 * pi * f1 * t) + &
        0.5 * sin(2.0d0 * pi * f2 * t)

    ! Apply the filter
    ! - alpha = 3
    ! - kernel size = 21
    y = gaussian_filter(x, 3.0d0, 21)

    ! Plot the results
    call plt%initialize()
    xAxis => plt%get_x_axis()
    yAxis => plt%get_y_axis()
    lgnd => plt%get_legend()

    call xAxis%set_title("t")
    call yAxis%set_title("x(t)")
    call lgnd%set_is_visible(.true.)

    call d1%define_data(t, x)
    call d1%set_name("Original")
    call plt%push(d1)

    call d2%define_data(t, y)
    call d2%set_name("Smoothed")
    call plt%push(d2)

    call plt%draw()
end program
This example produces the following plots.
References
- Welch, P.D. (1967). The Use of Fast Fourier Transform for the Estimation of Power Spectra: A Method Based on Time Averaging Over Short, Modified Periodograms. IEEE Transactions on Audio and Electroacoustics, AU-15 (2): 70-73.
- Stoica, Petre, and Randolph Moses. Spectral Analysis of Signals. Upper Saddle River, NJ: Prentice Hall, 2005.
- William H. Press, Saul A. Teukolsky, William T. Vetterling, and Brian P. Flannery. 2007. Numerical Recipes 3rd Edition: The Art of Scientific Computing (3rd. ed.). Cambridge University Press, USA.
- Millioz, Fabien & Martin, Nadine. (2011). Circularity of the STFT and Spectral Kurtosis for Time-Frequency Segmentation in Gaussian Environment. Signal Processing, IEEE Transactions on. 59. 515 - 524. 10.1109/TSP.2010.2081986.
- Wikipedia Contributors. (2022, February 9). Welch’s method. Wikipedia; Wikimedia Foundation. https://en.wikipedia.org/wiki/Welch%27s_method
- Spectral density. (2023, April 9). Wikipedia. https://en.wikipedia.org/wiki/Spectral_density#Cross-spectral_density
- Wikipedia Contributors. (2019, April 12). Short-time Fourier transform. Wikipedia; Wikimedia Foundation. https://en.wikipedia.org/wiki/Short-time_Fourier_transform
- Window function. (2020, December 12). Wikipedia. https://en.wikipedia.org/wiki/Window_function
- Wikipedia Contributors. (2019, March 22). Gaussian filter. Wikipedia; Wikimedia Foundation. https://en.wikipedia.org/wiki/Gaussian_filter
- Selesnick Andilker Bayram, I. (2010). Total Variation Filtering. https://eeweb.engineering.nyu.edu/iselesni/lecture_notes/TV_filtering.pdf
- Unavane, T., & Panse. (2015). New Method for Online Frequency Response Function Estimation Using Circular Queue. INTERNATIONAL JOURNAL for RESEARCH in EMERGING SCIENCE and TECHNOLOGY, 2. https://ijrest.net/downloads/volume-2/issue-6/pid-ijrest-26201530.pdf


