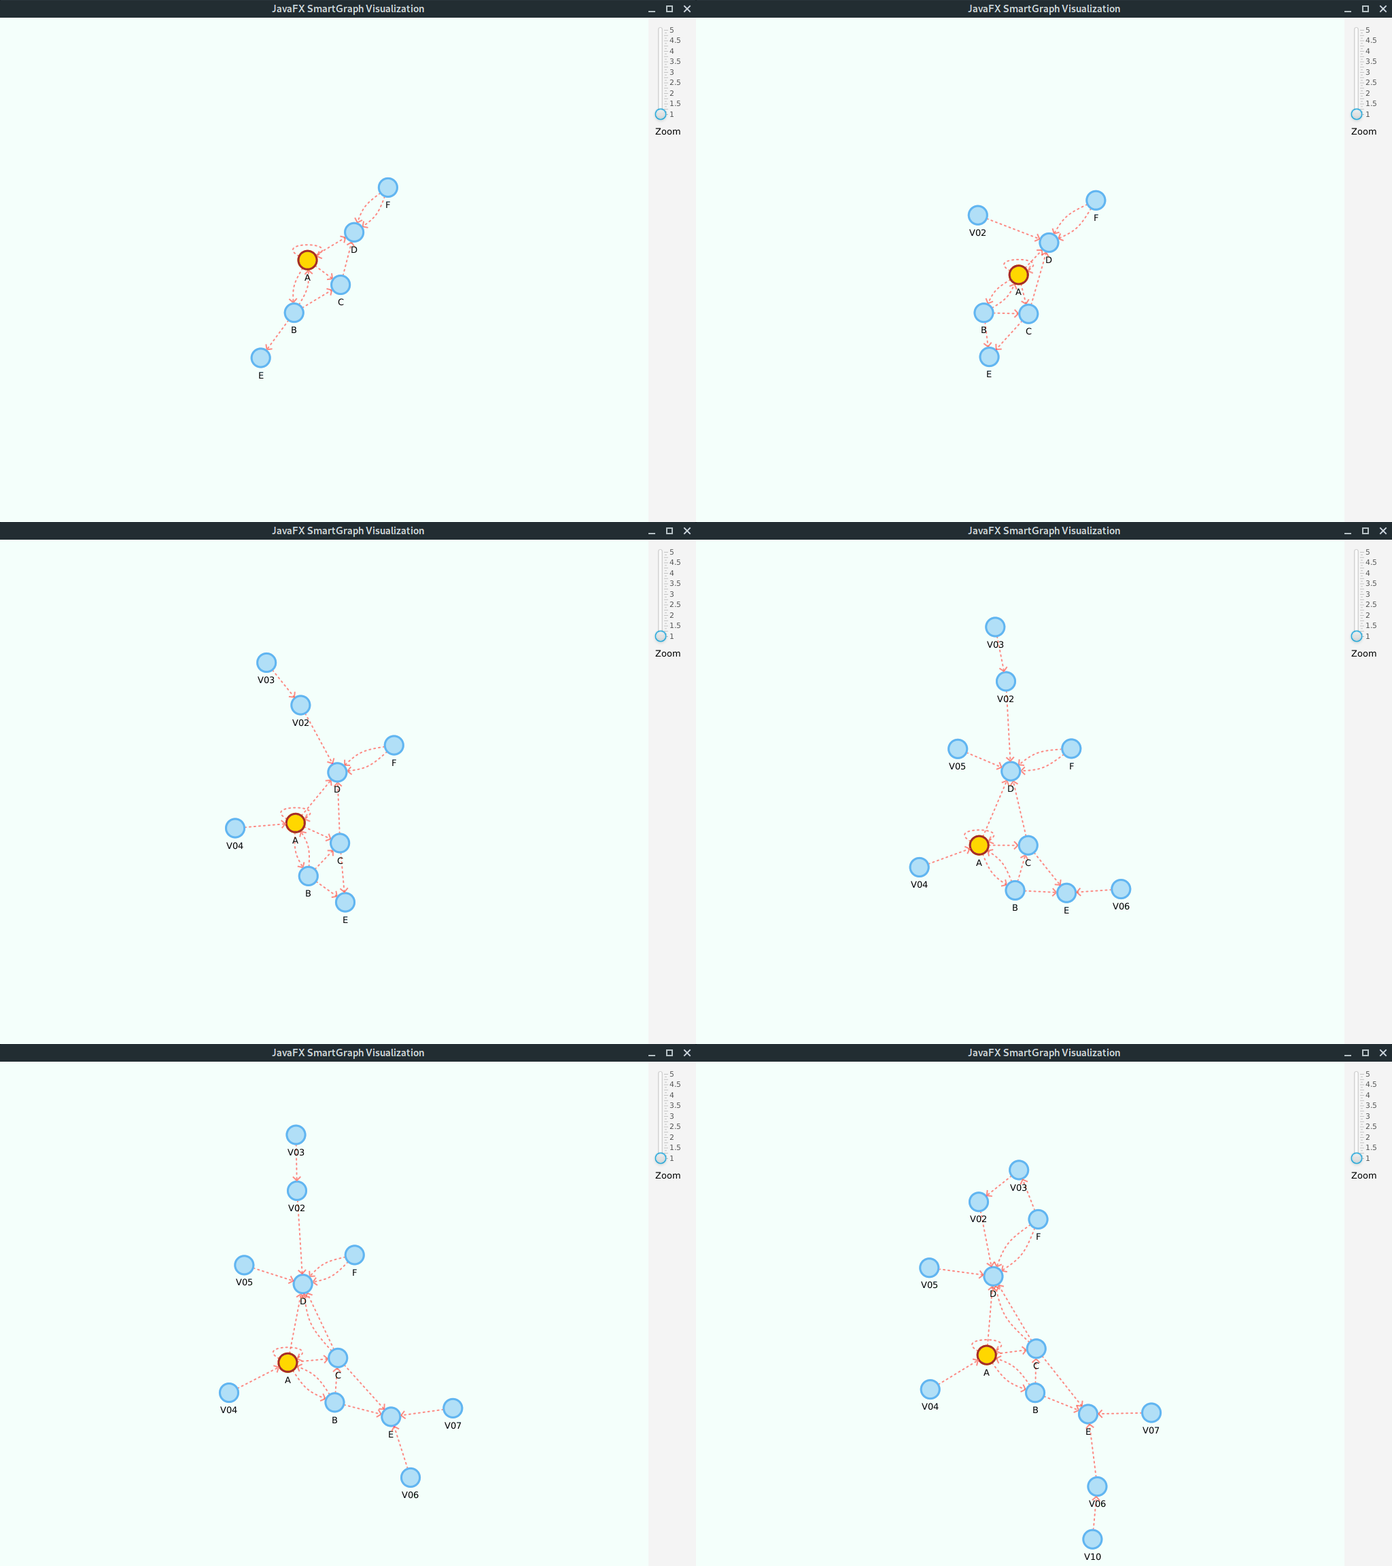
This project provides a generic (Java FX) graph visualization library that can automatically arrange the vertices' locations through a force-directed algorithm in real-time.
You can, instead, statically place the vertices according to other algorithms.
Vertices and edges can be styled through a css stylesheet or programmatically (even at runtime).
You need a working JDK with JavaFX libraries to compile/use the library. The code was tested with JDK 8 and OpenJDK 11.
Check the releases folder for compiled library and source code. The jar library is the only requirement, but if you need to attach the javadoc and source code in your IDE, additionally use the zip file.
The visualization library can be used together with any ADT that adheres to the Graph<V,E> or Digraph<V,E> interfaces. Sample implementations are included.
Since the visualization is computation-intensive during automatic force-directed layout of vertices, you should make sure that the graphics card is used to offload much of the work. This is only guaranteed to work with Oracle's JDK.
In windows the JVM machine should automatically take care of that, while in Linux you must configure it manually with the -Dsun.java2d.opengl=True flag.
//create the graph
Graph<String, String> g = new GraphEdgeList<>();
//... see example below

SmartPlacementStrategy strategy = new SmartCircularSortedPlacementStrategy();
SmartGraphPanel<String, String> graphView = new SmartGraphPanel<>(g, strategy);
Scene scene = new Scene(graphView, 1024, 768);

Stage stage = new Stage(StageStyle.DECORATED);
stage.setTitle("JavaFXGraph Visualization");
stage.setScene(scene);
stage.show();

//IMPORTANT - Called after scene is displayed so we can have width and height values
graphView.init();
This will display the graph using the instantiated placement strategy. You can create your own static placement strategies by implementing the SmartPlacementStrategy interface (see included examples).
You can toggle (true/false) the automatic arrangement of vertices in real-time with:
graphView.setAutomaticLayout(true);or bind the corresponding property to any observable value:
CheckBox automatic = new CheckBox("Automatic layout");
automatic.selectedProperty().bindBidirectional(graphView.automaticLayoutProperty());You can attach actions with:
graphView.setVertexDoubleClickAction(graphVertex -> {
    System.out.println("Vertex contains element: " + graphVertex.getUnderlyingVertex().element());
});

graphView.setEdgeDoubleClickAction(graphEdge -> {
    System.out.println("Edge contains element: " + graphEdge.getUnderlyingEdge().element());
    //dynamically change the style, can also be done for a vertex
    graphEdge.setStyle("-fx-stroke: black; -fx-stroke-width: 2;");
});
These actions will be performed whenever you double click a vertex and/or an edge.
When you make changes to the graph, you can update the visualization by calling
graphView.update();this will add/remove the corresponding vertices and edges from the visualization. If a new vertex is connected to an existing one, it will be initially placed in the vicinity of the later. Otherwise, if it is an isolated vertex it will be placed in the center of the plot.
You can set the graph visualization properties in the smartgraph.properties file:
# Vertex related configurations
#
vertex.allow-user-move = true
vertex.radius = 15
vertex.tooltip = true
vertex.label = false

# Edge related configurations
#
edge.tooltip = true
edge.label = false
# only makes sense if displaying an oriented graph
edge.arrow = false

# (automatic) Force-directed layout related configurations
#   -- You should experiment with different values for your
#   -- particular problem, knowing that not all will achieve
#   -- a stable state
layout.repulsive-force = 5000
layout.attraction-force = 30
layout.attraction-scale = 10You can set the default CSS styles in the smartgraph.css file:
.graph {
    -fx-background-color: #F4FFFB;
}

.vertex {
    -fx-stroke-width: 3;
    -fx-stroke: #61B5F1;
    -fx-stroke-type: inside; /* you should keep this for vertex.radius to hold */
    -fx-fill: #B1DFF7;
}

.vertex-label {
    -fx-font: bold 8pt "sans-serif";
}

.edge {
    -fx-stroke-width: 2;
    -fx-stroke: #FF6D66;
    -fx-stroke-dash-array: 2 5 2 5; /* remove for clean edges */
    -fx-fill: transparent; /*important for curved edges. do not remove */
    -fx-stroke-line-cap: round;
    -fx-opacity: 0.8;
}

.edge-label {
    -fx-font: normal 5pt "sans-serif";
}

.arrow {
    -fx-stroke-width: 2;
    -fx-stroke: #FF6D66;
    -fx-opacity: 0.8;
}Below are provided some graphs and the corresponding visualization, either using a static placement strategy or by the automatic force-directed layout algorithm.
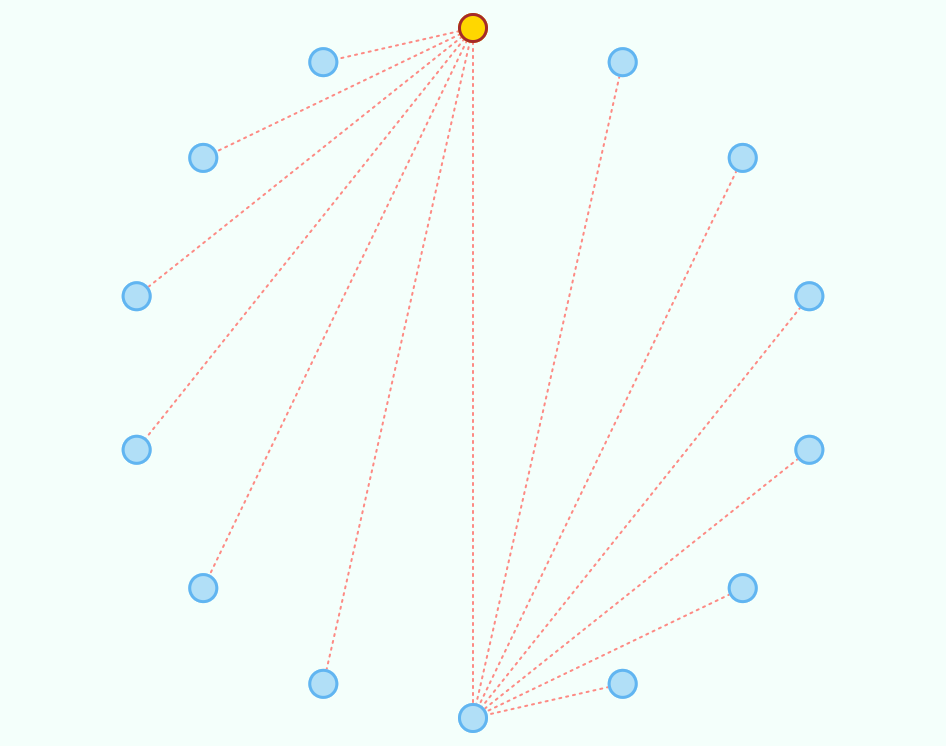
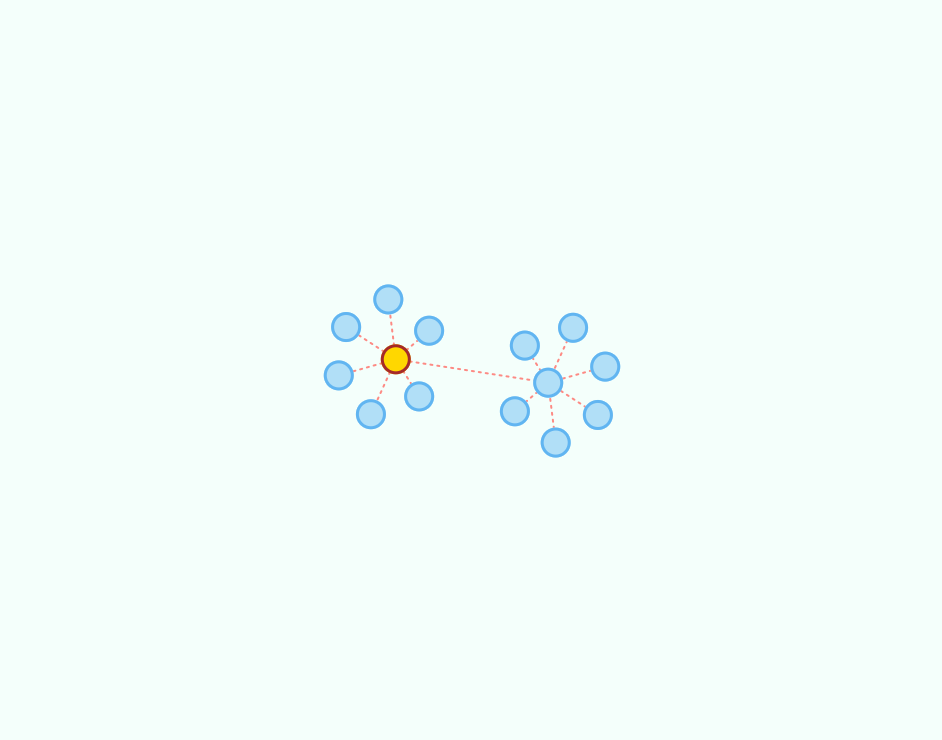
The following code creates a sample graph:
Graph<String, String> g = new GraphEdgeList<>();

g.insertVertex("A");
g.insertVertex("B");
g.insertVertex("C");
g.insertVertex("D");
g.insertVertex("E");
g.insertVertex("F");
g.insertVertex("G");

g.insertEdge("A", "B", "1");
g.insertEdge("A", "C", "2");
g.insertEdge("A", "D", "3");
g.insertEdge("A", "E", "4");
g.insertEdge("A", "F", "5");
g.insertEdge("A", "G", "6");

g.insertVertex("H");
g.insertVertex("I");
g.insertVertex("J");
g.insertVertex("K");
g.insertVertex("L");
g.insertVertex("M");
g.insertVertex("N");

g.insertEdge("H", "I", "7");
g.insertEdge("H", "J", "8");
g.insertEdge("H", "K", "9");
g.insertEdge("H", "L", "10");
g.insertEdge("H", "M", "11");
g.insertEdge("H", "N", "12");

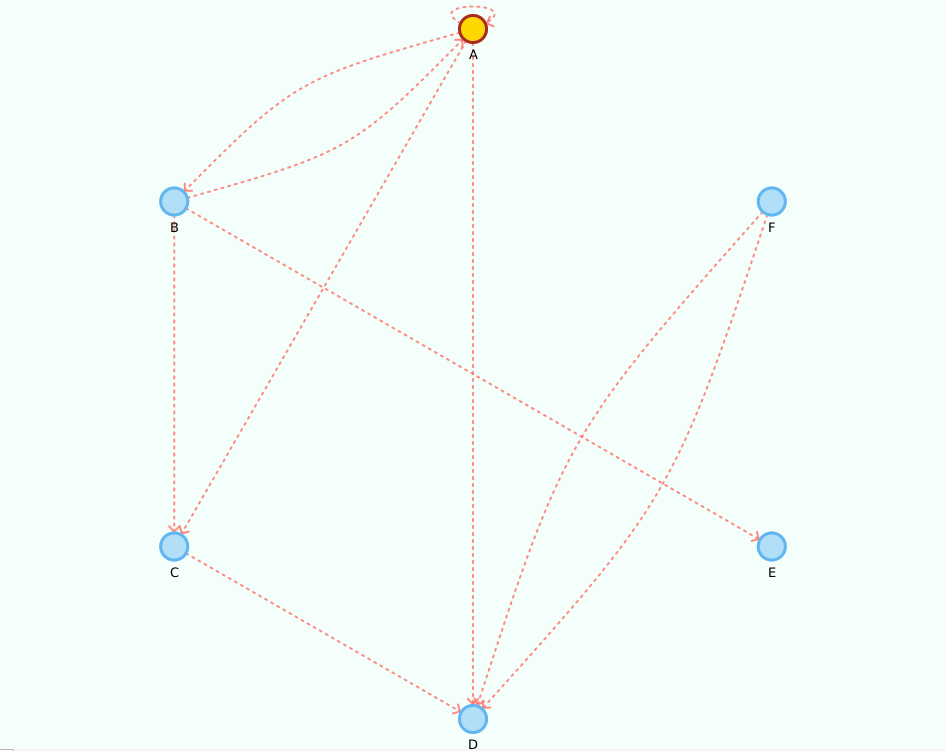
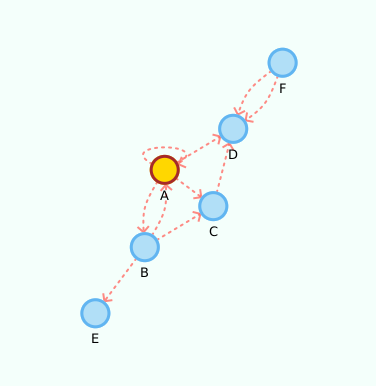
g.insertEdge("A", "H", "0");The following code creates a sample digraph:
Digraph<String, String> g = new DigraphEdgeList<>();

g.insertVertex("A");
g.insertVertex("B");
g.insertVertex("C");
g.insertVertex("D");
g.insertVertex("E");
g.insertVertex("F");

g.insertEdge("A", "B", "AB");
g.insertEdge("B", "A", "AB2");
g.insertEdge("A", "C", "AC");
g.insertEdge("A", "D", "AD");
g.insertEdge("B", "C", "BC");
g.insertEdge("C", "D", "CD");
g.insertEdge("B", "E", "BE");
g.insertEdge("F", "D", "DF");
g.insertEdge("F", "D", "DF2");

//yep, its a loop!
g.insertEdge("A", "A", "Loop");
Please note that we use the property values edge.arrow = true and vertex.label = true.
Given its a small graph, we increased the layout.repulsive-force = 25000. You should use higher values for smaller graphs; inversely, use smaller values for larger graphs.
You can fork this project or submit a pull request. Pull requests should adhere to the existing naming and Javadoc conventions.
- Original author: Bruno Silva - (GitHub page) | (Personal page)
This project is licensed under the MIT License - see the LICENSE file for details. All derivative work should include this license.
